granules positional tradeGranules - A positional trade with RR approx 1:4,
Rising relative strength, inverse head and shoulder pattern with no resistance on left side as the cmp is high of more than 2 years and above fib retracement of 61.8%.
Breakout with good volume.
Volume decreasing during formation of base.
Trade ideas

Granuels India Ltd view for Intraday and short term 29th AugustGranuels India Ltd view for Intraday and short term 29th August #GRANULES
Buying may witness above 711
Support area 700. Below ignoring buying momentum for intraday
Charts for Educational purposes only.
Please follow strict stop loss and risk reward if you follow the level.
Thanks,
V Trade Point

granules tringular break outabove 350
triangular break out showing on chart after longtime
good to buy an hold

GRANULE INDIA S/RSupport and Resistance Levels: In technical analysis, support and resistance levels are significant price levels where buying or selling interest tends to be strong. They are identified based on previous price levels where the price has shown a tendency to reverse or find support.
Support levels are represented by the green line and green shade, indicating areas where buying interest may emerge to prevent further price decline.
Resistance levels are represented by the red line and red shade, indicating areas where selling pressure may arise to prevent further price increases. Traders often consider these levels as potential buying or selling opportunities.
Breakouts: Breakouts occur when the price convincingly moves above a resistance level (red shade) or below a support level (green shade). A bullish breakout above resistance suggests the potential for further price increases, while a bearish breakout below support suggests the potential for further price declines. Traders pay attention to these breakout signals as they may indicate the start of a new trend or significant price movement.
20 EMA: The yellow line denotes 20 EMA, to interpret the 20 EMA, you need to compare it with the prevailing stock price. If the stock price is below the 20 EMA, it signals a possible downtrend. But if the stock price is above the 20 EMA, it signals a possible uptrend.
Disclosure: I am not SEBI registered. The information provided here is for learning purposes only and should not be interpreted as financial advice. It is important to consult with a qualified financial advisor before making any investment decisions. Tweets neither advice nor endorsement.

Granules India Bearish Granules India stock may see a decline tomorrow, after a big rally a bearish doji candle is forming at the upper level. This may probably turn into a reverse trend in the coming sessions


target 644 mina very good uptrend from current market price 20% upside for short term like 3 months stop loss is 500 on daily closing keep riding
remember one thing that if you buy it be patient
disc :- invested

Swing Call on GranulesSwing Call Idea on #Granules. Peforming well , crossed the all time high. in a retest phase chance are abundant to cross the new ATH again.
Views are only personal.


Granuels Intraday level for 5th July #GRANULES Granuels Intraday level for 5th July #GRANULES
Buying opportunity above 517
Stop Loss area 512
Charts for Educational purposes only.
Please follow strict stop loss and risk reward if you follow the level.
Thanks,
V Trade Point

Granules india stock analysisas per my analysis granules india good for long term. first target for me 485.65 and second target will 665

Granuels looking for further breakoutGranuels is testing top of the channel one can enter with 10% of capital above 495 ( CMP 490,) if price comes down will be deploying another 20 % capital more at 480 levels with strict sl at 468 on hourly closing basis. Targets are 500, 505, 510 and 520. Should close the trade if it given 2% returns of deployed capital.
Duration 5 trading days.
Volumes are accumulating rsi nearing 58
www.tradingview.com
Standard Disclaimer - Not a Sebi Registered analyst , consult your financial advisor before investing. Market investment are subjected to risk.

Granules indiaStock has been in an uptrend croosing 52 week high
It has crossed 4 month long cup n handle pattern with volumes
highest open interest is at 500 if crossed that the it can continue its uptrend

target intactto target check chart
fundamental
PE ration low compare to its pears
slitaly pramotars and FI DI also increases stake
now chemical stocks are bullish
all stock are particiated in bull now time to chemical stocks

GRANULES BUY VIEW GRANULES BUY NOW
Trade Reason :
1) Monthly Correction Completed .
2) Day Time - HH and Trendline Breakout
Additional confirmation .
Entry - 433 Rs
Target - 465 Rs
Stoploss - 389 Rs
Use it 10 % potential is there ...

GRANULES - A stock to watchThe stock after facing price rejection around 466 to 480 area was pushed down to the 200 DMA levels. It took support from there and started moving up and now it's making a higher high and higher low. The relative strength is also positive and we can see good volumes coming in. Money is flowing into the stock and the momentum is also positive and increasing. Also, we can see good increase in the delivery volumes recently indicating committed buyers stepping in. A bullish close above 480 would take the stock to the next higher trajectory.

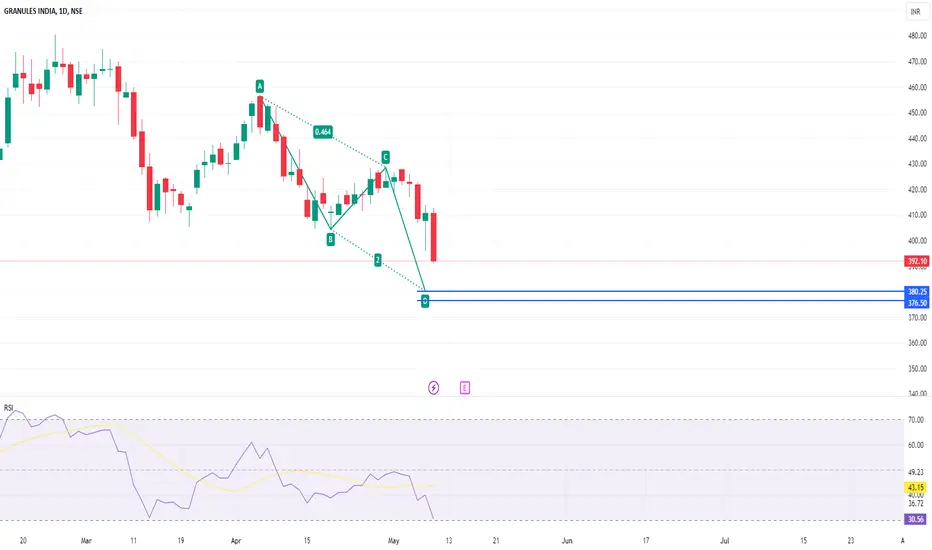
wait for zone
this zone marked is potential reversal zone . expecting reversal from that zone.buyers can look for buying confirmation inside the zone.
-- intraday traders can keep 0.236 fib level of swing C to latest swing low. entry is strictly inside zone. keep sl below zone
-- swing traders can keep 0.5 fib level as tgt.
Granules is ready for break out.From Oct 2020 more than 3 years of stock could not break the 400 level decisively. Maybe now coming to New Year will give a good move.

Granules 4 digits soon!!⭐Granules have come out of consolidation and ✅ now new support has been created above the previous resistance. I.e Rs 400
Soon 4 digits in a years of time ??

Granules long breakout of VCP pattern & third time resistance.Long term it can be a good stock in your pocket. higher chances for the breakout the resistance.

Granules India Long Call
Buy Entry: INR 450
Stop Loss: INR 430
Target Price: INR 530
The risk-to-reward ratio of 1:3 implies that for every unit of risk (INR 20) taken by setting the stop loss at INR 430, there is a potential reward of 3 units (INR 80), with the target price set at INR 530.
Considering the technical analysis and the risk-to-reward ratio of 1:3, let's assess the trade setup:
Based on the analysis provided, I recommend considering a long position in Granules India at around INR 450 per share. It's essential to set a stop loss at INR 430 to manage downside risk and protect capital in case of adverse price movements.
The target price of around INR 530 presents a realistic upside potential based on the technical breakout and market dynamics. This trade is positioned as a shorter-term trade, given the defined target and risk parameters.
Granules India recently experienced a significant breakout above a crucial resistance level, typically observed around INR 440-450. This breakout suggests a shift in market dynamics, indicating increased buying interest and potential bullish sentiment.
The breakout above the resistance level was accompanied by a notable surge in trading volume. Elevated trading volume during a breakout signifies heightened market participation and conviction among investors. It suggests that market participants, including institutional investors and traders, are actively accumulating shares, reinforcing the validity of the upward move.
The combination of the resistance level breakout and the surge in trading volume suggests a bullish momentum in Granules India's stock price

GRANULES LONGATH Breakout.
Rounding Bottom Structure.
Good for Short term and Long term.
Disclaimer : This is not a Buy or Sell recommendation. I am not SEBI Registered. Please consult your financial advisor before making any investments . This is for Educational purpose only.

GRANULES INDIAGranules has breakout ATH resistance level so stock has create good opportunity for swing trade
This is only for educational purpose
