Grasim -- Cup & handle and flag Grasim after good consolidation today grasim gived 3.4% up move maybe more upside moment still pending...
Technical ::-------
1) Cup and handle pattern
2) bullish flag
3) volume also good
up side target 1842 / 1933
GRASIM trade ideas

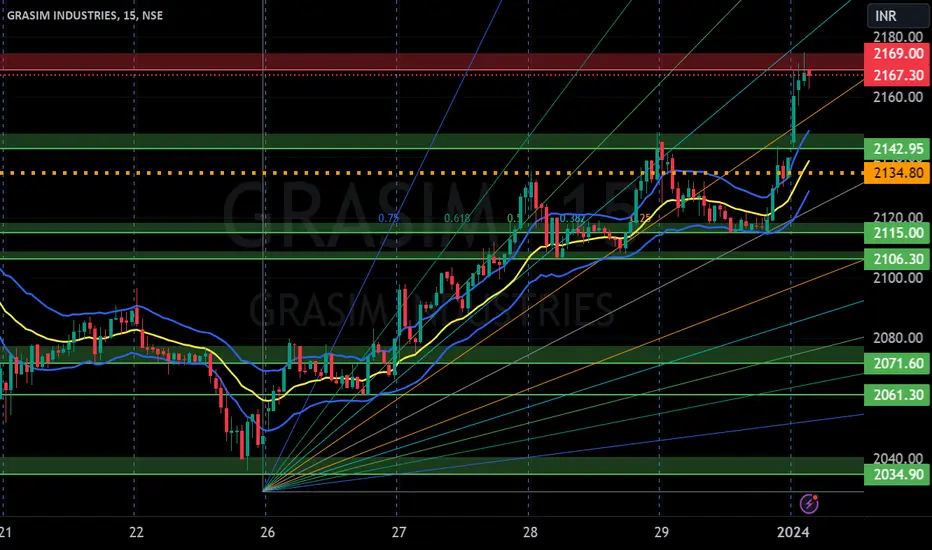
GRASIM INDUSTRIES Support & ResistanceSupport and Resistance Levels:
Based on the price action, you have to identify two significant levels: the red line acting as resistance and the green line acting as support. Additionally, there have marked red and green shades to represent resistance and support zones, respectively.
Support: The green line and green shade represent support levels. These levels are where the price tends to find buying interest, preventing it from falling further. Traders can consider these levels as potential buying opportunities.
Resistance: The red line and red shade represent resistance levels. These levels are where the price tends to encounter selling pressure, preventing it from rising further. Traders can consider these levels as potential selling opportunities.
Breakouts: If the price breaks above the resistance zone (red shade) convincingly, it may indicate a bullish breakout, and the price could move higher to the next resistance level. On the other hand, if the price breaks below the support zone (green shade) convincingly, it may indicate a bearish breakout, and the price could move lower to the next support level.
Keltner Channel:
The Keltner Channel is a technical indicator that uses an exponential moving average (EMA) to create an upper and lower channel around the price action. Traders can use this channel to identify potential long and short positions.
Long Position: If the price is above the upper line of the Keltner Channel, it may indicate a potential long opportunity, as it suggests the price is trading above the average range and might continue in an upward trend.
Short Position: If the price is below the lower line of the Keltner Channel, it may indicate a potential short opportunity, as it suggests the price is trading below the average range and might continue in a downward trend.
Disclosure: I am not SEBI registered. I just wanted to let you know that the information provided here is for learning purposes only. Please consult your financial advisor before making any decisions. Tweets neither advice nor endorsement.
💥Grasim Industries💥-Nice Breakout💥Grasim Industries💥-Nice Breakout
Capital to be deployed- 20k
Investing Price-2082
Breakout Price-2082
Stoploss-1843
Targets-2605-3337
RT for max reach
#grasim #stockstowatch #StocksToBuy #StocksInFocus #stocks #StockMarket

grasim 1w time frame buy@ 1838 target@ 1918, 1969, 1999, 2049, grasim 1w time frame buy@ 1838 target@ 1918, 1969, 1999, 2049, 2097
ascending triangle breakout
risk reward 1:3
sl@1739

GRASIMI am not SEBI register Advisor and I am not any trade and tips recommend here, This Idea post on this Channel Only for educational knowledge & learning purpose, I am not provide any trading tips, Before any Trade Advice your Financial Advisor, I am not responsible any profit and loss

Grasim Industries will go UPWARDS due to Positive Divergence
POSITIVE DIVERGENCE -
A hidden bullish divergence or positive divergence has formed on the daily chart indicating strong upwards movement coming soon
REVERSAL FROM 200D & 50D SMA ("DAILY" CHART) -
Price has also recently tested two sma including testing one 50D twice indicating strong support for move upwards
VOLUME SURGE -
Volume has surged on the daily chart on the day of writing this article
REVERSAL FROM 200D & 50D SMA ("WEEKLY" CHART) -
Price has also consolidated around these two sma from JAN to MAR (2 months) before moving upwards again indicating very strong support level formed

Grasim - Elliott Wave CountGrasim- Elliott Wave Count
It appears that the market correction for Grasim has come to an end, and we can anticipate another upward impulse wave, provided that this week's low remains stable. However, if the market falls below 1828, this view will no longer be applicable.
Please note that this information is for educational purposes only, and it is crucial to trade with caution.
BSE:GRASIM NSE:GRASIM1! NSE:GRASIM

GRASIM Indus. Midterm as 3 Years consolidation Breakout and today Retest done with morning candle, SL is only 4% and expected Return 150% stay tune with me to get more update.

GRASIM Industries For Long 169% return GRASIM Industries For Long 169% return for next 1 and half year.
NSE:GRASIM

GRASIM 📢 Double Top Pattern 📢
CMP: 1077.45
If stock price 1057.50 day closing candle below than bearish movement see in coming days!
These are swing ideas which you can add your watchlist and analysis for yourself !
Keep on your radar 📡
This content only education purpose!
❗I am not sebi ragister❗

Grasim - Elliott Wave CountGrasim - Elliott Wave Count
It appears that the market correction for Grasim has come to an end, and we can anticipate another upward impulse wave, provided that today's low remains stable. However, if the market falls below the current low, this view will no longer be applicable.
Please note that this information is for educational purposes only, and it is crucial to trade with caution.
NSE:GRASIM NSE:GRASIM1! BSE:GRASIM

GrasimGrasim has shown typical pattern of respecting trendline as a resistance.
However I have marked a dotted trendline which is forming structure within structure. In a simple words if Grasim regains prices above previous trendline which overall market sentiment positive then there is good chance for Grasim to go up.
Do not enter early.
This is just for education and no tip.

grasim 1 d time frame channel breakout buy @ 1939 target @ 1983grasim 1 d time frame
channel breakout buy @ 1939 target @ 1983
risk reward 1.1
its just a view trade@ your own risk
sl@ 1895

inverted head and shoulders pattern in Grasim IndustriesGrasim seems to be a BUY with a stoploss below 1705 ... can give good returns in a short term once it crosses 1830 level

GRASIM Trade set up1. Market Trend - Bullish
2. Stock Trend - Bullish
3. Market & Stock both at ATH
4. Breakout - Strong

grasim divergence on day frame rsi divergence is there as well as money flow is towards negative side ...so grasim can correct upto1880

I am buy Grasim Industries Stock.I am buy Grasim Industries Stock. Analysis weekly level and entry in daily time frame.

BULLISH BREAKOUT IN GRASIMBullish breakout in GRASIM.
Entry can be initiated at near current market price.
Stop loss;- Daily close below 1809
Target- 1925
Do follow RISK MANAGEMENT and POSITION SIZING.

inverted head and sholder pattern inverted head and shoulder pattern
entry 1728, 1617..
1617 strong support never break
after 1822 above closing sure take entry
..


Grasim Industries Grasim Industries
P&H Formation on Yearly Basis.
Price BreakOut Needed & To be Sustained.
Then Good to Go!!!
Strong Resistance @1790 /1835.
Trail SL with Upside.
Book Profit as per Risk Appetite.
Do Your Own Research as well.
Happy Investing 😇

GRASIM near its ATH zoneGRASIM is near to its prior ATH zone. Need to breach 1930-1950 zone for further upmove.
