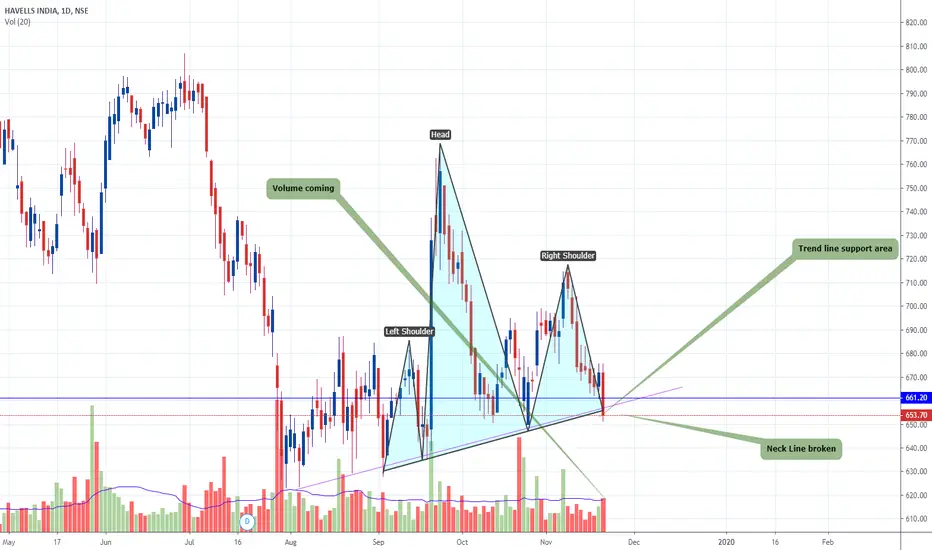
Strong In the Falling Market Havells
Bullish Divergence On Stochastic And MACD
Closed Strong today In the falling Market
Indicates A strong Positive Bull run to me
Stoploss Swing Low
Trade ideas

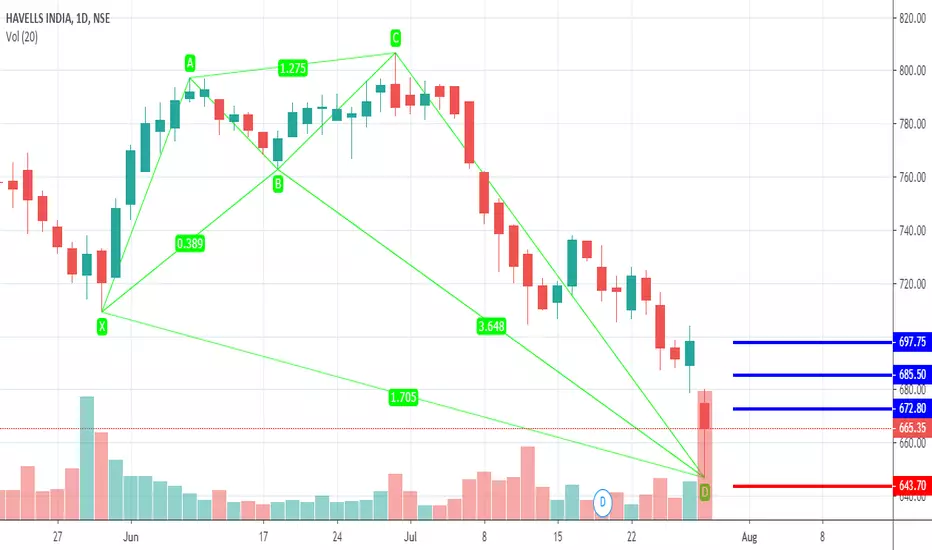
PRZ 647-650 AWAITEDDISCLAIMER :
As a trader you should consider your own risk:reward ratio and do proper lot sizing according to your margin and leverage level.
Not every idea is a valid trade.
This analysis is a trading idea, not a trading signal for you.
My own trend direction estimation, entry point, stop loss and take profit levels are on the chart.
Good Lucks.


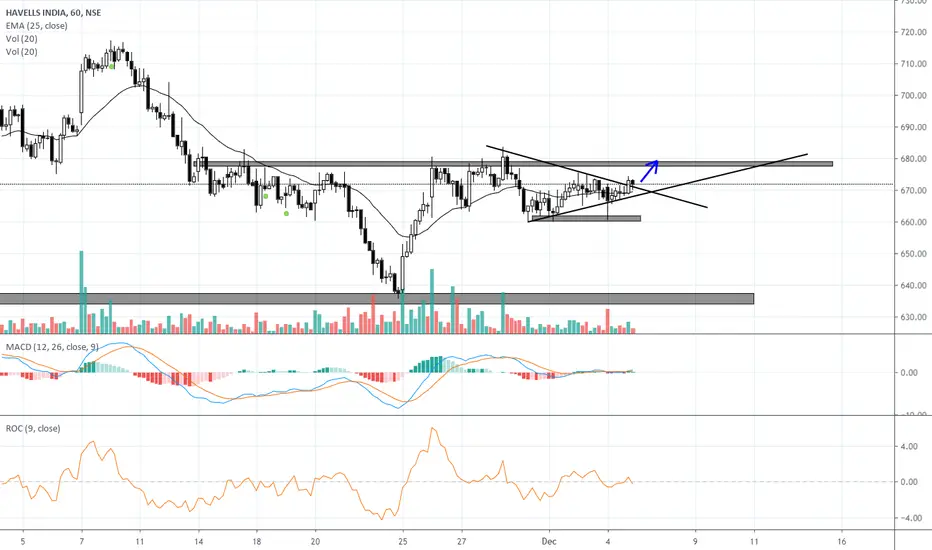
stockhavells had a triangular pattern breakout prices likely to faces resistance near 500 ema . traders if u like my work please press like.


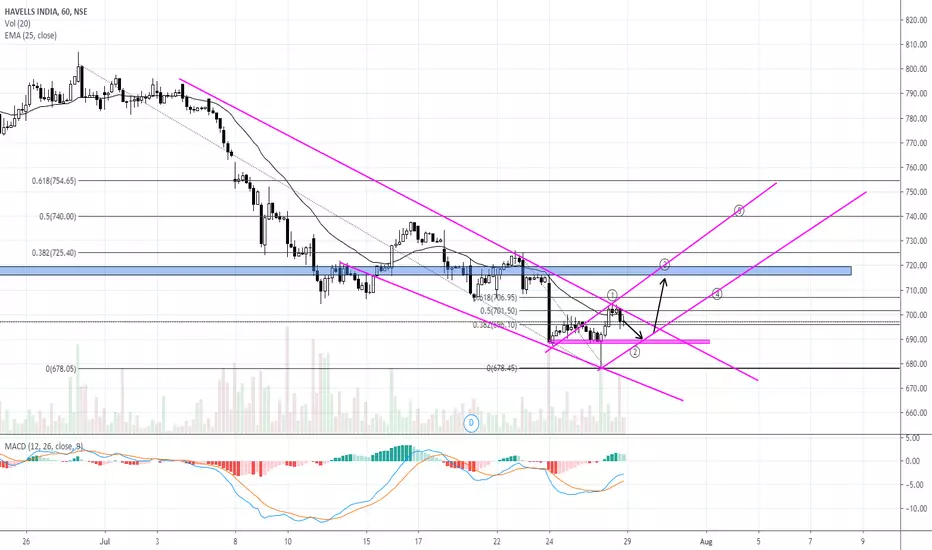
HAVELLS INDIA- Hourly chart showing weakness Hourly chart of Havells India is showing weakness if its break 660 level (Triangle breakdown) or eventually 652 level ( Short term support level) then chart will show downside. 630 will be 1st level to watch and if its break 630 then 590 will be 2nd level to watch.


Havells - Long1) Weekly Parallel Channel
2) Weekly - 100 EMA support
3) Buy zone - 590-640 SL, weekly close below 590

Havells - Long1) Buy zone - 640-590
2) SL - 590 Weekly CLBS
3) Parallel Channel - Weekly
4) Support - 100 EMA Weekly