HINDUSTAN UNILIVER SHORT TERM ANALYSIS Hindustan Unilever appears to be in a favorable position, with a chart indicating a potential upside in the short term. The stock has the potential to reach a target of 2640-2670 upon crossing and sustaining a level of 2490. However, the current view remains invalidated if it breaches 2340 on the downside
Trade ideas

HINDUNILVR Trading Within Fresh Demand ZoneHINDUNILVR is currently trading at ₹2389.2, which places it slightly above its demand zone between ₹2387.45 and ₹2344.3, established on 4th June 2024. This fresh zone has not been tested yet, suggesting the possibility of renewed buying interest if the price dips back into this range. Investors may consider monitoring for support near this level, potentially signaling a bullish opportunity.

HUL S/RSupport and Resistance Levels:
Support Levels: These are price points (green line/shade) where a downward trend may be halted due to a concentration of buying interest. Imagine them as a safety net where buyers step in, preventing further decline.
Resistance Levels: Conversely, resistance levels (red line/shade) are where upward trends might stall due to increased selling interest. They act like a ceiling where sellers come in to push prices down.
Breakouts:
Bullish Breakout: When the price moves above resistance, it often indicates strong buying interest and the potential for a continued uptrend. Traders may view this as a signal to buy or hold.
Bearish Breakout: When the price falls below support, it can signal strong selling interest and the potential for a continued downtrend. Traders might see this as a cue to sell or avoid buying.
20 EMA (Exponential Moving Average):
Above 20 EMA(50 EMA): If the stock price is above the 20 EMA, it suggests a potential uptrend or bullish momentum.
Below 20 EMA: If the stock price is below the 20 EMA, it indicates a potential downtrend or bearish momentum.
Trendline: A trendline is a straight line drawn on a chart to represent the general direction of a data point set.
Uptrend Line: Drawn by connecting the lows in an upward trend. Indicates that the price is moving higher over time. Acts as a support level, where prices tend to bounce upward.
Downtrend Line: Drawn by connecting the highs in a downward trend. Indicates that the price is moving lower over time. It acts as a resistance level, where prices tend to drop.
RSI: RSI readings greater than the 70 level are overbought territory, and RSI readings lower than the 30 level are considered oversold territory.
Combining RSI with Support and Resistance:
Support Level: This is a price level where a stock tends to find buying interest, preventing it from falling further. If RSI is showing an oversold condition (below 30) and the price is near or at a strong support level, it could be a good buy signal.
Resistance Level: This is a price level where a stock tends to find selling interest, preventing it from rising further. If RSI is showing an overbought condition (above 70) and the price is near or at a strong resistance level, it could be a signal to sell or short the asset.

HINDUNILVR Long OpportunityWe can go long from current level (2440 - 2500).This is strong institutional buying zone.
Best Opportunity For Short term investment.
Trade or Investment at your own risk.
i am not SEBI registered.

TredScanner - Stock Scanner for NSEThe market has been volatile since the morning, with FMI fluctuating and it finally stabilized & it signaled SHORT before 10:00 AM.
And we were ready! The top stocks in our FMI BREAKDOWN section were the result stocks i.e HINDUNILVR and LALPATHLAB, which both delivered strong down moves.
We saw the trend, We saw the stocks in front and acted on it. It simple with TREDSCANNER💸
With TredScanner, finding the right stocks becomes easier and faster

Hindustan unilever - double bottomHindustan unilever bouncing from double bottom level which confluence with Shark harmonic pattern.
Entry around 2700 SL if price closes below 2680 target 2770-2780.


hindunilvr swing /postional
buy near 2735
avg at near 2700 -2685
sl 2650 3% sl
tgt 3%6%9%12%16%
hold 4-6 weeks

Hindustan Uniliver Next PossibilitiesLooks like it's bearish following the general market trend. It may rise again from the support

HUL S/R for 20/9/24Support and Resistance Levels:
Support Levels: These are price points (green line/shade) where a downward trend may be halted due to a concentration of buying interest. Imagine them as a safety net where buyers step in, preventing further decline.
Resistance Levels: Conversely, resistance levels (red line/shade) are where upward trends might stall due to increased selling interest. They act like a ceiling where sellers come in to push prices down.
Breakouts:
Bullish Breakout: When the price moves above resistance, it often indicates strong buying interest and the potential for a continued uptrend. Traders may view this as a signal to buy or hold.
Bearish Breakout: When the price falls below support, it can signal strong selling interest and the potential for a continued downtrend. Traders might see this as a cue to sell or avoid buying.
20 EMA (Exponential Moving Average):
Above 20 EMA: If the stock price is above the 20 EMA, it suggests a potential uptrend or bullish momentum.
Below 20 EMA: If the stock price is below the 20 EMA, it indicates a potential downtrend or bearish momentum.
Trendline: A trendline is a straight line drawn on a chart to represent the general direction of a data point set.
Uptrend Line: Drawn by connecting the lows in an upward trend. Indicates that the price is moving higher over time. Acts as a support level, where prices tend to bounce upward.
Downtrend Line: Drawn by connecting the highs in a downward trend. Indicates that the price is moving lower over time. It acts as a resistance level, where prices tend to drop.
RSI: RSI readings greater than the 70 level are overbought territory, and RSI readings lower than the 30 level are considered oversold territory.
Combining RSI with Support and Resistance:
Support Level: This is a price level where a stock tends to find buying interest, preventing it from falling further. If RSI is showing an oversold condition (below 30) and the price is near or at a strong support level, it could be a good buy signal.
Resistance Level: This is a price level where a stock tends to find selling interest, preventing it from rising further. If RSI is showing an overbought condition (above 70) and the price is near or at a strong resistance level, it could be a signal to sell or short the asset.
Disclaimer:
I am not a SEBI registered. The information provided here is for learning purposes only and should not be interpreted as financial advice. Consider the broader market context and consult with a qualified financial advisor before making investment decisions.

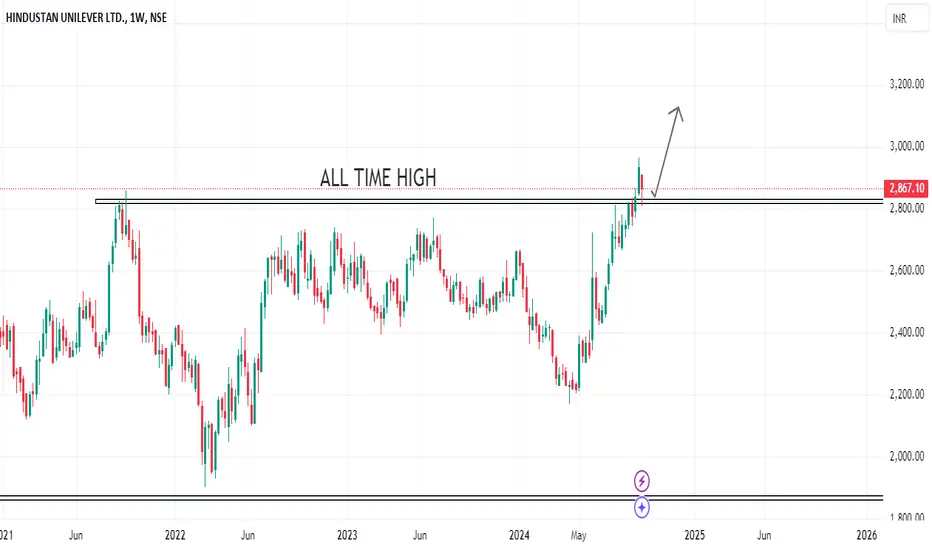
HINDUSTAN UNILEVER IS AIMING FOR A NEW ALL-TIME HIGH..! HINDUSTAN UNILEVER has reached a new all-time high and has successfully retested it. We can consider entering a buy position at this point.
Hindustan Unilever Ltd-Nice BreakoutHindustan Unilever Ltd-Nice Breakout
Capital to be deployed -20k
Investing Price-2880-2900
Breakout Price -2880
Stoploss -2733
Targets -3692
#StockMarketindia #StockToWatch #StocksInFocus #stockstowatch #StocksToTrade
#hul

HINDUNIL Near Resistance – Watch for Breakout!➡️ Strong uptrend supported by ascending trendline
➡️ Resistance from Sep 2021 at ₹2,861
➡️ Wait for a close above resistance for a bullish breakout

Trying for ATH?Slowly going past all time high. Clear break out can take the price to 3000/-.
Upcoming +ves are companies say rural spends starting to raise slowly. Festive seasons.
Near term -ves are Fed rate cuts and profit booking.
I already invested from 2400 levels. Not taking any trade. Will add if price falls to 2400-2500 again. Only until fundamentals doesn't change.
Keep an eye on Adani Wilmar , Marico. Oil sales go up during festive season. Don't have to take trade in these. Observe the moment/trend then apply it in future.


HINDUNILVR chart analysis1. Multiyear breakout
2. If close above 2800 on monthly chart then a strong breakout possible.
Please share your valuable feedback.

Hindustan Unilever--- Can it be Next ITC..?? (Investment IDEA)Hindustan Unilever
Trading below 200 DMA.
Strong Fundamental
Stock PE is 58.2 (5 Year Median PE is 65.8)
Good Dividend Stock (About 50 rupees/Year)
Long Consolidation.

HUL may riseThere may be a rise in HUL. A good base is being seen in the stock, a rise of 5 to 10 percent can be seen in the coming sessions.

Hindustan Unilever Stock is hitting a marked zone from 2023. Generally if a price zone has been hit number of times then stock will breakout at some point. If this price zone is taken out then a very good risk to reward can be achieved.
Please check other price action parameters before entering. This is a long term call only after breakout.
This is for educational purpose.

HUL is the downtrend over?HUL has formed a nice Demand Zone on the daily time frame. Patiently waiting for price to pull back to this level
