Hindustan Unilever Ltd, Can the FMCG Giant Reach for 4700?Hindustan Unilever Ltd . (HUL), a household name in India, is the undisputed leader in the Fast-Moving Consumer Goods (FMCG) sector. But with ambitious targets like 4700 being thrown around, investors need a clear picture of the company's strengths, weaknesses, opportunities, and threats (SWOT) before making informed decisions.
STRENGTH
Brand Power: HUL boasts a powerful brand portfolio with over 40 iconic names like Lux, Dove, Lipton, and Lakmé. This brand loyalty translates to strong market share across various segments.
Distribution Network: HUL's extensive reach, spanning millions of outlets across India, ensures its products are readily available to consumers.
Innovation: HUL has a proven track record of innovation, constantly adapting its product offerings to cater to evolving consumer preferences.
Financial Performance: HUL maintains healthy financials with consistent profitability and strong return on equity (ROE) and return on capital employed (ROCE)
.
WEAKNESS
Commodity Price Dependence: HUL's reliance on raw materials like palm oil and crude oil makes it susceptible to price fluctuations.
Slow Growth: Recent years have seen a slowdown in revenue and profit growth, raising concerns about the company's ability to maintain its momentum.
Premium Pricing: HUL's products occupy the premium segment, which might limit its reach in a cost-conscious market.
OPPORTUNITIES
Rural Market Expansion: India's vast rural market presents a significant growth opportunity for HUL to tap into.
E-commerce Growth: The rise of e-commerce platforms creates new avenues for HUL to reach a wider online audience.
Premiumization: HUL can leverage its brand image to further premiumize its product offerings and cater to aspirational consumers.
THREATS
Competition: The FMCG sector is fiercely competitive, with both domestic and international players vying for market share.
Economic Slowdown: An economic slowdown could impact consumer spending, affecting HUL's sales.
Regulatory Changes: Regulatory changes in areas like packaging or taxation could disrupt HUL's operations and profitability.
Can HUL Reach 4700?
Reaching a target of 4700 will depend on HUL's ability to capitalize on its strengths and opportunities while mitigating its weaknesses and threats. Here are some key factors to consider:
Growth Strategy: HUL needs a clear strategy to reignite revenue and profit growth, potentially through rural market expansion, product innovation, or strategic acquisitions.
Commodity Price Management: Effective hedging strategies can help HUL navigate volatile raw material prices.
Competition: Staying ahead of the competition requires continuous innovation, efficient marketing, and a focus on building brand loyalty.
Investor Takeaway
Hindustan Unilever Ltd. remains a dominant player in the FMCG sector. However, achieving ambitious targets like 4700 requires a multi-pronged approach. Investors should carefully consider the company's SWOT analysis and future growth strategies before making investment decisions.
Disclaimer: This analysis is for informational purposes only and should not be considered investment advice. Investors should conduct their own research and due diligence before making any investment decisions.
Trade ideas

HINDUNILVRStock name - Hindustan Unilever Limited.
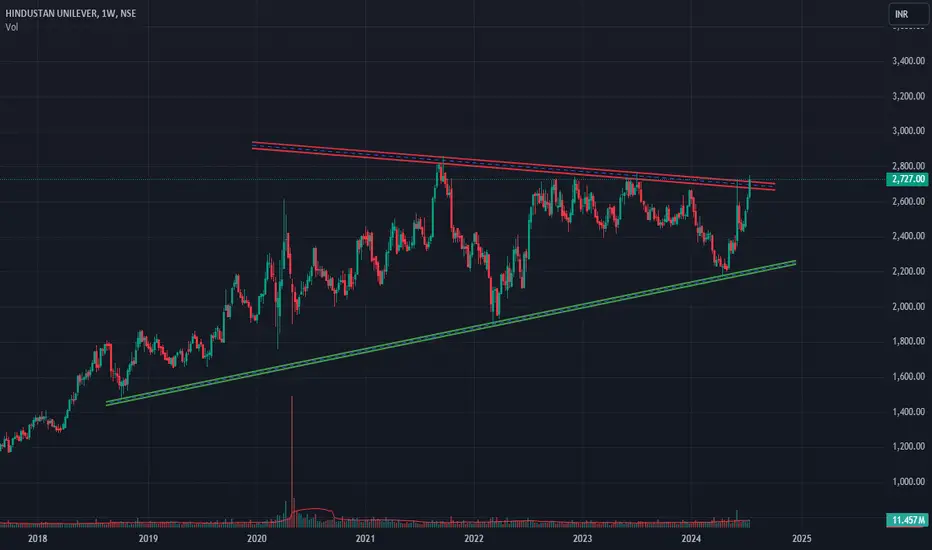
Weekly chart setup
Chart is self explanatory. Levels of breakout, possible up-moves (where stock may find resistances) and support (close below which, setup will be invalidated) are clearly defined.
Master Score - C
Disclaimer: This is for demonstration and educational purpose only. this is not buying and selling recommendations. I am not SEBI registered. please consult your financial advisor before taking any trade.
HINDUSTAN UNILEVER : Updated Price ActionHere are some pointers to keep in mind:
- One year-long consolidation.
- Clearly defined support and resistance.
- 6 Week consolidation at the resistance zone makes the resistance weak
- Recent breakout was prevented with a long upper wick. A.K.A Sellers present.
- Margin of Safety is a mere 6% ( CMP vs ATH)
- There is no clear winner yet as the signals are mixed.
- A break of the consolidation range may lead to zone-to-zone momentum
What is your take on it? Feel free to comment. If it helped, Do Leave us a boost 🚀
Disclaimer: We are not registered advisors. The views expressed here are solely personal opinions. Irrespective of the language used, Nothing mentioned here should be considered as advice or recommendation. Please consult with your financial advisors before making any investment decisions. We like everybody else, have the right to be wrong :)

HINDUNILVR - Potential upside of 6% - RSI >30 and < 40HINDUNILVR's price bounced back near 2492. The RSI has reversed its direction and is currently below 40. If the price revisits the recent peak around 2726, it could potentially result in an approximate 6% increase.

HUL S/R for 18/7/24Support and Resistance Levels: In technical analysis, support and resistance levels are significant price levels where buying or selling interest tends to be strong. They are identified based on previous price levels where the price has shown a tendency to reverse or find support.
Support levels are represented by the green line and green shade, indicating areas where buying interest may emerge to prevent further price decline.
Resistance levels are represented by the red line and red shade, indicating areas where selling pressure may arise to prevent further price increases. Traders often consider these levels as potential buying or selling opportunities.
Breakouts: Breakouts occur when the price convincingly moves above a resistance level (red shade) or below a support level (green shade). A bullish breakout above resistance suggests the potential for further price increases, while a bearish breakout below support suggests the potential for further price declines. Traders pay attention to these breakout signals as they may indicate the start of a new trend or significant price movement.
20 EMA: The yellow line denotes 20 EMA, to interpret the 20 EMA, you need to compare it with the prevailing stock price. If the stock price is below the 20 EMA, it signals a possible downtrend. But if the stock price is above the 20 EMA, it signals a possible uptrend.
Disclosure: I am not SEBI registered. The information provided here is for learning purposes only and should not be interpreted as financial advice. It is important to consult with a qualified financial advisor before making any investment decisions. Tweets neither advice nor endorsement.

Short term trade on HINDUNILVRNSE:HINDUNILVR
HINDUNILVR has created Inverted Head and Shoulders as well as a Cup and Handle pattern. For both we measure the dept of its head and cup to mark its short term target as it is on day time frame which could yield a short term gain if the neckline is broken.
Note - This is for educational purpose, in case you want to trade kindly consult your Financial Advisor

HUL S/R for 15/7/24Support and Resistance Levels: In technical analysis, support and resistance levels are significant price levels where buying or selling interest tends to be strong. They are identified based on previous price levels where the price has shown a tendency to reverse or find support.
Support levels are represented by the green line and green shade, indicating areas where buying interest may emerge to prevent further price decline.
Resistance levels are represented by the red line and red shade, indicating areas where selling pressure may arise to prevent further price increases. Traders often consider these levels as potential buying or selling opportunities.
Breakouts: Breakouts occur when the price convincingly moves above a resistance level (red shade) or below a support level (green shade). A bullish breakout above resistance suggests the potential for further price increases, while a bearish breakout below support suggests the potential for further price declines. Traders pay attention to these breakout signals as they may indicate the start of a new trend or significant price movement.
20 EMA: The yellow line denotes 20 EMA, to interpret the 20 EMA, you need to compare it with the prevailing stock price. If the stock price is below the 20 EMA, it signals a possible downtrend. But if the stock price is above the 20 EMA, it signals a possible uptrend.
Disclosure: I am not SEBI registered. The information provided here is for learning purposes only and should not be interpreted as financial advice. It is important to consult with a qualified financial advisor before making any investment decisions. Tweets neither advice nor endorsement.

HINDUSTAN UNILEVER to shoot up soonHindustan Unilever to shoot up soon after a correction of around 2.5 years.
It can reach new all time highs very soon

HINDUSTAN UNILEVER S/R Support and Resistance Levels: In technical analysis, support and resistance levels are significant price levels where buying or selling interest tends to be strong. They are identified based on previous price levels where the price has shown a tendency to reverse or find support.
Support levels are represented by the green line and green shade, indicating areas where buying interest may emerge to prevent further price decline.
Resistance levels are represented by the red line and red shade, indicating areas where selling pressure may arise to prevent further price increases. Traders often consider these levels as potential buying or selling opportunities.
Breakouts: Breakouts occur when the price convincingly moves above a resistance level (red shade) or below a support level (green shade). A bullish breakout above resistance suggests the potential for further price increases, while a bearish breakout below support suggests the potential for further price declines. Traders pay attention to these breakout signals as they may indicate the start of a new trend or significant price movement.
20 EMA: The yellow line denotes 20 EMA, to interpret the 20 EMA, you need to compare it with the prevailing stock price. If the stock price is below the 20 EMA, it signals a possible downtrend. But if the stock price is above the 20 EMA, it signals a possible uptrend.
Disclosure: I am not SEBI registered. The information provided here is for learning purposes only and should not be interpreted as financial advice. It is important to consult with a qualified financial advisor before making any investment decisions. Tweets neither advice nor endorsement.

HINDUSTAN UNILEVER S/R for 2/7/24Support and Resistance Levels: In technical analysis, support and resistance levels are significant price levels where buying or selling interest tends to be strong. They are identified based on previous price levels where the price has shown a tendency to reverse or find support.
Support levels are represented by the green line and green shade, indicating areas where buying interest may emerge to prevent further price decline.
Resistance levels are represented by the red line and red shade, indicating areas where selling pressure may arise to prevent further price increases. Traders often consider these levels as potential buying or selling opportunities.
Breakouts: Breakouts occur when the price convincingly moves above a resistance level (red shade) or below a support level (green shade). A bullish breakout above resistance suggests the potential for further price increases, while a bearish breakout below support suggests the potential for further price declines. Traders pay attention to these breakout signals as they may indicate the start of a new trend or significant price movement.
20 EMA: The yellow line denotes 20 EMA, to interpret the 20 EMA, you need to compare it with the prevailing stock price. If the stock price is below the 20 EMA, it signals a possible downtrend. But if the stock price is above the 20 EMA, it signals a possible uptrend.
Disclosure: I am not SEBI registered. The information provided here is for learning purposes only and should not be interpreted as financial advice. It is important to consult with a qualified financial advisor before making any investment decisions. Tweets neither advice nor endorsement.

Hinduni bullish for 27/06/2024Hi fellow traders,
Check out this Hindustan Unilever chart. It has taken its sweet time to retrace making a slingshot pattern (Don't know official name). I am bullish on this chart for intraday as well as for a week where my entry point will be 2450 and SL will be 2420. So, for intraday my profit is 2500. And for weekly trading it is 2700.
Let me know what you feel. You too will be updated about my thoughts throughout tomorrow's trading session.
Disclaimer : This is my analysis and I does not responsibility of any profit or loss executing this suggestion. Even though I will be taking the same trade tomorrow, do your own analysis.
Stay tuned for such daily chart analysis.

HUL looking bullishHindustan Unilever has completed the long-term Cup & Handle formation. It is expected to rise min. INR 350 from here.

HUL | Hindustan Unilever - Monthly Bullish PennantHUL | Hindustan Unilever - Monthly Bullish Pennant
Hul formaing a bullish pennant pattern on Monthly Chart
2445/2232 imp Support levels
Target above 2732 - tp 2.5 ( 3100/- ) and tp5(3633)

HINDUSTAN UNILEVERHINDUSTAN UNILEVER has significantly surpassed the 2425 resistance level. Now, it's essential to await the pullback before entering the trade.

sell at zone ~ intradayexpecting small fall from the zone . look for confirmation inside zone in smaller tf.
- good for intraday trade
- entry inside zone
- sl is day close above zone
- for target draw fib retracement from C to latest swing high , use 0.236 fib as tgt 1 (safe place for intraday), 0.382 as tgt 2 (risk takers).
- don't trade , if u didn't get selling confirmation inside zone
- if day close is above this zone , this pattern becomes invalid.

HINDUSTAN UNILEVER BRAKEOUT ON DAILY CHARTNSE:HINDUNILVR
Hindustan Unilever gives brake out on daily chart.
Buy 2386
SL 2323
Target 2550+

HUL S/R Support and Resistance Levels: In technical analysis, support and resistance levels are significant price levels where buying or selling interest tends to be strong. They are identified based on previous price levels where the price has shown a tendency to reverse or find support.
Support levels are represented by the green line and green shade, indicating areas where buying interest may emerge to prevent further price decline.
Resistance levels are represented by the red line and red shade, indicating areas where selling pressure may arise to prevent further price increases. Traders often consider these levels as potential buying or selling opportunities.
Breakouts: Breakouts occur when the price convincingly moves above a resistance level (red shade) or below a support level (green shade). A bullish breakout above resistance suggests the potential for further price increases, while a bearish breakout below support suggests the potential for further price declines. Traders pay attention to these breakout signals as they may indicate the start of a new trend or significant price movement.
Disclosure: I am not SEBI registered. The information provided here is for learning purposes only and should not be interpreted as financial advice. It is important to consult with a qualified financial advisor before making any investment decisions. Tweets neither advice nor endorsement.

Demand zone confluence with Fibbo 61.8Demand zone confluence with Fibbo 61.8
Go long at 2250
Favorable risk to reward ratio

Hindunilvr LongHindunilvr is on weekly support, this may be a reversal point for first target around 2430.
Note:- Not a trade recommendation.

HINDUSTAN UNILIVERtook support at monthly candle trend line.
broke its downward slop
stock already rallied 5%.

HUL: Long position mid term (35% returns)HUL has give a strong breakout today (with heavy volume) against its trendline (blue). The price has been in a downtrend since July 2023 forming a rounding bottom pattern with neckline at 2700 and bottom at 2200. The target based on the pattern is 3200 (Upside of 35%) .
Fundamentally, the company is strong and has grown consistently. The P/E valuation and EV/EBITDA are at multiyear low. The stock has been under time correction mode for the last 3 years. The inflation is expected to come down in the coming quarters which will help revive the sales and boost the earnings going forward. The rural demand has picked up as well. All the drivers should set the stock rallying to new ATHs.
Targets:
1) 2450-2500 (range)
2) 2650-2700 (range)
3) 3200
Risks: Given the Nifty has been under selling pressure, there's a risk of this breakout to not push all the way to the targets creating another round of sideways price action.

MACD Crossover Swing Trade📊 Script: HINDUNILVR
📊 Sector: FMCG
📊 Industry: Personal Care - Multinational
⏱️ C.M.P 📑💰- 2231
🟢 Target 🎯🏆 - 2362
⚠️ Stoploss ☠️🚫 - 2172
📊 Script: KPIL
📊 Sector: Capital Goods - Electrical Equipment
📊 Industry: Transmission Line Towers / Equipment
⏱️ C.M.P 📑💰- 1206
🟢 Target 🎯🏆 - 1272
⚠️ Stoploss ☠️🚫 - 1176
📊 Script: CHENNPETRO
📊 Sector: Refineries
📊 Industry: Refineries
⏱️ C.M.P 📑💰- 942
🟢 Target 🎯🏆 - 999
⚠️ Stoploss ☠️🚫 - 912
📊 Script: POWERGRID
📊 Sector: Power Generation & Distribution
📊 Industry: Power Generation And Supply
⏱️ C.M.P 📑💰- 281
🟢 Target 🎯🏆 - 298
⚠️ Stoploss ☠️🚫 - 272
📊 Script: NATCOPHARM
📊 Sector: Pharmaceuticals
📊 Industry: Pharmaceuticals - Indian - Bulk Drugs
⏱️ C.M.P 📑💰- 999
🟢 Target 🎯🏆 - 1069
⚠️ Stoploss ☠️🚫 - 965
⚠️ Important: Always maintain your Risk & Reward Ratio.
✅Like and follow to never miss a new idea!✅
Disclaimer: I am not SEBI Registered Advisor. My posts are purely for training and educational purposes.
Eat🍜 Sleep😴 TradingView📈 Repeat 🔁
Happy learning with trading. Cheers!🥂

