SWING IDEA - INDRAPRASTHA GAS (IGL)Consider a compelling swing trade opportunity in Indraprastha Gas Limited (IGL) , a leading natural gas distribution company in India.
Reasons are listed below :
Attempt to Break Triangle Pattern : IGL is attempting to break out of a triangle pattern, indicating a potential shift in market sentiment and the beginning of a new trend.
Bullish Marubozu on Daily Timeframe : The presence of a bullish Marubozu candlestick pattern on the daily timeframe signals strong buying momentum and potential upward movement.
Broke Consolidation of 5 Months : IGL has broken out of a consolidation phase lasting 5 months, suggesting a breakout from range-bound trading and potential sustained upward movement.
50 and 200 EMA Support on Weekly Timeframe : The stock finds support at both the 50 and 200 Exponential Moving Averages (EMA) on the weekly timeframe, indicating bullish momentum and potential for trend continuation.
Constant Higher Highs : IGL consistently forms higher highs, reflecting a trend of increasing bullish momentum and reinforcing the potential for further gains.
Target - 515 // 585
Stoploss - weekly close below 394
DISCLAIMER -
Decisions to buy, sell, hold or trade in securities, commodities and other investments involve risk and are best made based on the advice of qualified financial professionals. Any trading in securities or other investments involves a risk of substantial losses. The practice of "Day Trading" involves particularly high risks and can cause you to lose substantial sums of money. Before undertaking any trading program, you should consult a qualified financial professional. Please consider carefully whether such trading is suitable for you in light of your financial condition and ability to bear financial risks. Under no circumstances shall we be liable for any loss or damage you or anyone else incurs as a result of any trading or investment activity that you or anyone else engages in based on any information or material you receive through TradingView or our services.
@visionary.growth.insights
IGL trade ideas

Trade in IGLTarget mentioned on chart
Disclaimer:- Please always consult with your financial advisor or do your analysis before taking trade

INDRAPRASTHA GAS (Positional Trade)POSITIONAL TRADE
INDRAPRASTHA GAS
Looks Good ABOVE 510.70
SL 401.90
Targets 544.30 - 1152.40
Hold few weeks to months
Please consult your financial advisor before investing
All research is for educational purposes only.

IGL ready for a long journyWeekly candle above imoortant resistace, We can buy here, SL will be current month low, Target 1st 580 to 600 , if 600 breakout on monthly candle then we can see big targets.

IGL ready for a long journyWeekly candle above imoortant resistace, We can buy here, SL will be current month low, Target 1st 580 to 600 , if 600 breakout on monthly candle then we can see big targets.

IGL breaking outIGL breaking out of 3 year long trend-line/pennant, 2 year long cup&handle with some good volume.
TP 595/800

MACD Crossover Swing Trade - IGL📊 Script: IGL
📊 Sector: Gas Distribution
📊 Industry: Miscellaneous
⏱️ C.M.P 📑💰- 504
🟢 Target 🎯🏆- 535
⚠️ Stoploss ☠️🚫 - 489
⚠️ Important: Always maintain your Risk & Reward Ratio.
✅Like and follow to never miss a new idea!✅
Disclaimer: I am not SEBI Registered Advisor. My posts are purely for training and educational purposes.
Eat🍜 Sleep😴 TradingView📈 Repeat 🔁
Happy learning with trading. Cheers!🥂


IGL FOR SWING It is a multi-time frame breakout. A good momentum can be expected above 490 with nearest swing as SL in 1day time frame T1 is ALL TIME HIGH T2 is 30% from the breakout. One can hold it till it shows a bearish sign in 1D TF

IGL 1MONTHIT IS READY TO BREEAK OUT
WAIT FOR THE RETEST
I Am Not SEBI Registered Analyst. All Post and Levels Posting is only for educational and knowledge purpose. I Am not responsible for your any kind of loss or profit.
No Claim, All Rights Reserved.‼️

My view on IGLInverse head & shoulder and trendline breakout possible in IGL
Looking tgt 476-478-480++
in very short term👆
Keeping on radar IGL 475 CE

igl 1mtf buy @ 472 target @ 556, 586, 596 symentric triangle igl 1mtf
buy @ 472 target @ 556, 586, 596
symentric triangle breakout
risk reward 1.5
its just a view trade @ your own risk
sl@ 386.75

Crossover - IGL📊 Script: IGL
📊 Sector: Gas Distribution
📊 Industry: Miscellaneous
Key highlights: 💡⚡
📈 Script is trading at upper band of BB.
📈 MACD is giving crossover .
📈 Double Moving Averages giving Crossover.
📈 Right now RSI is around 63.
📈 One can go for Swing Trade.
⏱️ C.M.P 📑💰- 472
🟢 Target 🎯🏆 - 508
⚠️ Stoploss ☠️🚫 - 458
⚠️ Important: Always maintain your Risk & Reward Ratio.
✅Like and follow to never miss a new idea!✅
Disclaimer: I am not SEBI Registered Advisor. My posts are purely for training and educational purposes.
Eat🍜 Sleep😴 TradingView📈 Repeat 🔁
Happy learning with trading. Cheers!🥂


Review and plan for 8th May 2024Nifty future and banknifty future analysis and intraday plan in kannada.
This video is for information/education purpose only. you are 100% responsible for any actions you take by reading/viewing this post.
please consult your financial advisor before taking any action.
----Vinaykumar hiremath, CMT

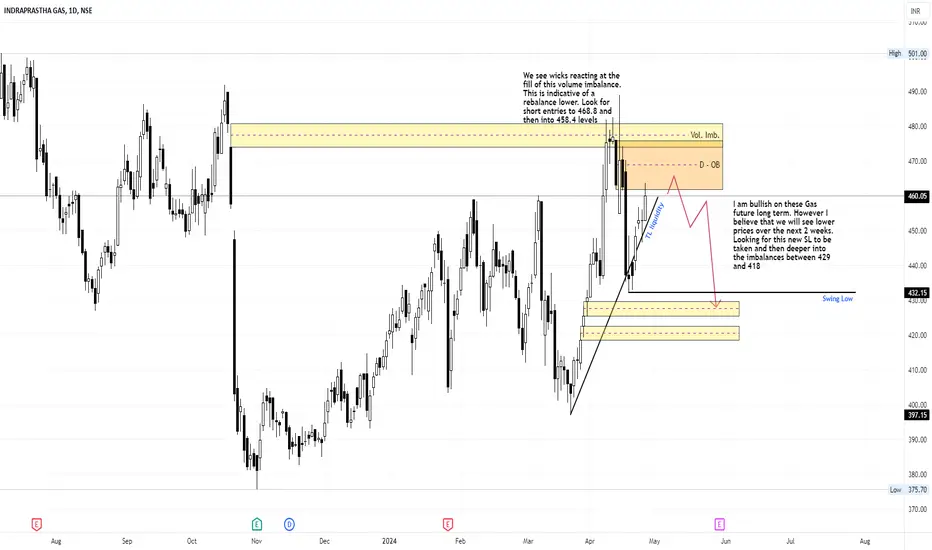
Short OpportunityI am bullish on these Gas future long term. However I believe that we will see lower prices over the next 2 weeks. Looking for this new SL to be taken and then deeper into the imbalances between 429 and 418
breakoutthere is trendline breakout in IGL LTD. Stock pe is 19.3 and roe and roce are above 20% both. oil and gas sector is trending. should be a good buy

IGL...This buy is no gas.Beautiful...trinagle breakout....tgt calculated and mentioned on the chart...on good volumes too...investors too can buy this

INDRAPRASTH GAS AT SUPPORT LEVEL FORMING HAMMER CANDLEIndraprasth gas is on support level and form strong hammer candle yesterday on 1 day time-frame.
It is looking good for short- term bullish momentum.
If high of hammer is break and today candle give strong closing above the high we look it for bullish swing . And target upto 455

IGL will become multibagger after BreakoutIGL may give Huge Breakout !!
IGL is Making Hut pattern after an uptrend
Possibility of Breakout is huge because its a continuation pattern
We may see huge upside after breaking the resistance
If stock comes down we can see support is around 370-390 level
Breakout confirmation is above 480-500
Current price is around 450
Targets are around 900-950 level
Thanks !!
Disclaimer : We are not SEBI registered analyst. Do your own research before taking any investment decision.

EXPENDED FLAT : ELLIOTT WAVE CORRECTIONEXPANDED FLAT CORRECTION
2- EXPANDING FLAT :
• A corrective 3 waves move labelled as ABC
• Subdivision of wave A and B is in 3 waves
• Subdivision of wave C is in 5 waves impulse / diagonal
• Subdivision of wave A and B can be in any corrective 3 waves structure including zigzag, flat, double three, triple three
• Wave B of the 3-3-5 pattern terminates beyond the starting level of wave A
• Wave C ends substantially beyond the ending level of wave A
Fibonacci Ratio Relationship
• Wave B = 123.6% of wave A
• Wave C = 123.6% – 161.8% of wave AB

