Understanding Elliott Wave Analysis: A Daily Outlook ExampleHello Friends, Welcome to RK_Chaarts!
Today we're going to explore Elliott Wave Analysis using a daily outlook example of Lloyds Enterprises Ltd Chart. Please note that this is for educational purposes only.
Important Disclaimer:
- This analysis is not trading advice.
- I am not a SEBI-registered analyst.
- Please consult your financial advisor before trading or investing.
Understanding Elliott Wave Analysis
In this educational guide, we'll walk through a daily outlook analysis using Elliott Wave theory. Our goal is to identify potential price movements and understand the underlying wave structure.
Current Market Analysis
We are currently analyzing a daily chart, and our analysis suggests:
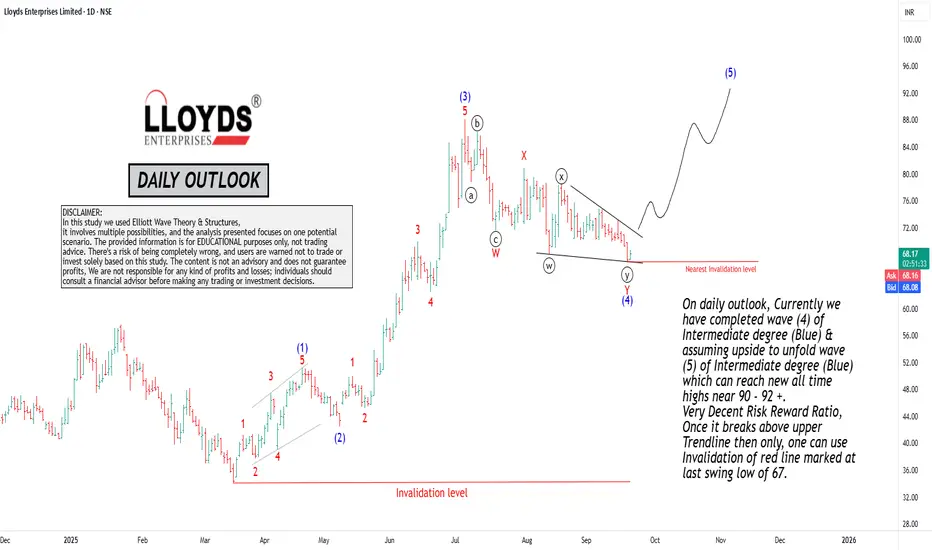
- We have completed wave (4) of Intermediate degree (blue).
- We assume an upside movement will unfold, forming wave (5) of Intermediate degree (blue).
- This wave (5) has the potential to reach new all-time highs near 90-92+.
Risk-Reward Ratio
Our analysis indicates a very decent risk-reward ratio. This means that the potential upside movement is substantial compared to the potential downside risk.
Trade Setup
To validate our trade setup, we are watching for a break above the upper trendline. Once this break occurs, we can consider using the invalidation level marked at the last swing low of 67.
Key Takeaways:
1. Elliott Wave Structure: Understand the current wave structure, including the completed wave (4) and the anticipated wave (5).
2. Potential Price Movement: Recognize the potential for wave (5) to reach new all-time highs.
3. Risk-Reward Ratio: Acknowledge the decent risk-reward ratio, which supports the trade setup.
4. Trade Validation: Wait for a break above the upper trendline to validate the trade setup.
By applying Elliott Wave analysis and understanding the underlying wave structure, traders can make more informed decisions and identify potential trading opportunities.
Remember:
Most investors treat trading as a hobby because they have a full-time job doing something else. However, if you treat trading like a business, it will pay you like a business. If you treat it like a hobby, hobbies don't pay, they cost you!
Hope this post is helpful to the community!
Thanks,
RK
Disclaimer and Risk Warning:
The analysis and discussion provided on in.tradingview.com are intended for educational purposes only and should not be relied upon for trading decisions. RK_Chaarts is not an investment adviser, and the information provided here should not be taken as professional investment advice. Before buying or selling any investments, securities, or precious metals, it is recommended that you conduct your own due diligence. RK_Chaarts does not share in your profits and will not take responsibility for any losses you may incur. So please consult your financial advisor before trading or investing.
LLOYDPP.E1 trade ideas
Lloyds EnterpisesThe stock is currently following a strong uptrend, forming higher highs and higher lows since April. After a recent correction (Wave 4), it’s showing signs of starting a new upward move, supported by a breakout and a spike in trading volume.
The chart structure suggests the stock is in the final leg of a 5-wave impulse pattern, with the next resistance targets at around ₹96 and an extended zone near ₹107–108, based on typical Fibonacci projections for Wave 5.
Rising volume as price bounces from recent lows indicates renewed buying interest and suggests the move could have momentum behind it.
Currently, the main support to watch is near ₹77.5–78 (recent Wave 4 low). As long as the price stays above this zone, the bullish trend remains intact.
Immediate upside resistance is around ₹96, with ₹107–108 as the higher target if bullish momentum continues.
If there’s a pullback toward support zones and the price stabilizes, it could offer new buying opportunities. A sustained drop below ₹77.5 would make me reconsider the bullish view.
Summary:
Lloyds Enterprises Ltd appears poised for another upward leg, aiming for ₹96 and potentially higher if the uptrend continues. Volume and technical momentum support this outlook, but I will monitor the ₹77–78 support area closely as a key pivot for managing risk.

LLOYDSENTMomentum stocks pulling back to 50 DMA are my favourite stocks.
These give you excellent entry opportunities when other's are getting shaken out of their positions

Lloyds Enterprises Ltd - Price ActionLLOYDSENT shows strong potential for a bullish trend. The stock has recently broken out above the key resistance level at 51.64 and bounced back from that horizontal line, which is a bullish signal. Additionally, the price is trading above the ascending trendline, indicating sustained upward momentum. The volume spike further confirms the strength of this move. Keep an eye on this stock for potential further gains. #LloydsEnterprises #BullishTrend #PriceActionTrading

Amazing breakout on WEEKLY Timeframe - LLOYDSENTCheckout an amazing breakout happened in the stock in Weekly timeframe, macroscopically seen in Daily timeframe. Having a great favor that the stock might be bullish expecting a staggering returns of minimum 25% TGT. IMPORTANT BREAKOUT LEVELS ARE ALWAYS RESPECTED!
NOTE for learners: Place the breakout levels as per the chart shared and track it yourself to get amazed!!
#No complicated chart patterns
#No big big indicators
#No Excel sheet or number magics
TRADE IDEA: WAIT FOR THE STOCK TO BREAKOUT IN WEEKLY TIMEFRAME ABOVE THIS LEVEL.
Checkout an amazing breakout happened in the stock in Weekly timeframe.
Breakouts happening in longer timeframe is way more powerful than the breakouts seen in Daily timeframe. You can blindly invest once the weekly candle closes above the breakout line and stay invested forever. Also these stocks breakouts are lifelong predictions, it means technically these breakouts happen giving more returns in the longer runs. Hence, even when the scrip makes a loss of 10% / 20% / 30% / 50%, the stock will regain and turn around. Once they again enter the same breakout level, they will flyyyyyyyyyyyy like a ROCKET if held in the portfolio in the longer run.
Time makes money, GREEDY & EGO will not make money.
Also, magically these breakouts tend to prove that the companies turn around and fundamentally becoming strong. Also the magic happens when more diversification is done in various sectors under various scripts with equal money invested in each N500 scripts.
The real deal is when to purchase and where to purchase the stock. That is where Breakout study comes into play.
LET'S PUMP IN SOME MONEY AND REVOLUTIONIZE THE NATION'S ECONOMY!
