MARUTI cup and handle pattern breakoutMARUTI cup and handle pattern breakout with volume
Expecting a bullish movement.
MARUTI trade ideas


MarutiDouble Bottom Pattern
Breakout and ready for upside move
Long term view- 7800
Monthly/Quarterly 7200


Maruti Support levelsMaruti Support levels seen at 6400, 5500, 4000, Levels shared for study purpose along with Fibonacchi retracement

Maruti Chart Update Looks BullishMaruti Chart Update Looks Bullish
We can enter for Long side with small SL and target of 7200

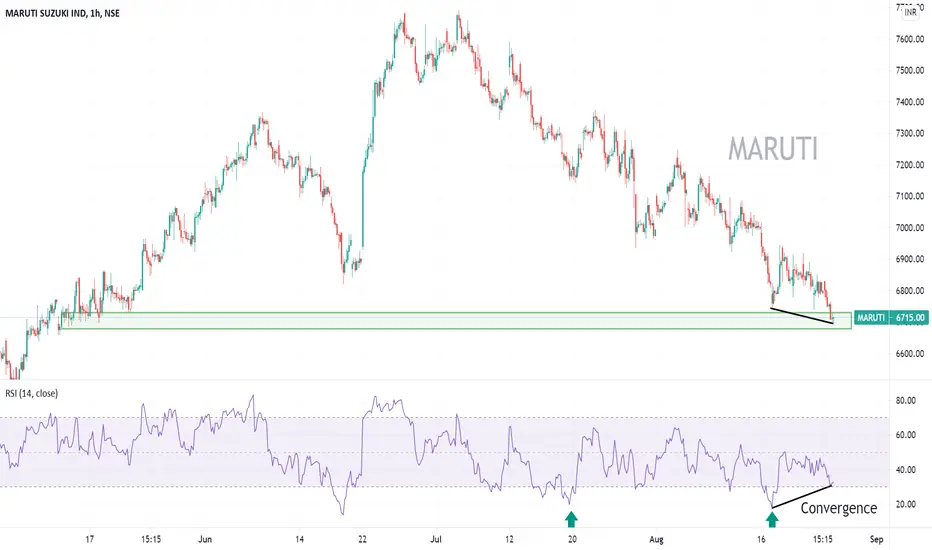
MARUTI - Possible reversal Should probably reverse from here
1. Convergence with RSI
2. Pin bar formation at DD zone.l
3. Watch the RSI movement from the same position Historically.
MARUTI SYMMETRICAL PATTERNHello
Welcome to this analysis about MARUTI , we are looking at daily timeframe perspectives. MARUTI in recent times heavily decreased with bearishness however it now moved into an oversold condition. MARUTI is developing here that will be a decisive factor in the upcoming times. I discovered the main formation MARUTI is developing here that will be a decisive factor in the upcoming times. As when looking at my chart now we can watch there how MARUTI has emerged with this key MARUTI SYMMETRICAL PATTERN marked in my chart with the black boundaries. MARUTI is near support region which is an important support and also psychological support-mark together with the lower-boundary of the MARUTI SYMMETRICAL PATTERN a pullback
In this manner, thank you for watching my update-analysis about MARUTI and its major MARUTI SYMMETRICAL PATTERN with the determining factors we need to consider in upcoming times, support the analysis with a like and follow or comment for more market insight!


Maruti daily....Maruti daily respect the red supply zone and fall...
Now close to demand zone... this should hold for atlist good rrr long..🤞🤞
Only Below that...yellow zone 🤞🤞


MARUTI SUZUKI INDIA LTD 4HRCONFLUENCE Of DAILY Bullish 5O & Bullish BAT STRONG POTENTIAL REVERSAL ZONE
Earlier Pattern given good reaction on Type1 entry & hit Both Targets
PRICE WAS REJECTED From THIS LEVELS
POTENTIAL Buy

MARUTI SUZUKI INDIA LTD Daily CONFLUENCE Of Bullish 5O & Bullish BAT STRONG POTENTIAL REVERSAL ZONE
Earlier Pattern given good reaction on Type1 entry & hit Both Targets
now price again came into PRZ Zone of Pattern it becomes a TYPE2 Entry which is REVERSAL
With TRENDLINE BREAK
POTENTIAL Buy

Maruti on daily time frame- SellMaruti has given a clear breakdown from 7 months symmetrical triangle pattern. Please see below data sets:
1. Breakdown is confirmed after pullback and large red candle.
2. RSI and MACD are falling continously, which is a good indication.
3. Price could not sustain above 20, 50, 100, 200 EMA.
4. ADX has started rising.
5. Price has also broken Fib retracement important level which is 0.618%.
Note- This is for educational purposes, please consult your financial advisor before trading.

MARUTI SUZUKI INDIA LTD 1HRBullish BAT Strong POTENTIAL REVERSAL ZONE AS
Earlier Pattern given good reaction on Type1 entry & HIT Target1
now price again came into PRZ Zone of Pattern it becomes a TYPE2 Entry which is REVERSAL
POTENTIAL Buy

Maruti looks good for long on the support zoneMaruti buying on support zone + harmonic PRZ.
SL and targets marked. If market supports the targets can achieved easily.
Disclaimer : study purpose.

Price ActionTrend lines can be used to trade, if it closes beyond those trend lines trade can be taken respectively


Maruti Triangle PatternCan take now for better RR
Conservative traders can take after BO on DCB
Target is purely based on PA

MARUTI SUZUKI INDIA LTD 15MIN
BULLISH CRAB for SCALPING
price need to follow Green Trend line & hit target
If price Breaks Red Trend line is where EXIT before SL hits
POTENTIAL BUY

MARUTI SUZUKI INDIA LTD 4HRConfluence of Daily & 4HR BULLISH Bat LEVEL STRONG POTENTIAL REVERSAL ZONE
VERTICAL DOTTED LINE is Ultra high volume down bar
Higher volume-Professionals are buying into the public selling..second vertical dotted line candle closing at high shows prices rejection to lower levels & after that can Narrow spreads candles shows bullish
Price on breaking of ULTRA HIGH VOLUME Candle HIGH with NO SUPPLY i.e place for BUY

MARUTI SUZUKI INDIA LTD 1HRCONFLUENCE OF DAILY , 4HR & 1HR Bullish ZONES
WITH Break of Trend line
BUY

MARUTI SUZUKI INDIA LTD 15MIN Bullish Deep Crab for scalping
Vertical dotted line is Bottom Reversal -it’s a two bar Sign Of Strength.
First bar is widespread down bar closing on or off the low with high volume or low volume
Second bar is widespread up bar closing on oroff the high on higher or lower volume than the first bar
AS second bar close & high are higher than the first bar high and volume on second bar is higher than the first bar volume, it shows effort to rise is successful It shows immediate strength --Effort vs Result & can be traded immediately on first
No Supply or Test.
Buy
