MARUTI trade ideas

Marutimaruti decent levels for long accumulations ( trade valid only if maruti trades above 7035 on closing basis ) sl -6900 tgt -7700
"NSE:MARUTI" - "SELL" signal 1 hr timeframe (Solved Signal 1)-SELL signal generated by "Solved Signal 1(SS1)" in 1 hr Chart of "NSE:MARUTI"
-"NSE:MARUTI" 1 hr chart
- Indicator used "Solved Signal 1(SS1)"
-Solved Signal 1 generates SELL signal(by default: text:- SS1, color= red,shape=triangledown)
on 1 hr chart of "NSE:MARUTI" .It means "NSE:MARUTI" can go down.
-Solved Signal 1 uses "NSE:MARUTI" Price data for Solving the Market(See description of Indicator).
-Like and Comment. NSE:NIFTY BSE:SENSEX

Buy in staggered way (Cash segment only)Hello traders, i think its a time to buy MARUTI in staggered way, there are only 2 levels in lower side (6900 & 6750) to support (strong). let see how the market respect these levels ! have a good luck !


MarutiKey levels are mentioned on chart, those are working as support as well as Resistance
Disclaimer
I am not a sebi registered analyst
My studies are Educational purpose only
Consult with your Financial advisor before trading or investing


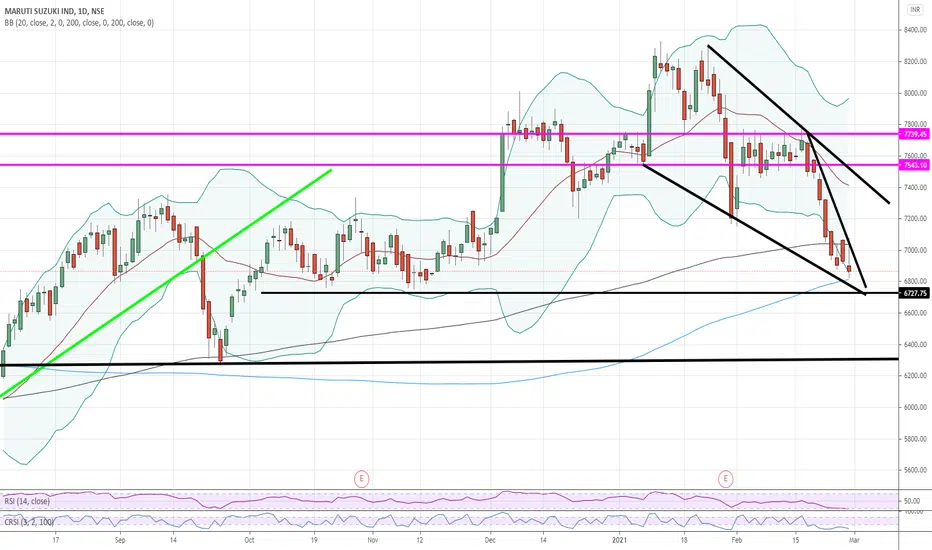
MARUTI is making a parallel channel patten MARUTI is making a parallel channel patten ,wait for break and re-test

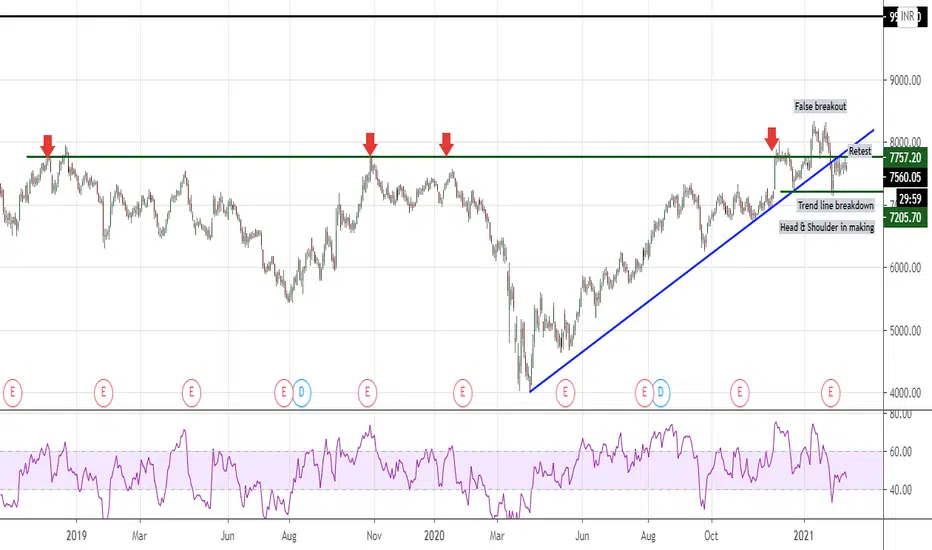
Maruti - Breakout failureBreakout failure, breakdown of rising trend line, retest, head and shoulder in the making.

Maruti zusuki can give good move from current level Maruti zusuki can give good move from current level, about to cross 200 EMA on 30min time frame triangle breakout done

MARUTI SUZUKI - Trendline ObservationsTrendline Observation(s). A simple trendline breakout on 30M Chart of MARUTI SUZUKI. BUY above 7771. I'm learning chart patterns as of now. You can plan your trades accordingly if you know how to trade these patterns.


LONG OPPORTUNITY IN MARUTI SUZUKIStrictly for educational purposes
I will buy only after a green sight at the entry area or stop raid for the best results!
Good Luck 🤞

Maruti - Intraday Trade SetupMaruti CMP - 7981.50
Looking bearish in higher time frame. One can go for Intraday Trade setup with the following entry, exit & targets
Sell at or Below 7965 ONLY / Stop Loss 7988
Target 1 - 7955
Target 2 - 7948
Target 3 - 7930
Disclaimer: This is my view and for educational purpose only.

My First Chart. Please don't trade with this.Watchlist for Monday if Overall/Auto market is positive.


MARUTI - any chance to buy? 15m, 45m & 2 hours analysis.
All The Levels And Patterns Are Marked On Charts, Red Zone Denotes Supply Zone And Green Is For Demand Zone. .
In case the price breaks the lower trend line in 15 mins time frame, it can take support from 8087, if that gets broken 8035 will be the next support level.
Buy near 8035 for bullish targets.
The Indicator Used:
1) Daily Lines Plots Daily 20 (BLACK) & 50 EMA (GREY), BLUE (200 DAILY EMA ) On Lower Time Frame Charts. - Not Used Here.
2) TE-REKAB - Proprietary Indicator
KEYS:
PB : Pullback
Blue Candle: Selling Divergence
Yellow Candle: Buying Divergence
If you like the analysis, do leave a like and follow for more such content coming up.
The analysis is my POV, hope you got bucks in your pocket to consult a financial advisor before investing :P :)
HAPPY TRADING!!!
