NMDCNMDC – Daily TF
Downward wedge breakout possible. If happens then favorable RR for an upside movement from 222 onwards. SL of 200 will be good for looking towards 270 levels.
RSI divergence did take place and confirmed also.
Substantial volumes are the only thing missing.
Disclaimer –
I am not a SEBI REGISTERED person or analyst.
I am not responsible for anyone’s gains or losses.
I am doing this only to increase my knowledge and to learn.
NMDC trade ideas

NMDCNMDC – Daily TF
Downward wedge breakout possible. If happens then favorable RR for an upside movement from 222 onwards. SL of 200 will be good for looking towards 270 levels.
RSI divergence did take place and confirmed also.
Substantial volumes are the only thing missing.
Disclaimer –
I am not a SEBI REGISTERED person or analyst.
I am not responsible for anyone’s gains or losses.
I am doing this only to increase my knowledge and to learn.

NMDC....Time to Go Long for 30% ReturnNMDC Ltd is being recommended as a "buy" by several analysts, with expectations of a potential 20-30% upside in its stock price over the next 12 months. The company is focusing on increasing its production to 50 million tonnes by FY25, which is expected to drive revenue growth. Additionally, NMDC is expanding its presence in new minerals like lithium, positioning it for future growth opportunities.
However, risks such as changes in global iron ore prices and regulatory shifts could affect profitability. Overall, the stock is seen as having solid upside potential due to its production expansion and favorable market conditions.

NMDC 03-09-2024Happy learning with trading. I just shared my view. If correct give me one like. If not correct me.
Points to Note:
1) parallel channel and supports are good to take at entry point for long term.
2) if we seen good volume at 195-200 level we can add more for long term with SL of 185.
Disclaimer:
I am not a Registered Analyst with SEBI and it is only for educational purposes. Please consult your financial advisor before making any decision. I will not be responsible for any of your profits or losses.

NMDC Downside Target 220, 210, 200NMDC may see a decline in the upcoming few sessions, the stock is currently in a downtrend and has been rejected by a strong resistance on the daily chart where an inverted hammer candle has formed indicating weakness in the stock. 220 is a strong support in the stock, if the stock breaks this support, then the stock can also see 210 to 200 levels.

NMDC SHORT Trade Setup and levelsNMDC SHORT Trade Setup and levels
Got a clear short entry on 28 August
Entry: 226
Stoploss: 230
Target 1: 222 (DONE)
Target 2: 215 (DONE)
Target 3: 208
Target 4: 204
Current Trailing Stop loss: 224
Hope this helps.
Support my work by following my profile for more such actionable charts.

NMDC LTD S/RSupport and Resistance Levels:
Support Levels: These are price points (green line/share) where a downward trend may be halted due to a concentration of buying interest. Imagine them as a safety net where buyers step in, preventing further decline.
Resistance Levels: Conversely, resistance levels (red line/shade) are where upward trends might stall due to increased selling interest. They act like a ceiling where sellers come in to push prices down.
Breakouts:
Bullish Breakout: When the price moves above resistance, it often indicates strong buying interest and the potential for a continued uptrend. Traders may view this as a signal to buy or hold.
Bearish Breakout: When the price falls below support, it can signal strong selling interest and the potential for a continued downtrend. Traders might see this as a cue to sell or avoid buying.
20 EMA (Exponential Moving Average):
Above 20 EMA: If the stock price is above the 20 EMA, it suggests a potential uptrend or bullish momentum.
Below 20 EMA: If the stock price is below the 20 EMA, it indicates a potential downtrend or bearish momentum.
Trendline: A trendline is a straight line drawn on a chart to represent the general direction of a data point set.
Uptrend Line: Drawn by connecting the lows in an upward trend. Indicates that the price is moving higher over time. Acts as a support level, where prices tend to bounce upward.
Downtrend Line: Drawn by connecting the highs in a downward trend. Indicates that the price is moving lower over time. It acts as a resistance level, where prices tend to drop.
RSI: RSI readings greater than the 70 level are overbought territory, and RSI readings lower than the 30 level are considered oversold territory.
Combining RSI with Support and Resistance:
Support Level: This is a price level where a stock tends to find buying interest, preventing it from falling further. If RSI is showing an oversold condition (below 30) and the price is near or at a strong support level, it could be a good buy signal.
Resistance Level: This is a price level where a stock tends to find selling interest, preventing it from rising further. If RSI is showing an overbought condition (above 70) and the price is near or at a strong resistance level, it could be a signal to sell or short the asset.
Disclaimer:
I am not a SEBI registered. The information provided here is for learning purposes only and should not be interpreted as financial advice. Consider the broader market context and consult with a qualified financial advisor before making investment decisions.

Nmdc Long This Stock complete down side flat correction internal complete but Wave C 2 or 4 Trend line not break . but i predict this stock move upside

one two three fourOne, two, three, four
four oscillation intervals, layered oscillation intervals
1, 2, 3, 4, 4 oscillation intervals, stratified oscillation intervals, what is the latest oscillation interval situation

NMDC
Targets in chart - SL 110
Market Cap
₹ 38,244 Cr.
Current Price
₹ 130
High / Low
₹ 132 / 92.2
Stock P/E
7.72
Book Value
₹ 77.2
Dividend Yield
5.06 %
ROCE
30.2 %
ROE
23.0 %
Face Value
₹ 1.00
Promoter holding
60.8 %
EPS last year
₹ 19.1
EPS latest quarter
₹ 5.64
Debt
₹ 423 Cr.
Pledged percentage
0.00 %
Net CF
₹ -27.6 Cr.
Price to Cash Flow
15.5
Free Cash Flow
₹ 1,064 Cr.
Debt to equity
0.02
OPM last year
34.3 %
OPM 5Year
48.8 %
Reserves
₹ 22,328 Cr.
Price to book value
1.69
Int Coverage
102
PEG Ratio
1.61
Price to Sales
2.09
Sales growth 3Years
14.7 %
Profit Var 3Yrs
8.97 %

NMDC: Multi-Year Breakout since 2011#NMDC has finally broken a resistance zone since 2011.
- Bullish H&S Pattern Breakout
- Currently in a retest phase
- Potential support - 145-150
- Also sharing the monthly chart for a better understanding of the resistance.
If you'd like to request an analysis, simply send us 100 coins as a token, and we'll be happy to post one for you.
⚠️Disclaimer: We are not registered advisors. The views expressed here are merely personal opinions. Irrespective of the language used, Nothing mentioned here should be considered as advice or recommendation. Please consult with your financial advisors before making any investment decisions. Like everybody else, we too can be wrong at times ✌🏻


NMDC - Bullish HarmonicThe Bullish Reciprocal AB=CD pattern on NMDC indicates the reversal on cards. With the 62EMA Moving Average Channel support, the reversal seems convincing for an upward momentum.

sell at zone ~ intradayexpecting small fall from the zone . look for confirmation inside zone in smaller tf.
- good for intraday trade
- entry inside zone
- sl is day close above zone
- for target draw fib retracement from C to latest swing high , use 0.236 fib as tgt 1 (safe place for intraday), 0.382 as tgt 2 (risk takers).
- don't trade , if u didn't get selling confirmation inside zone
- if day close is above this zone , this pattern becomes invalid.

lapu star breakoutA cup and handle price pattern on a security's price chart is a technical indicator that resembles a cup with a handle, where the cup is in the shape of a "u" and the handle has a slight downward drift.
The cup and handle is considered a bullish signal, with the right-hand side of the pattern typically experiencing lower trading volume. The pattern's formation may be as short as seven weeks or as long as 65 weeks.

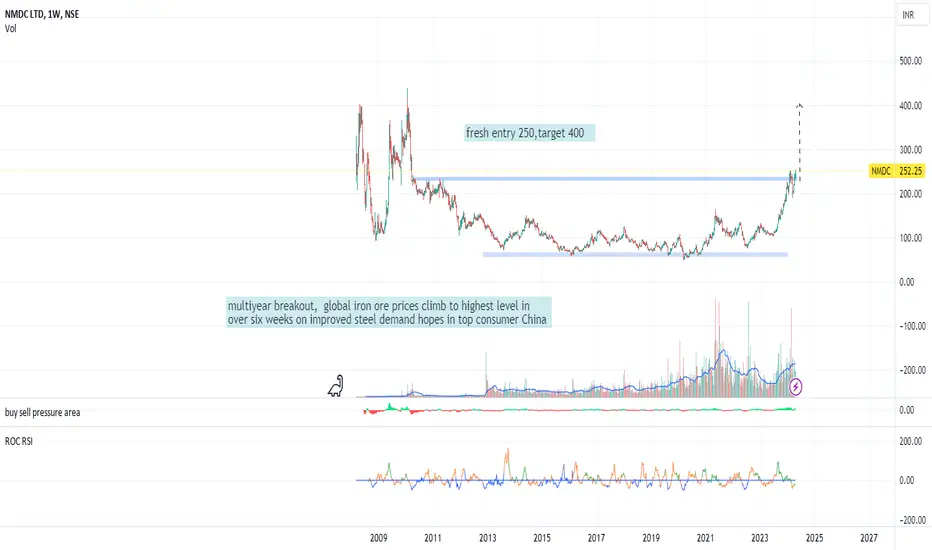
Buy NMDC 258 tgt 404/905 avg@ 202/160 Sl below 140 The stock came out of a decade long consolidation making rounding bottom and is visible for food upside in near medium term. It is on fresh breakout before loksabha elections marking its move for fresh lifetime high.

nmdc global iron ore prices climb to highest level in over six weeks on improved steel demand hopes in top consumer China
NMDC :: Iron Ore Rebounds?NSE:NMDC
- Script sees a breach of Monthly Bearish GPZ alongside Quarterly Bearish GPZ making it a "HOT PIVOT LEVEL" to keep on radar!
- Money Zones are marked alongside in 3 different shades as per the analysis from FUNDFLUX .
- This "Pivot & Price" action is been seen as iron ore prices have rebounded after 2weeks of down-fall and are further expected to rise on the hope of rate cuts from the West and fresh stimulus from China.
- If the trajectory remains strong supported by the anticipated news that this script can see a potential upside of 15-30% on upper levels of 255/280/310.
News Article is provided below -
www.moneycontrol.com

Head and shoulder formation on NMDCNMDC formed a head and shoulder pattern on daily chart. Price is about to breakout but please wait for clear breakout with strong close before you enter. When forming the head price was falling heavily but not with much volume. This indicates sellers are not willing to sell at these lower price. Stop loss can be held just below right shoulder with a risk reward of around 1:2.
Hope you like this idea, if you like, please boost the idea or leave a comment below on your thoughts. I'll be glad to hear from you. Otherwise happy trading :-)


Crossover Trade - NMDC📊 Script: NMDC
📊 Sector: Mining & Mineral products
📊 Industry: Mining / Minerals / Metals
Key highlights: 💡⚡
📈 Script is trading near middle band of BB.
📈 Already Crossover in MACD.
📈 Double Moving Averages are giving crossover.
📈 Right now RSI is around 57.
📈 One can go for Swing Trade.
⏱️ C.M.P 📑💰- 224
🟢 Target 🎯🏆 - 243
⚠️ Stoploss ☠️🚫 - 217
⚠️ Important: Always maintain your Risk & Reward Ratio.
✅Like and follow to never miss a new idea!✅
Disclaimer: I am not SEBI Registered Advisor. My posts are purely for training and educational purposes.
Eat🍜 Sleep😴 TradingView📈 Repeat 🔁
Happy learning with trading. Cheers!🥂

NMDC Ltd Simple Breakout Stocks Buy CMP With 190 SL NMDC Ltd Simple Breakout Stocks Buy CMP With 190 SL
Buy Now With CMP
Stop loss 190-195
Holding Time : 2 month
Target Near : 240-280
Disclosure : I am not SEBI registered.The information provided here is for education purposes only.I will not be responsible for any of your profit/loss with this channel suggestions.Consult your financial advisor before taking any decisions.Tweets neither advice nor endorsement.

NMDC UP MOVE??Nmdc might give a good swing or positional trade with a decent stoploss and good Targets
ENTRY - 202.25
STOPLOSS -200
TARGETS- 210, 218, 225++
Note- if any trade or value that's gone from the marked levels then that's not our trade just let it go or wait for it to come back
I'm not sebi registered this is my personal view
Please like or boost my idea if you like it or traded it
Thankyou
