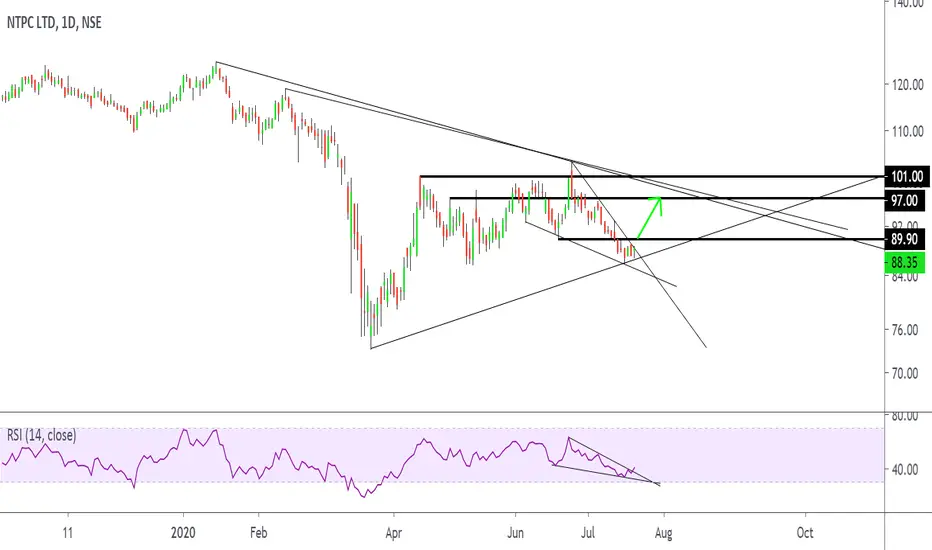
NTPC (Will the stock finally give up on going up ?)NTPC has been forming a triangle more of its been respecting 2 trend lines as shown in the chart. Any breach of the same should give a good momentum move.
Prices have been testing a very crucial zone and a continuous weak momentum can be bad for the stock. However any breach to the upside from a consolidation at such a level can take the price to higher levels. We have seen how over the previous day it has made a very compact channel. People looking to trade intraday can look to trade the breach of the same as well.
We need to keep in mind that volatility has been growing in for a while now and movements can be wild. As of today morning there was news of Donald Trump and the First Lady being tested positive for Corona Virus which caused the US Futures to tumble upto 1.5% and SGX Nifty followed suit. With fast approaching US election Volatility is not going to be subdued and is going to constantly cause wild movements.
I would suggest having strict stop loss and avoiding carry forward of positions without a hedge as it can wash out a traders capital in a day.
Trade with Caution.
NTPC trade ideas


NTPC Long Days Candle.Hi Traders,
From the kind of support am getting from my recent publishes, am guessing u want more short term analysis.
It seems price would honor the trendline in One days chart, and we have a key level at 88. So price can continue upwards after testing the trendline or the key level at 102.70. We suggest a buy entry only if you get price structure in the one days timeframe.
Hoping this was useful. For queries pls feel free to comment.
Happy Trading

NTPC keep a watchNTPC can go up, wait for BO and restest and enter with good R:R.
** Eductional purpose only **
This is my personal view, please do ur own research before taking any investment decision.
This view is negated if breaks the lower support.

Go Long NTPCNSE:NTPC
Simple analysis for NTPC on daily chart
1. Price crossing resistance indicated by the black line as well as the 200 day moving average indicate by the blue line
2, Volume above 20 moving average
3. RSI above 60 indicating good momentum
4. Big green candles
5. Minimum target indicated by the black line and fibonacci extension ration 1.618 i.e Rs. 115 if the upside continues (which is likely to continue because of the price breaking 200 days moving average as well as resistance.
Stop loss can be 200 days moving average.
Do comment, follow, share and like my posts if you agree and find value in them.


NTPC Weekly/Daily/240 demand 88.25-84.5NTPC Weekly/Daily/240 demand 88.25-84.5
pro:
1. Origin of weekly move
2.Weely/daily/240 min co insiding
3. 2 excplodive candle in daily
4. straight drop to the zone, so bounce can be clean and faster
con:
1. 4 base so confirmation entry
2.2 Cluster of zone left , so weaker zone

NTPC : HEAD AND SHOULDER PATTERN :SEE ALL MY PUBLICATIONS, IF IT SEEMS TO GIVE BOTH KNOWLEDGE AND PROFIT, THEN ONLY LIKE, SUBSCRIBE AND REFER TO YOUR FRIENDS.


ntpc is retracing after breakout and will give a good up moventpc was consolidating and formed a triagngle pattern, ntpc gave a breakout and a good bull move but it touched resistance and took a retracement on fibinochi and is expectd to move upwards

NTPC retest before breakoutNTPC is retracing to Top Channel Line after the breakout.
New longs can be initiated in 100-101 zone for targets upto 114 with a very small SL of 98.


NTPC BUY for 7-8% upmoveNTPC looks good at CMP need confirmation with one green candle
if it sustains then it can easily give 10%
stop loss of 100/99 levels

ntpc will fall down or not i am a new trader pls some one confirm that my analysis is correct or not
1.its forming an wedge pattern and moving down words
2. it have taken a resistance at 108.15 and start to fall down
3.the wedge patter is supporting both day and week chart time frame
4. And RSI touched 80 over brought zone
NSE:NTPC

NTPC - Intraday Technical AnalysisHi Traders,
From the kind of support am getting from my recent publishes, am guessing u want more short term analysis. Or maybe you dont want this kind of technical analysis and its better to stop what am doing and concentrate more on my trading. So this might be the last post on Indian stocks.
We have a bullish bias on this stock because of the breakout we had last week.
It seems price would honor the trendline in hourly chart, and we have a key level at 102.70. So price can continue upwards after testing the trendline or the key level at 102.70. We suggest a buy entry only if you get price structure in the lower timeframe.
Since we have the weekly trendline passing through the golden zone, we expect the maximum drawdown can be till this level.
Hoping this was useful. For queries pls feel free to comment.
Happy Trading


NTPC - Complete Technical AnalysisHi Traders,
This stock will provide some buying opportunities in coming days.
As we breakdown the chart, the price has broken through the weekly inner trendline in confluence with the break of SMA 50. This is a good indication that price will test the outer trendline .
The weekly chart formed a double bottom pattern and broke above the neckline, that's another reason to buy this stock.
A thing of concern about this stock is that we have a golden zone between 109.50 - 118.00 level, where price can move in a range before testing the outer trendline .
We should expect some drawdown as price can retest the broken levels. we have strong support at the neckline of double bottom and at the inner trendline .
A break above 130.40 levels marks the end of a 2 year long downtrend, and we will have a bullish outlook on this stock for at least a year and half.
For this kind of complete technical analysis msg me the stocks that u would like to have complete technical analysis .
Pls Like and follow .
Happy Trading.....


NTPC ::: BREAKOUTDATE: 20 AUG 2020
INSTRUMENT: NTPC
INDICATORS: DAY
PSAR: BULLISH
STOCHASTICS: BULLISH
200 DMA: 101.60
INDICATORS: WEEK
PSAR: BULLISH
STOCHASTICS: BULLISH
INDICATORS: MONTH
PSAR: BULLISH
STOCHASTICS: BULLISH
CMP: 101.10
BUY: 102.60
TGT . 01: 106.68
TGT . 02: 111.76
RISK DISCLOSURE :
Technical analysis of FOREX and INDIAN MARKETS. We are not SEBI REGISTERED ANALYSTS The views expressed here are for our record purposes only. Please consult your personal financial advisor before investing. We are in no way responsible for your profits/losses what so ever.

NTPC Looking Bullish on Chart & Good For Long RunHello There,
Greetings Form Team UD Trade..
This is short evaluation on NTPC (Chart Idea) As per current chart analysis we can expect good up trend in comming days, if you are looking for investment for a month this will be the best option from you. also you can expect tarfet with the levels 100 (First Target Within 2 weeks) 113 (Target 2 Within month) and if you want to make more profit in this you can go with the same flow.. Due to market downtrend this script is now below average price point do not miss this opportunity.. if you don't want to invest just do paper trade and wait for one month from today and comment below after one month with the LTP.
Hope this analysis will help you to make good profit as a positional trade..
Thanks
Team UD Trade
