The Ramco Cements Ltd intraday level for 7th Aug #RAMCOCEMThe Ramco Cements Ltd intraday level for 7th Aug #RAMCOCEM
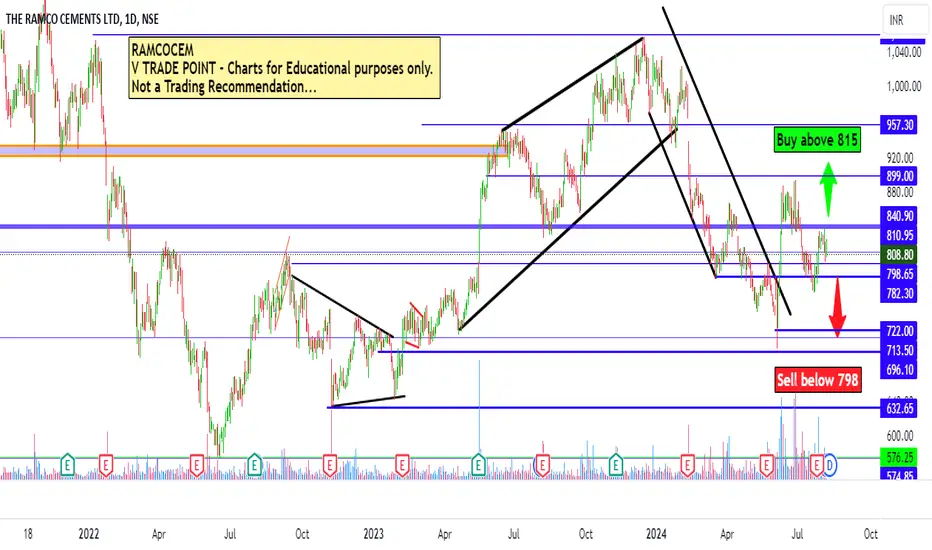
Buying may witness above 815
Support area 800-805. Below ignoring buying momentum for intraday
Selling may witness below 798
Resistance area 805-810. Above ignoring selling momentum for intraday
Charts for Educational purposes only.
Please follow strict stop loss and risk reward if you follow the level.
Thanks,
V Trade Point
RAMCOCEM trade ideas
The Ramco Cements Ltd intraday level for 5th Aug #RAMCOCEM The Ramco Cements Ltd intraday level for 5th Aug #RAMCOCEM
Buying may witness above 840
Support area 830. Below ignoring buying momentum for intraday
Selling may witness below 820
Resistance area 830. Above ignoring selling momentum for intraday
Charts for Educational purposes only.
Please follow strict stop loss and risk reward if you follow the level.
Thanks,
V Trade Point


Ramco Cement Intraday level for 24th July #RAMCOCEM Ramco Cement Intraday level for 24th July #RAMCOCEM
Buying may witness above 810
Support area 800. Below ignoring buying momentum for intraday
Selling may witness below 782
Resistance area 800. Above ignoring selling momentum for intraday
Charts for Educational purposes only.
Please follow strict stop loss and risk reward if you follow the level.
Thanks,
V Trade Point

buy at zone ~ intraday / positional - expecting small reversal from this zone
- good for intraday trade
ENTRY
- entry can be taken in two ways
1. place buy order at limit order , marked 0.58 level
2. look for confirmation in smaller time frame inside the zone.
STOP LOSS
- if candle close is below 0.618 level.
TARGET
- mark fib retracement from C to latest swing low
- TGT1 - 0.236 (mostly hits in intraday)
- TGT2 - 0.382
- TGT3 - 0.5

Ramco Cements Ltd Intraday level for 4th July #RAMCOCEM Ramco Cements Ltd Intraday level for 4th July #RAMCOCEM
Selling opportunity below 835
Stop Loss area 845
Charts for Educational purposes only.
Please follow strict stop loss and risk reward if you follow the level.
Thanks,
V Trade Point

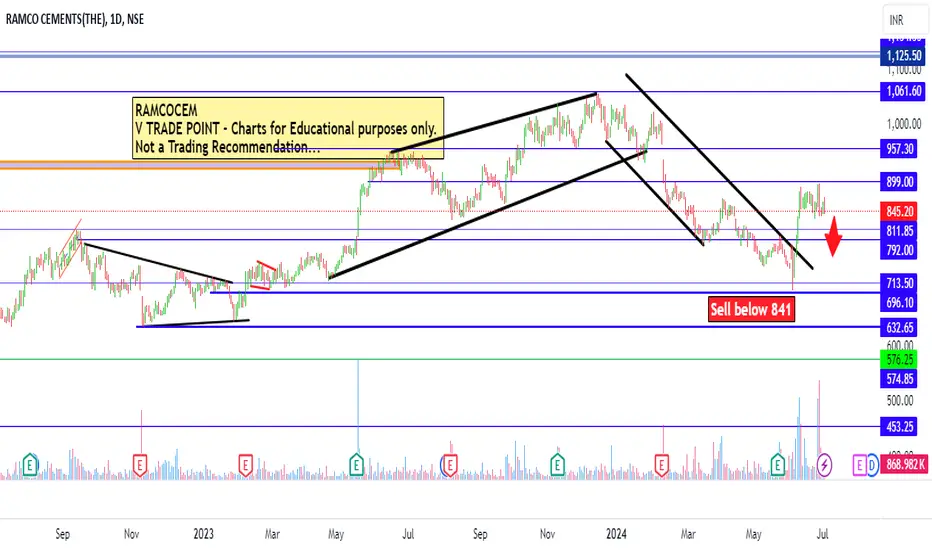
Ramco cement Intraday level for 3rd July #RAMCOCEM Ramco cement Intraday level for 3rd July #RAMCOCEM
Selling opportunity below 841
Stop Loss area 852
Charts for Educational purposes only.
Please follow strict stop loss and risk reward if you follow the level.
Thanks,
V Trade Point
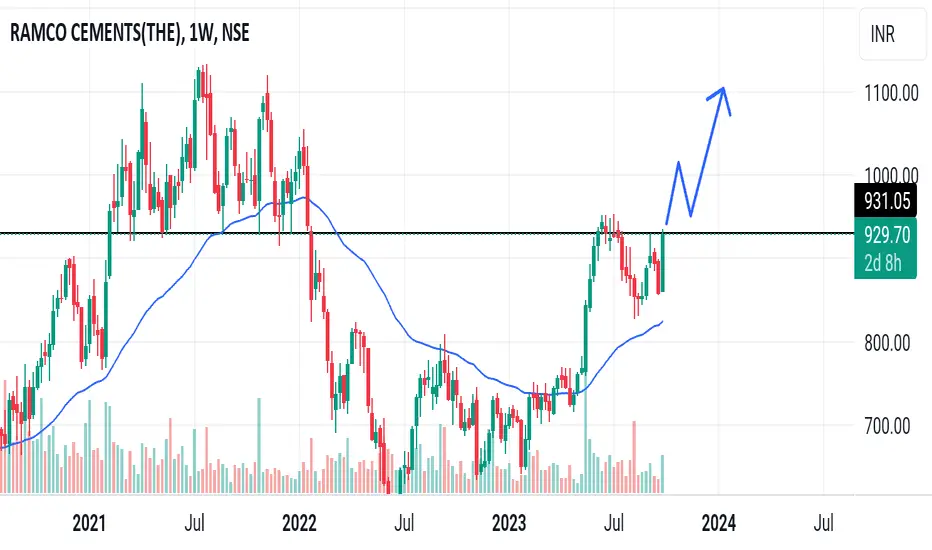
Ramco cement swing trad set-up i
:- stock ek aacha buying side set-up bana raha hai
:- one time frame pe 200 EMA ka support le raha hai
:- weekly time frame pe 50 EMA ka support le raha hai
:- buying ke liye aap weekly & Daly candal ke closing ka wait kar sakte hai
:- agar 890 ke upar closing deta hai to buying side ek aacha scenario ban sakta hai
:- CMP pe buying karna hai to aap thode qty se buying kar sakte hai
:- Sl ke sath trad kare

SWING IDEA - RAMCOCEMThe price has been falling down ever since it hit it major resistance at 1028 back in Dec 23.
It has been making new lows ever since.
Although it can be noticed that the MACD has finally started to show some upward momentum ever since March 24.
Could this Convergence Divergence indicate a good move upward?
Lets find out.

Ramco Cement can outperform.Ramco Cement is holding and trading above it's trendline support in 3 month chart.

Intraday view for Ramco Cement for today #RAMCOCEM Intraday view for Ramco Cement for today #RAMCOCEM
Selling opportunity may witness below 759
SL level around 770
Charts for Educational purposes only.
Not a Trading Recommendation.
Please strictly follow Risk Reward and Stop Loss if you follow the levels.
Thanks,
V Trade Point

RAMCOCEM 1WEEK.
.
.
I Am Not SEBI Registered Analyst. All Post and Levels Posting is only for educational and knowledge purpose. I Am not responsible for your any kind of loss or profit.
No Claim, All Rights Reserved.‼️

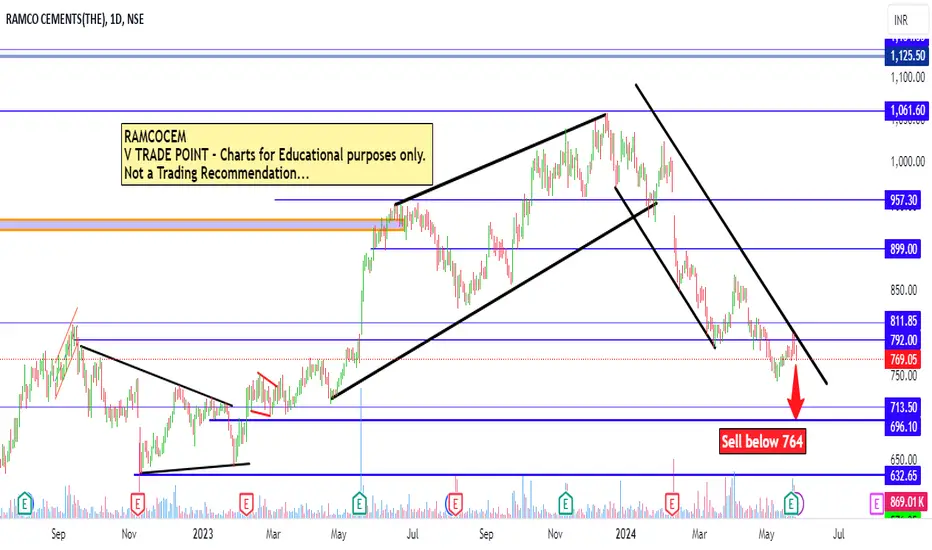
Intraday view for Ramco Cement for today #RAMCOCEM Intraday view for Ramco Cement for today #RAMCOCEM
Selling opportunity if sustain below 764
Resistance area around 785
Charts for Educational purposes only.
Not a Trading Recommendation.
Please strictly follow Risk Reward and Stop Loss if you follow the levels.
Thanks,
V Trade Point

Ramco Cement longThis share create flat pattern daily time frame
Normal flat correction internal one hour 3-3-5 or breakout

Possibilities of RAMCOCEMNSE:RAMCOCEM Stock break her trend line resistance and goes to bullish territory but before take any position, wait for retracement.

RAMCOCEM looks bullishRAMCOCEM is looking bullish on monthly, weekly and daily time frames. It has crossed 60 RSI levels monthly, weekly and daily. You can see volume has been increasing recently. It has been forming a cup and handle pattern. It has broken the neckline of C&H with significant volume. If it retraces 945 levels, it would be an excellent entry-level and can trade for over a 1:2 risk-to-reward ratio. It has a strong resistance at 1085 levels.

💥Ramco Cements💥- Nice Breakout💥Ramco Cements💥- Nice Breakout
Capital to be deployed- 20k
Investing Price -970-980
Breakout Price -963
Stoploss-832
Targets-1283-1484-1581
RT for max reach.
#ramcocements #StocksToBuy #stocks #StocksToTrade #StocksInFocus #stockstowatch #StocksInNews

Time to buy RamcoCemThe stock has breached its first resistance, which now acts as a support. Entry now gives good risk-to-reward ratio. Safe trade for the short term
Entry - 988-992
SL - 936
Target -1120

The Ramco Cements LtdTarget and STOPLOSS IN CHART
PREVIOUS TECHNICAL ANALYSIS ON THIS SCRIPT is below
FUNDAMENTALS
Market Cap
₹ 22,492 Cr.
Current Price
₹ 952
High / Low
₹ 956 / 634
Stock P/E
72.5
Book Value
₹ 288
Dividend Yield
0.21 %
ROCE
6.55 %
ROE
5.14 %
Face Value
₹ 1.00
Promoter holding
42.1 %
EPS last year
₹ 14.5
EPS latest quarter
₹ 3.34
Debt
₹ 4,507 Cr.
Pledged percentage
21.1 %
Net CF
₹ -7.45 Cr.
Price to Cash Flow
16.0
Free Cash Flow
₹ -358 Cr.
Debt to equity
0.66
OPM last year
14.5 %
OPM 5Year
20.7 %
Reserves
₹ 6,770 Cr.
Price to book value
3.31
Int Coverage
2.49
PEG Ratio
-7.83
Price to Sales
2.61
Sales growth 3Years
14.9 %
Profit Var 3Yrs
-17.1 %

RAMCOCEMThese are swing idea's which you can add your watchlist and analysis for yourself.
Keep on radar.
Potential upside stock!
This content for only education purpose!
I am not SEBI Register.
Ramco cement upsideJisko ram rakhe,
Usko kon chake
Ramco cement can see stoploss and target
Want to buy tips for short positional trades
Contact me
8200694352

Shorting Three Rounding upper pattern if this is break very sharp correction
so shorting opportunity lets see happy journey but market is uptrend so be caution
