RBL BANK CAN TEST 277 FROM CMP 290RBLBANK has Break its previous swing low of 294 and is currently trading at 290.
I expect the scrip to test level of 275 which also coincide with fib retracement level of 0.618
Stock may gain its bullish momentum above 304 level.
RBL Bank Ltd.
No trades
What traders are saying

RBL Bank Swing Setup Signals 2%–24% Upside From Breakout ZonePotential upside ranging from ~2% to ~24% is visible in NSE:RBLBANK RBL Bank, calculated from the safe breakout entry near ₹325 to Target 1 around ₹332 and the Swing Trade Target near ₹402. The stock is trading within a rising channel and is approaching a decisive breakout area on the daily timeframe.
Pattern Identified
Rising Channel Formation
Pullback-to-Support Structure within an uptrend
Setup suggests a trend continuation rather than a reversal
Price Action Analysis
Entry Zone: ₹305–₹310 (aggressive)
Safe Entry: Sustained daily close above ₹325
Target 1: ₹332 (≈2% upside from safe entry)
Target 2 / Resistance: ₹346
Target 3 / Reversal Zone: ₹361–₹375
Swing Trade Target: ₹402 (≈24% upside potential)
Invalidation / Risk: Breakdown below ₹296 may drag price toward ₹278–₹261 support zone
Price action shows higher highs and higher lows, with price respecting the rising trendline and demand zone. The projected pullback and continuation path aligns well with classic channel-based price behavior.
Key Technical Highlights
Strong ascending trendline support intact
Price holding above key support / breakdown zone
Multiple upside targets aligned with Fibonacci extensions
Clear risk-defined structure for swing traders
Psychological supply visible near ₹375–₹430 zone
The Breakout Analyst View
RBL Bank is positioned in a high-probability continuation setup as long as price sustains above ₹325 on a closing basis. The broader structure favors a gradual move higher toward ₹360+ and eventually ₹400+ levels. Traders should stay disciplined, wait for confirmation above resistance, and respect the invalidation levels to manage downside risk.
This setup is suitable for swing and positional traders following breakout and trend-continuation strategies. 📈

REVERSAL FROM 50 DEMA BUY Rbl BANKRBL bank a reversal from 50 dema buy near 306 strong buy interst here

RBL Bank: When Fundamentals Meet Elliott WaveDisclaimer:
This is not investment advice. Market analysis is shared for educational purposes only. Please do your own research and manage risk according to your trading plan. I am not responsible for any profits or losses incurred.
RBL Bank – Long Setup Explained
I'm sharing a high-conviction long setup on RBL Bank, supported by both technical and fundamental confluence.
1️⃣ Elliott Wave Structure
Price is progressing inside Wave 3 of an impulsive cycle.
Wave 3 is typically the strongest segment of the trend, and current market behavior aligns well with that momentum expectation.
2️⃣ Fundamental Confluence – The ₹280 Story
Emirates NBD has announced a major acquisition and a mandatory open offer at ₹280.
This creates a strong value anchor around the ₹280 zone — markets often treat such levels as demand areas because large institutional buying is structured around them.
As long as price holds above this zone, the bullish structure remains intact.
3️⃣ EMA Pullback Strategy
Price has recently pulled back into the EMA zone, which is a part of my high-probability pullback strategy.
The structure, momentum, and confluence align well with a continuation setup.
🔹 Trade Plan
Entry: CMP (around ₹302)
Stop-Loss: ₹274.90
Risk–Reward: Targeting 1:2 R:R
Invalidation: A clean break and close below ₹280 weakens the bullish thesis.

RBL Bank Looking Good RBL Bank Looking Good.. sustaining above 0.3 fib level.
I can see volume increse suggesting big investments.
stock comming out of reverse head and shoulder.
alsosmall Falg and pole suggest upword movent.
currently far from moving avaerages, can correct little bit.
CMD 299, 328(half quantity)
Targets : 390,400 ( i am looking for positional around 470 (0.6 fib level) in years or two).
Sl : 270, 260
This is not buy sell recommendation. ony for study purpose

RBL BANK DONE WITH ACCUMULATIONRbl bank has been side ways more than 5 years which was pure accumulation zone .
now it has broken from accumulation and looking strong on upside with good momentum .
one can go long with the target of 720

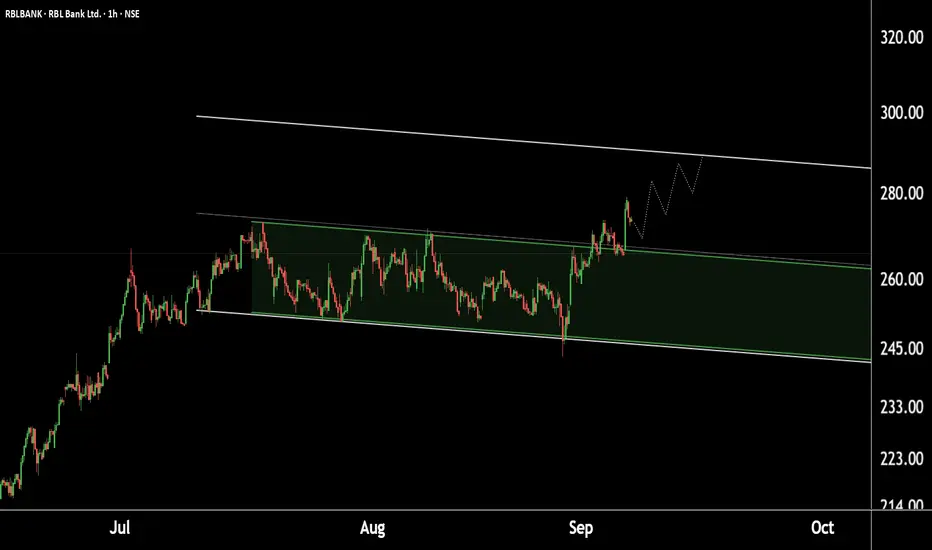
Momentum building in RBL Bank – Long positions can be consideredRBL Bank – Technical View (1 Hour Timeframe)
RBL Bank has given a breakout from the falling channel, indicating potential bullish momentum. The stock has immediate support in the ₹260–265 zone, which may act as a retest level post-breakout.
If this support zone holds, we may see an upward move towards the potential target range of ₹285–290.
THANK YOU !!
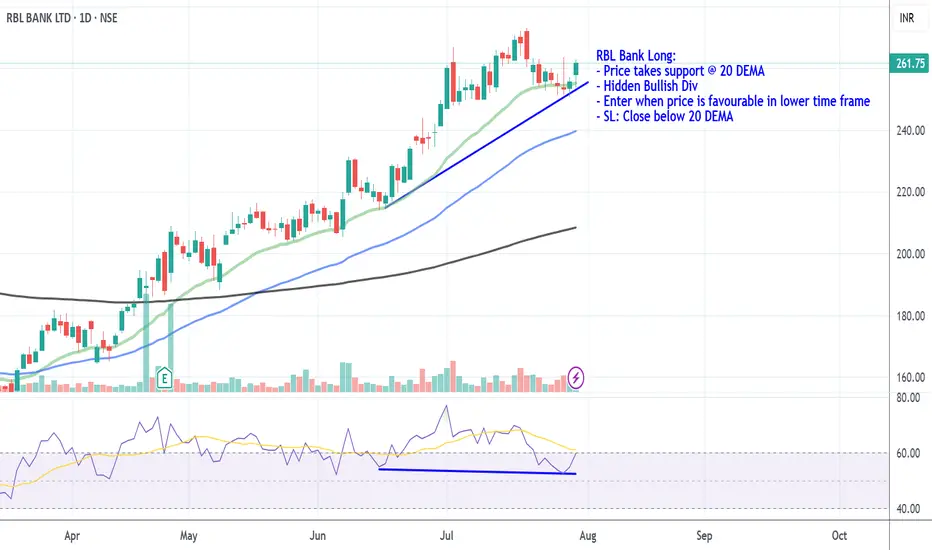
RBL Bank Long_Support @ 20 DEMARBL Bank Long:
- Price takes support @ 20 DEMA
- Hidden Bullish Div
- Enter when price is favourable in lower time frame
- SL: Close below 20 DEMA
RBL bank showing positive price action on weekly chatDown trend in RBL bank terminated by forming a CUP & Handle Pattern(also 200SMA Breakout was there) ,Breakout of this pattern was in june 23 & Target of this pattern was arround 290 level ,stock hit the same in Jan 24 ,After hitting the target stock now try to take support on 200SMA (which is arround 190).From here one can accumulate the stock (Stoploss 185) for a target price of 290 .

2 scenarios for RBLRBL is at a key resistance area. I see only 2 possible outcomes, either a cup and handle formation, or downright rejection to the bottom of the channel. Pick your poison. If it consolidates and gives a breakout, 270-300 can be target. Since I'm a long only guy on Indian sticks, that's my preference but as always, market doesn't care what I want. I have already bought from 180 levels, will add more if it goes lower.

RBLBANK | Buy @LTP | SL below 170 | 1st Target 209Disclaimer:
This is not financial advice. Please do your own research or consult with a financial advisor before making any investment decisions. Investments in stocks can be risky and may result in loss of capital.

RBLBANK | Buy if close above 182| SL below 170 | 1st Target 214 Disclaimer:
This is not financial advice. Please do your own research or consult with a financial advisor before making any investment decisions. Investments in stocks can be risky and may result in loss of capital.

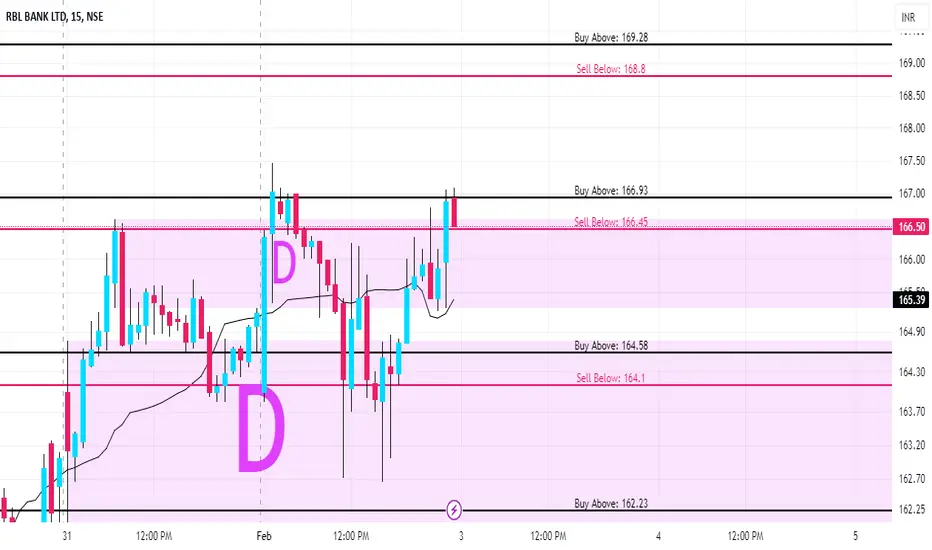
RBLBANK KEY LEVEL FOR 17/02/2025//description
// All credit goes to Tony for the concept of this indicator. His Trading View link: www.tradingview.com
// Note: The calculation method in this indicator differs from Tony's, but the concept is derived from his work.
I want to make it clear that I am not a seller, and this method was not taught to me by anyone. The original creator only gave me one clue:
👉 "If you get one level, you get all levels."
Everything else—the way I nail it the method and applied it—is my own work. I respect the original idea, but my approach is independent.
Explanation:
This trading system helps you avoid blind trades by providing confirmation for better entries and exits.
Entry/Exit Points:
- Entry/Exit Lines: Use the BLACK line for long trades and the RED line for short trades, based on confirmation from your trading plan.
- Stop Loss: For long trades, set the stop loss at the RED line below. For short trades, set it at the BLACK line above.
- Take Profit: For long trades, target the next RED line above. For short trades, target the next BLACK line below.
Timeframe:
Use a 5 mins timeframe for trading.
Risk Disclaimer:
This setup is for educational purposes. I'm not responsible for your gains or losses. Check the chart for more details.

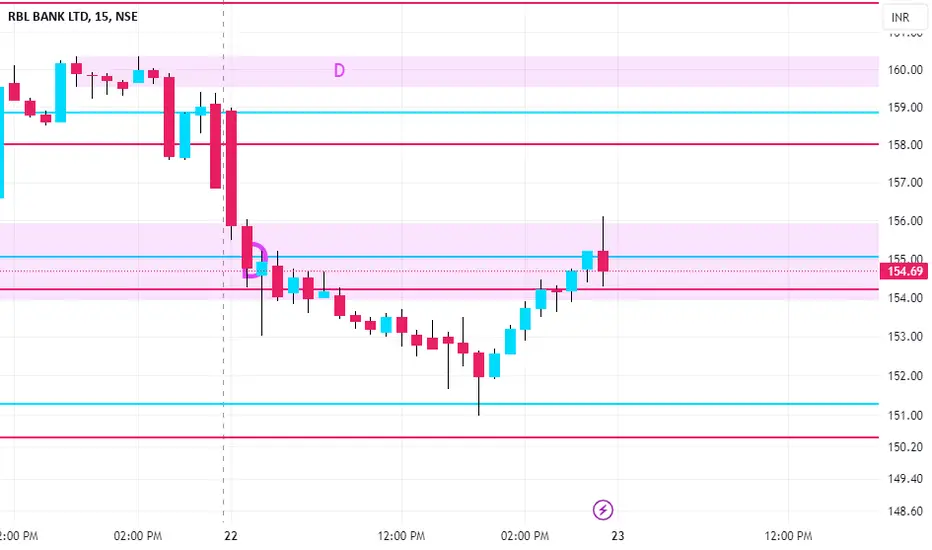
Stocks I'm looking to short tomorrow in #StockMarketIndiaStocks I'm looking to short tomorrow in #StockMarketIndia:
1. RBL BANK NSE:RBLBANK
Entry Level: ~164
Target Level: ~154
Potential Drop: -5.95% (~9.85 points)
✅Volume Consideration: Moderate liquidity (~301.92K)
✅Trade Plan:The price has broken support around 164, signaling a short opportunity.
✅Maintain a stop-loss above the entry point (~166-167) to avoid false breakouts.
✅Look for confirmation with increasing selling volume.
2. INDIAMART INTERMESH NSE:INDIAMART
Entry Level: ~2,150
Target Level: ~2,040
Potential Drop: -4.74% (~101.90 points)
✅Volume Consideration: Low (~11.17K), so be cautious of liquidity.
✅Trade Plan:The price is rejecting resistance around 2,150, a strong short opportunity.
✅A tight stop-loss around 2,175 to manage risk.
✅Consider scaling out partial positions near 2,080 to secure profits.
3. ULTRATECH CEMENT NSE:ULTRACEMCO
Entry Level: ~11,309
Target Level: ~10,944
Potential Drop: -3.23% (~365.60 points)
✅Volume Consideration: High (~25.88K), meaning smooth execution.
✅Trade Plan:The stock has rejected an intraday resistance and is forming a downward move.
✅A stop-loss above 11,400 should prevent large losses.
✅Watch for large institutional selling volume confirming breakdowns.
🎯General Risk Management:
✅ Position Sizing: Do not risk more than 2% of total capital on any trade.
✅ Stop-Loss Placement: Maintain strict discipline on SL levels.
✅ Exit Strategy: If market sentiment shifts, consider exiting early.
Just for educational purpose. 📚
Not a Buy/Sell Reccomendations❌❌❌

RBLBANK KEY LEVELS FOR 03/02/2025**Explanation:**
This trading system helps you avoid blind trades by providing confirmation for better entries and exits.
**Entry/Exit Points:**
- **Entry/Exit Lines:** Use the BLACK line for long trades and the RED line for short trades, based on confirmation from your trading plan.
- **Stop Loss:** For long trades, set the stop loss at the RED line below. For short trades, set it at the BLACK line above.
- **Take Profit:** For long trades, target the next RED line above. For short trades, target the next BLACK line below.
**Timeframe:**
Use a 5 mins timeframe for trading.
**Risk Disclaimer:**
This setup is for educational purposes. I'm not responsible for your gains or losses. Check the chart for more details.

RBLBANK KEY LEVELS FOR 27/01/2025**Explanation:**
This trading system helps you avoid blind trades by providing confirmation for better entries and exits.
**Entry/Exit Points:**
- **Entry/Exit Lines:** Use the BLACK line for long trades and the RED line for short trades, based on confirmation from your trading plan.
- **Stop Loss:** For long trades, set the stop loss at the RED line below. For short trades, set it at the BLACK line above.
- **Take Profit:** For long trades, target the next RED line above. For short trades, target the next BLACK line below.
**Timeframe:**
Use a 5 timeframe for trading.
**Risk Disclaimer:**
This setup is for educational purposes. I'm not responsible for your gains or losses. Check the chart for more details.

RBLBANK KEY LEVELS FOR 23/01/2025**Explanation:**
This trading system helps you avoid blind trades by providing confirmation for better entries and exits.
**Entry/Exit Points:**
- **Entry/Exit Lines:** Use the BLACK line for long trades and the RED line for short trades, based on confirmation from your trading plan.
- **Stop Loss:** For long trades, set the stop loss at the RED line below. For short trades, set it at the BLACK line above.
- **Take Profit:** For long trades, target the next RED line above. For short trades, target the next BLACK line below.
**Timeframe:**
Use a 5 timeframe for trading.
**Risk Disclaimer:**
This setup is for educational purposes. I'm not responsible for your gains or losses. Check the chart for more details.
RBL Turnaround??RBL was a Rs 700 stock, before falling from grace....we are clearly in a support area and i envision 2 paths for this stock, note the tight downward channel on weekly....there is buying interest with huge upside potential...Although stocks have a habit of making multiple trips to support area before an actual reversal, don't expect anything major for a while, but once the momentum starts, it will be difficult to enter....I'm buying with every dip to bring my average cost down which is 200 at this point, and i have multiple sell orders stacked till 700.....Use your own risk management.....

Review and plan for 20th January 2025 Nifty future and banknifty future analysis and intraday plan.
Results analysis.
This video is for information/education purpose only. you are 100% responsible for any actions you take by reading/viewing this post.
please consult your financial advisor before taking any action.
----Vinaykumar hiremath, CMT

$RBLBANK showing 5R opportunity in long termNSE:RBLBANK showing 5R opportunity in long term. Change of character observed last year . traversing back to OB will be a good trade if it works out

Lapu Star Risk Idea( {cash} ( latest close <= latest lower bollinger band ( 20,2 ) and latest rsi ( 14 ) <= 40 ) )

RBLBANK KEY LEVELS 12/12/2024//@description
// All credit goes to Tony for the concept of this indicator. His Trading View link: www.tradingview.com
// Note: The calculation method in this indicator differs from Tony's, but the concept is derived from his work.
**Explanation:**
This trading system helps you avoid blind trades by providing confirmation for better entries and exits. It considers volume, past prices, price range and indiavix.
**Entry/Exit Points:**
- **Entry/Exit Lines:** Use the BLACK line for long trades and the RED line for short trades, based on confirmation from your trading plan.
- **Stop Loss:** For long trades, set the stop loss at the RED line below. For short trades, set it at the BLACK line above.
- **Take Profit:** For long trades, target the next RED line above. For short trades, target the next BLACK line below.
**Timeframe:**
Use a 5 timeframe for trading.
**Risk Disclaimer:**
This setup is for educational purposes. I'm not responsible for your gains or losses. Check the chart for more details.
