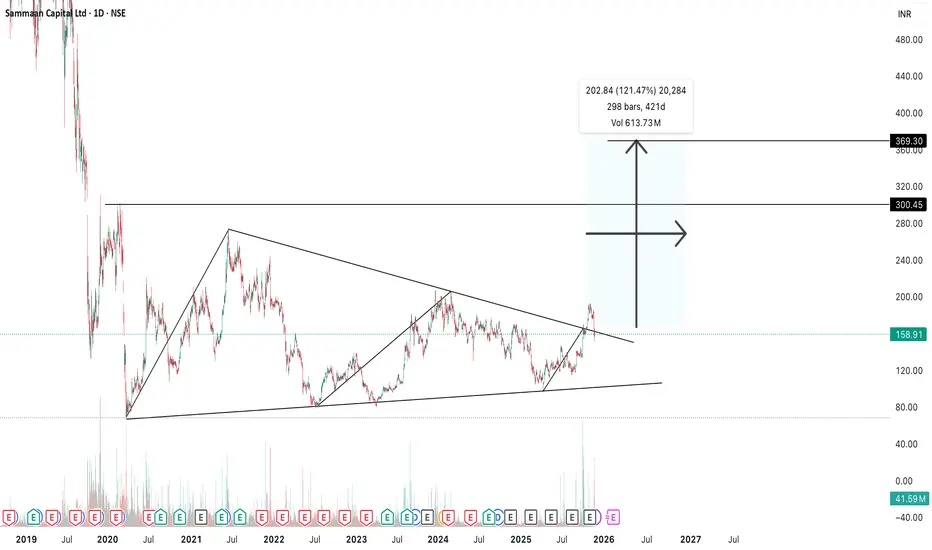
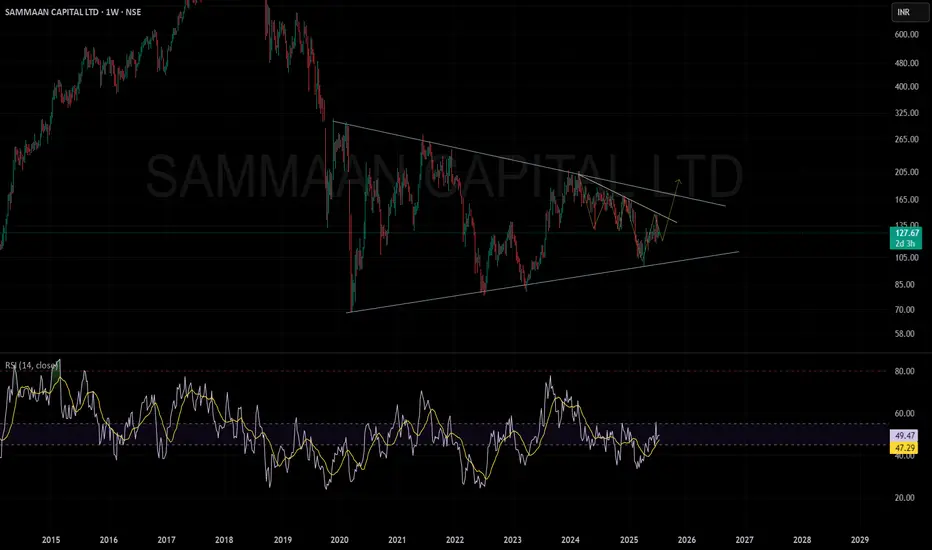
Sammaan Capital Triangle patternBullish Triangle Pattern on Sammaan Capital
Price has been consolidating inside a triangle pattern after a strong prior up-move, indicating healthy correction and energy build-up.
This is a personal study
Trade ideas
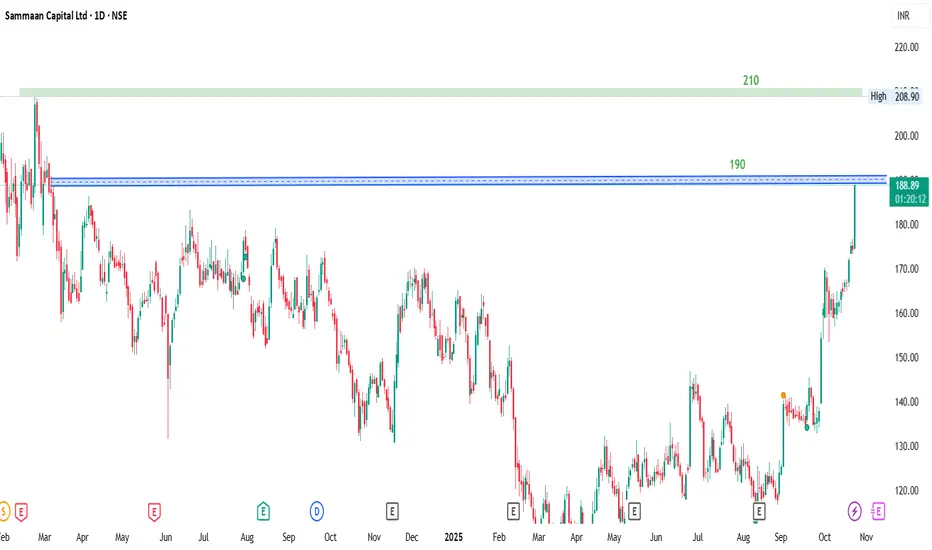
Sammaan Capital, 1, Long, Volumes, ResistanceSammaan Capital showing a good buying with good volumes at this level, if it breaks the 190 then we can see it going till 200 and 210.
Entry: above 190
Target1: 200
Target2: 210
Amazing breakout on WEEKLY Timeframe - SAMMAANCAPCheckout an amazing breakout happened in the stock in Weekly timeframe, macroscopically seen in Daily timeframe. Having a great favor that the stock might be bullish expecting a staggering returns of minimum 25% TGT. IMPORTANT BREAKOUT LEVELS ARE ALWAYS RESPECTED!
NOTE for learners: Place the breakout levels as per the chart shared and track it yourself to get amazed!!
#No complicated chart patterns
#No big big indicators
#No Excel sheet or number magics
TRADE IDEA: WAIT FOR THE STOCK TO BREAKOUT IN WEEKLY TIMEFRAME ABOVE THIS LEVEL.
Checkout an amazing breakout happened in the stock in Weekly timeframe.
Breakouts happening in longer timeframe is way more powerful than the breakouts seen in Daily timeframe. You can blindly invest once the weekly candle closes above the breakout line and stay invested forever. Also these stocks breakouts are lifelong predictions, it means technically these breakouts happen giving more returns in the longer runs. Hence, even when the scrip makes a loss of 10% / 20% / 30% / 50%, the stock will regain and turn around. Once they again enter the same breakout level, they will flyyyyyyyyyyyy like a ROCKET if held in the portfolio in the longer run.
Time makes money, GREEDY & EGO will not make money.
Also, magically these breakouts tend to prove that the companies turn around and fundamentally becoming strong. Also the magic happens when more diversification is done in various sectors under various scripts with equal money invested in each N500 scripts.
The real deal is when to purchase and where to purchase the stock. That is where Breakout study comes into play.
LET'S PUMP IN SOME MONEY AND REVOLUTIONIZE THE NATION'S ECONOMY!

Sammaan Capital Ltd - Weekly Breakout📊 Sammaan Capital Ltd – Major Trendline Breakout with Volume Spike 🚀
📅 Chart Date: October 2, 2025 | Timeframe: Weekly
📍 CMP: ₹169.58 (+23.04%)
📈 Symbol: NSE:SAMMAANCAP
🔍 Technical Analysis
📉 Multi-Month Downtrend Broken
Stock has been consolidating under a falling trendline since late 2023.
This week, price gave a clean breakout above the trendline with a strong bullish candle.
💥 Volume Confirmation
Current Weekly Volume: 359.94M vs Avg 81.78M 🔥
Indicates strong institutional participation.
🟡 Key Resistance
Next major hurdle is ₹204.38 (previous swing high).
Sustained closing above this zone can open doors for higher levels.
📌 Key Levels
Immediate Support (Breakout Retest): ₹142–₹150
Resistance Zone: ₹204.38
Potential Next Targets: ₹220 / ₹250
Stop loss for Swing Trades: ₹135
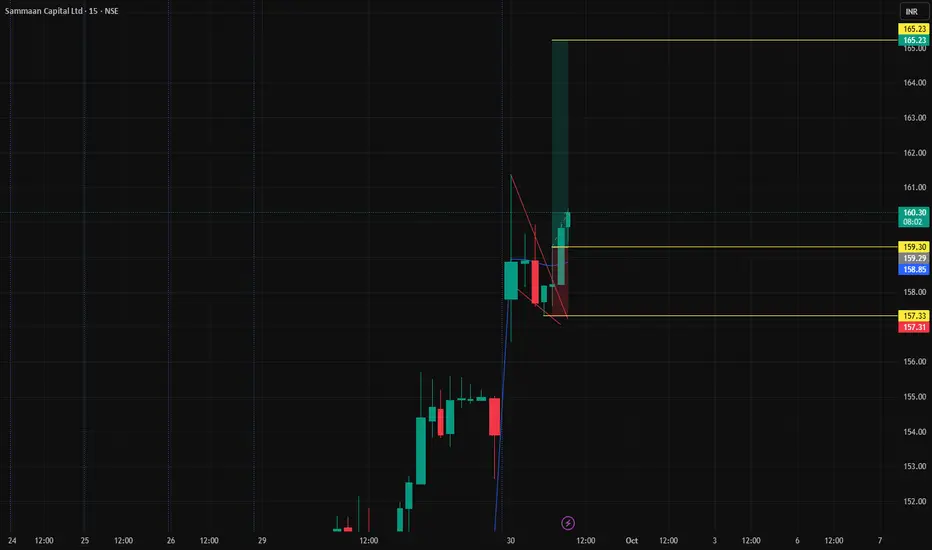
sammancap Intraday Bullish momentum with good volume & chart pattern breakout
entry-159.3
SL- 157.3
Target-165
SAMMAANCAP | Buy above 142 | SL below 130 | 1st Target 180Disclaimer:
This is not financial advice. Please do your own research or consult with a financial advisor before making any investment decisions. Investments in stocks can be risky and may result in loss of capital.
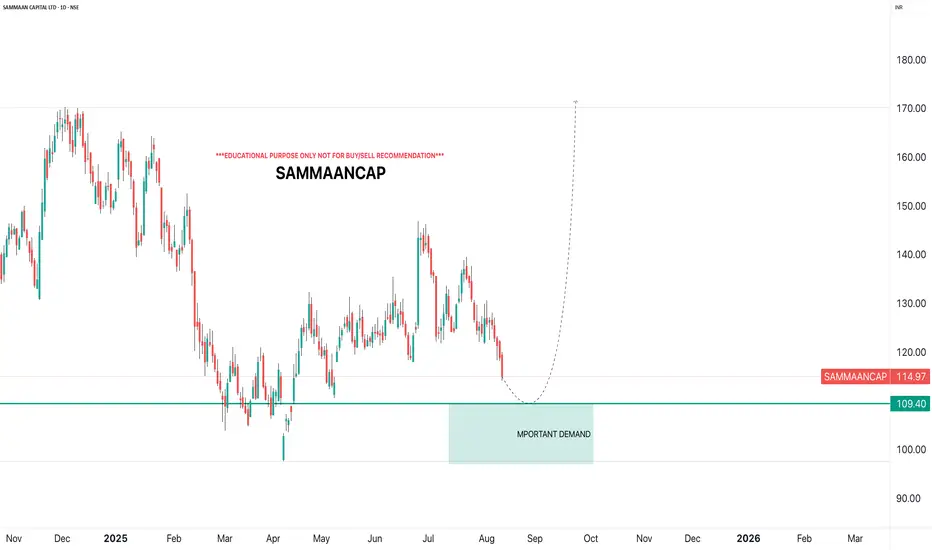
SAMMAANCAPi Observed these Levels based on Price Action and Demand & Supply which is my own Concept "PENDAM CONCEPTS"... Please don't take any trades based on this chart/post... Because this chart is for educational purpose only not for Buy or Sell Recommendation... Thank Q
Sanmaan capital.....cup and handle pattern Cup and handle pattern
Target seems to be 170
30% upside chance

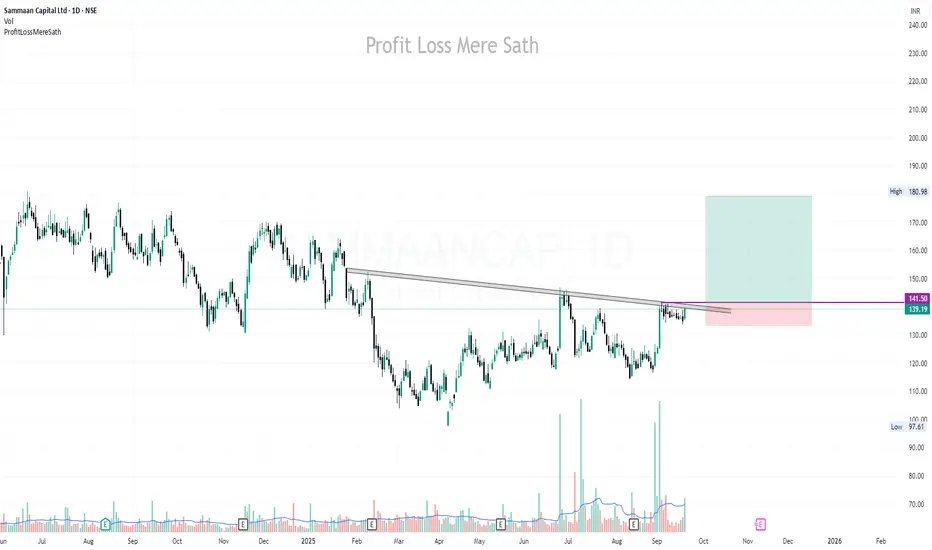
SAMMAAN CAPITAL LTD. trading in a consolidation zone.Sammaan Capital Ltd. is currently in a decisive zone on the weekly charts. For a trend change confirmation:
Short-term traders: Wait for a weekly close above ₹145.
Long-term investors: Look for a sustainable breakout above ₹175 to target the ₹280–₹300 zone.
Bearish bias: A close below ₹100 can signal further weakness.
Given the weekly timeframe, these moves may take time to materialize. Closely monitor weekly closes and volumes for early indications of a trend shift.
outperformance in price action and fundamentalsNSE:SAMMAANCAP
previously known as indiabulls housing finance now has been outperforming and management giving good guidance for future outlook in concall rest one should analyse themselves i am already invested in this stock and minimum targets for me are atleast 100 rs above from cmp
and will be holding this stock for long term until there is an ipo coming of its subsidiary sammaan finserve this has been a recent investment if any one wants to know the reasons for investment grade qualities i will be haapy to share them in comments if a question is asked

Next Big Move on Sammaan Capital LtdNext Big Move on Sammaan Capital Ltd,
As there is RSI divergence and prices are at support prices are at discounted level, Make sure to buy the dips with proper risk managements.

MOVING AVERAGE CROSSOVERStock - SAMMAAN CAPITAL
ENTERY - 174
SL - 166
TARGET- 198
#RISKMANAGE
IF 50K CAPITAL
Position size(no of share) 62
MAX LOSS - 500
PROFIT ------(1500+)
RISK TO REWARD (1:3)

Upcoming movement for india bulls housing finance Please appreciate the price tracement and change in trend
