SJS ENT📊 SJS Trade Plan Summary
🔹 Multi-Timeframe Analysis
Yearly Demand: 742 – 376 (Avg 559) → UP Trend
6 Month Demand: 828 – 549 (Avg 689) → UP
Quarterly Demand: 828 – 760 (Avg 794) → UP
Monthly Demand: 1061 – 820 (Avg 941) → UP
Weekly Demand: 1217 – 1135 (Avg 1176) → UP
Daily Demand: 1217 – 1135 (Avg 1176) → UP
Intraday TF Demand (60M / 180M / 240M): 1187 – 1135 → Strong UP
✅ Overall Bias: Consistent bullish alignment across all MTF & ITF → Strong Buy Setup.
🔹 Trade Plan
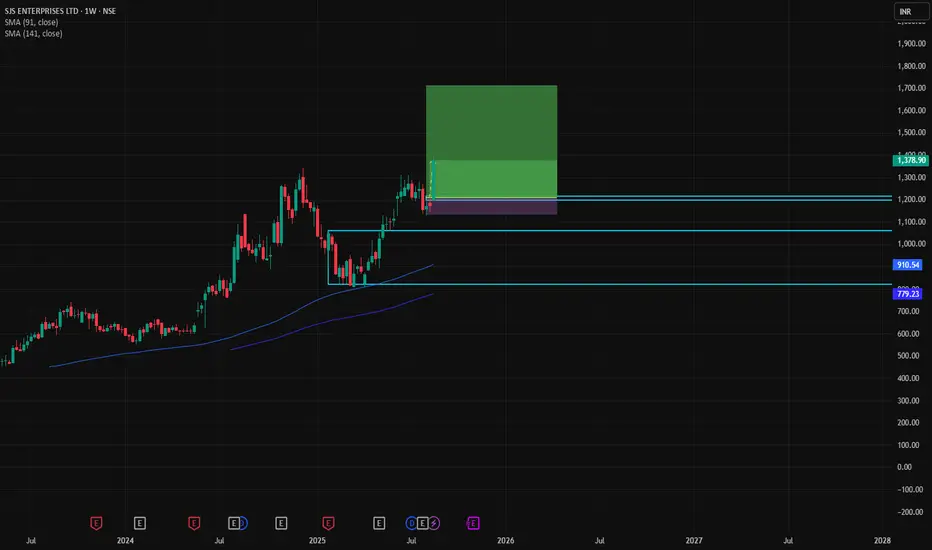
Entry: 1217
Stop Loss (SL): 1135
Risk per Share: 82
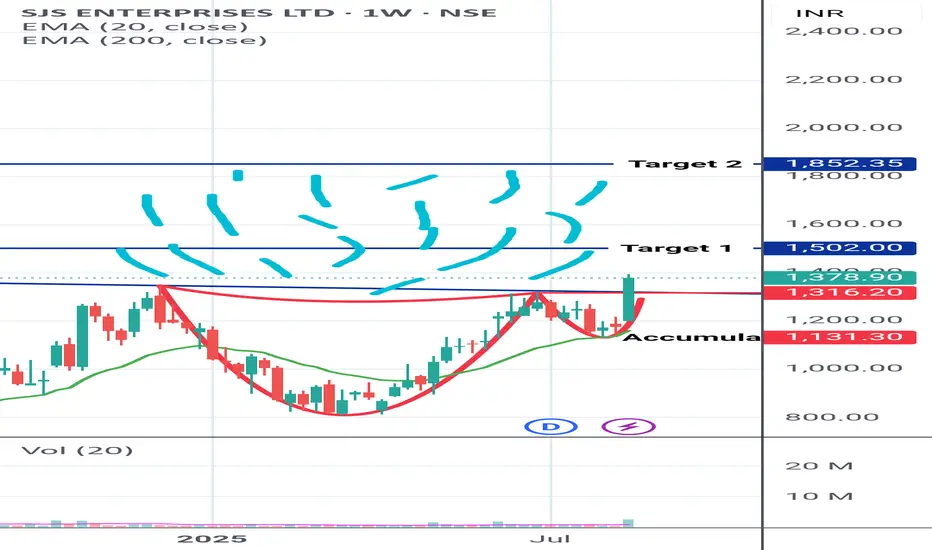
Target: 1742
Reward per Share: 525
RR: 6.40
🔹 Position Sizing & Capital
Qty: 1000 shares
Total Buy Value: ₹12,17,000
Capital Required (40% Margin): ₹4,86,800
Brokerage & Charges (~0.49%): ₹5,966
🔹 P&L Outcome
If Target Hit:
Gross Profit = ₹5,25,000
Net Profit after costs = ₹5,19,034
ROI (on margin capital, pre-interest) = 106%
If SL Hit:
Gross Loss = ₹82,000
Net Loss after costs = ₹87,966
➡️ Net RR: ~5.9 : 1 (Excellent).
🔹 MTF Interest Impact (4 months @ 9.69% p.a.)
Capital Funded (MTF 60%): ₹7,30,200
Total Interest (4 months): ₹23,262
Adjusted Net Profit After Interest: ₹4,95,772
Real ROI (on 4.86L margin in 4 months): ~102%
✅ SJS Final Takeaway
Strongest bullish alignment across all TFs (Yearly → Daily → Intraday).
Attractive RR ~6 with potential 100% ROI in 4 months (leveraged MTF).
Risk very well defined (₹88K vs ₹5.2L reward).
Works beautifully as a high conviction trade in your portfolio, similar to Bajaj Finance plan.
SJS trade ideas
SJS ENTERPRISES VERY HOTSJS ENTERPRISES
Presents you a Hot Beautiful Cup of Coffee for tasting.
Those who wish to Enjoy the Taste can pay and start tasting it
Note Levels mentioned in chart itself. Kindly go through it
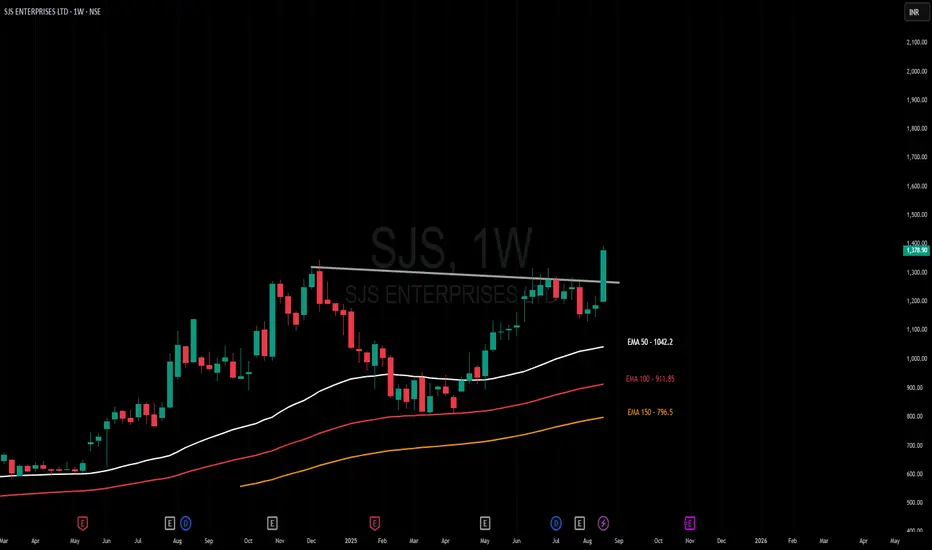
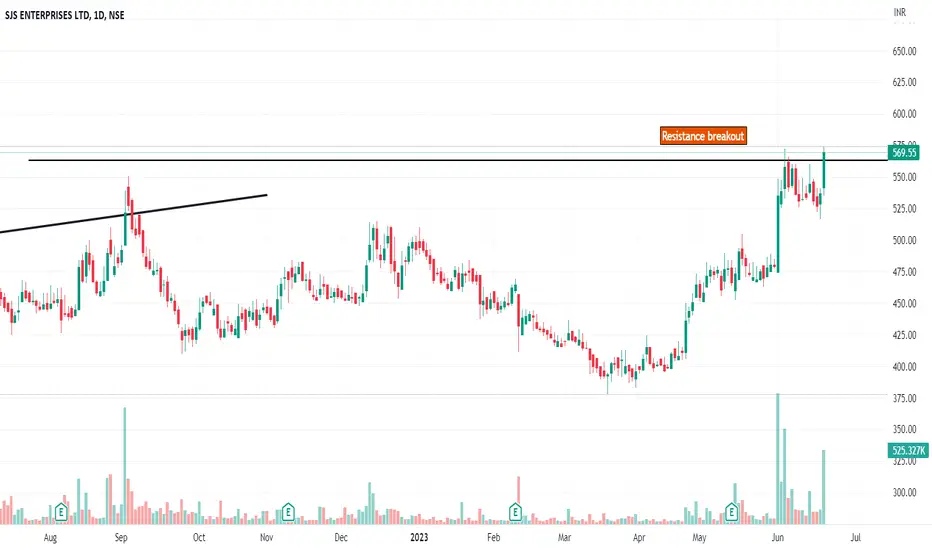
Amazing breakout on WEEKLY Timeframe - SJSCheckout an amazing breakout happened in the stock in Weekly timeframe, macroscopically seen in Daily timeframe. Having a great favor that the stock might be bullish expecting a staggering returns of minimum 25% TGT. IMPORTANT BREAKOUT LEVELS ARE ALWAYS RESPECTED!
NOTE for learners: Place the breakout levels as per the chart shared and track it yourself to get amazed!!
#No complicated chart patterns
#No big big indicators
#No Excel sheet or number magics
TRADE IDEA: WAIT FOR THE STOCK TO BREAKOUT IN WEEKLY TIMEFRAME ABOVE THIS LEVEL.
Checkout an amazing breakout happened in the stock in Weekly timeframe.
Breakouts happening in longer timeframe is way more powerful than the breakouts seen in Daily timeframe. You can blindly invest once the weekly candle closes above the breakout line and stay invested forever. Also these stocks breakouts are lifelong predictions, it means technically these breakouts happen giving more returns in the longer runs. Hence, even when the scrip makes a loss of 10% / 20% / 30% / 50%, the stock will regain and turn around. Once they again enter the same breakout level, they will flyyyyyyyyyyyy like a ROCKET if held in the portfolio in the longer run.
Time makes money, GREEDY & EGO will not make money.
Also, magically these breakouts tend to prove that the companies turn around and fundamentally becoming strong. Also the magic happens when more diversification is done in various sectors under various scripts with equal money invested in each N500 scripts.
The real deal is when to purchase and where to purchase the stock. That is where Breakout study comes into play.
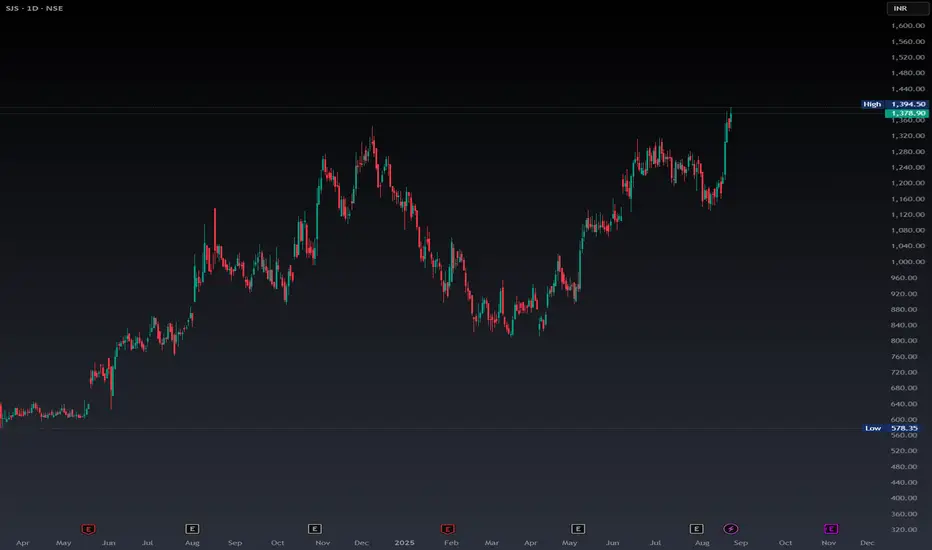
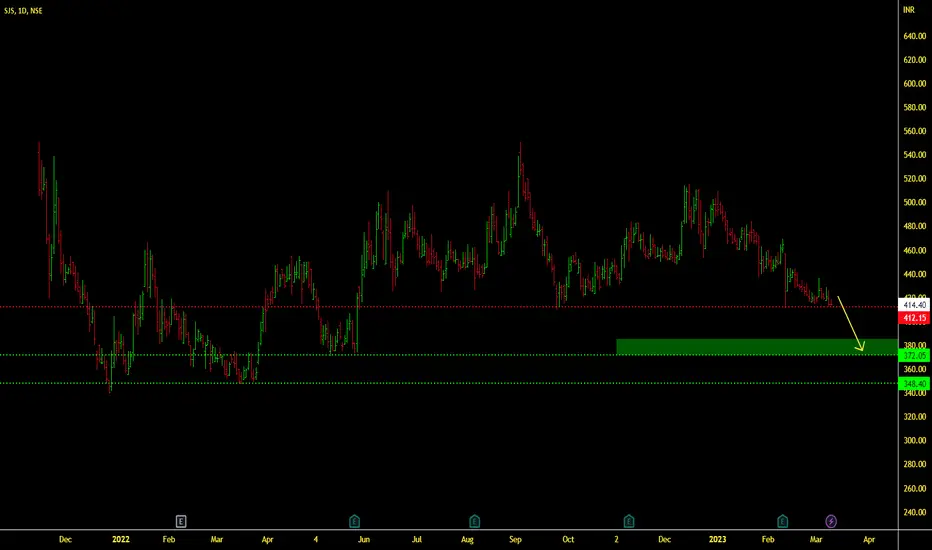
Check this stock which has made an all time low and high chances that it makes a "V" shaped recovery.
> Taking support at last years support or breakout level
> High chances that it reverses from this point.
> Volume dried up badly in last few months / days.
> Very high suspicion based analysis and not based on chart patterns / candle patterns deeply.
> VALUABLE STOCK AVAILABLE AT A DISCOUNTED PRICE
> OPPURTUNITY TO ACCUMULATE ADEQUATE QUANTITY
> MARKET AFTER A CORRECTION / PANIC FALL TO MAKE GOOD INVESTMENT
DISCLAIMER : This is just for educational purpose. This type of analysis is equivalent to catching a falling knife. If you are a warrior, you throw all the knives back else you will be sorrow if it hits SL. Make sure to do your analysis well. This type of analysis only suits high risks investor and whose is willing to throw all the knives above irrespective of any sectoral rotation. BE VERY CAUTIOUS AS IT IS EXTREME BOTTOM FISHING.
HOWEVER, THIS IS HOW MULTIBAGGERS ARE CAUGHT !
STOCK IS AT RIGHT PE / RIGHT EVALUATION / MORE ROAD TO GROW / CORRECTED IV / EXCELLENT BOOKS / USING MARKET CRASH AS AN OPPURTUNITY / EPS AT SKY.
LET'S PUMP IN SOME MONEY AND REVOLUTIONIZE THE NATION'S ECONOMY!
SJS - A breakout stockA good breakout stock, keep an eye.
RSI looks strong and closed above previous ATH.
High Volume can be seen as well
SJS Enterprises LTD Bullish CUP and Handle SJS Enterprises has formed a perfect Cup and Handle pattern and broke the resistance with good volume.

SJS1. Anything can happen.
2. You don't need to know what is going to happen next in order to make money.
3. There is a random distribution between wins and losses for any given set of variables that define an edge. No other thoughts
4. An edge is nothing more than an indication of a higher probability of one thing happening over another.
5. Every moment in the market is unique.

SJS ENTERPRISES LTDThis stock breakout and retest there respective level
and this analysis for educational purpose only

SJS Enterprises#EarningsGapUp
Stock consolidating after it gapped up post the results.
Will look to go long above 725. Ideally would want it to breakout after 2 days.

SJS Fib trade set up1. Trend: Bullish to sideays
2. Set up: Reversal
3. RR: 1:5 to all the way to 10R
4. Stop loss: 2 SL can be followed, aggressive with 4.3%
or easy room to avoid volatility.

SJSAfter taking support at all time high. and 20 &200 MA are also supporting on daily time frame.
u can think for buy on some retracement sl will be 550 target will be 1:3.

Some targets For investors Hi @JainArpan
Just A support and some targets Nothing for me to study.
All the best.
Gratify if you appreciate the practice then you can like it, share it and
If you want me to investigate any chart for you then would cherish doing that for you.
Thank you for your time and support.
Stay safe.

SJSSJS cup pattern at all time high keep an eye on this stock. break out with gud volume. can buy if crossed all time high it will have gud long term target if sustain all time high

SJS Enterprise-Nice BreakoutSJS Enterprise-Nice Breakout
Capital to be deployed- 20k
Investing Price -610-614
Breakout Price -604
Stoploss -548
Targets -781
#sjsenterprise #StocksInFocus #StocksToBuy #stockstowatch #stocks #StocksToTrade #SwingTrading #BREAKOUTSTOCKS

Resistance BreakoutPlease look into the chart for a detailed understanding.
Consider these for short-term & swing trades with 2% profit.
For BTST trades consider booking
target for 1% - 2%
For long-term trades look out for resistance drawn above closing.
Please consider these ideas for educational purpose
SJS looking good for IPO Base BreakoutSJS Enterprises Ltd. (SJS) is one of the leading players in the Indian decorative aesthetics industry in terms of revenue. It offers a "design-to-delivery" aesthetics solutions provider with the ability to design, develop and manufacture a diverse product portfolio for a wide range of customers primarily in the automotive and consumer appliance industries.

SJS ENETERPRISES DECENDING TRIANGLE BROUT, GOOD FUNDAMENTALS Good fundamentals, good clients, Have found a descending triangle break out recently happened, so its retesting expects soon within two three sessions.This month expecting to close above the previous month high and breaking this month high again will be a great opportunity. Be patient and vigilant while taking trades.
Disclaimer : Not a sebi regd analyst , analysis for educational purpose only.
HAPPY TRADING GUYS ....

SJS S.J.S. Enterprises has an operating revenue of Rs. 398.75 Cr. on a trailing 12-month basis.
An annual revenue growth of 47% is outstanding, Pre-tax margin of 20% is great, ROE of 15% is good.
The company is debt free and has a strong balance sheet enabling it to report stable earnings growth across business cycles.
The stock from a technical standpoint is trading close to its 50DMA and comfortably placed above its 200DMA, around 11% above 200DMA.
It needs to take support around the 50 DMA level to continue further upside move.
Wedge with double bottom.
Can expect a very good move above 510.
I have placed a buy now @ 475

Tripple Top with Trend line BoSJS enterprise -after making double bottom , trying to make new top 3rd top bo with cross over of trendline also . YoY Good result and also almost debt free so far. Good OPM.
