Is This the Right Time to Buy WAAREE ENERGIES...?At the moment, WAAREE ENERGIES is experiencing a pullback to the 3000 rs mark. This price point corresponds with the 0.5 Fibonacci retracement level, which often serves as a significant area of support in technical analysis. As a result, this could be a strategic opportunity for investors to consider making their initial investment.
For those looking to build their position further, it may be prudent to plan for a second investment if the stock price dips to around the 2600 rs level. Keep in mind that this analysis is based solely on technical indicators and does not take into account the fundamental aspects of the company or the market. Therefore, it's crucial to conduct your research and consider all variables before making any investment decisions.
Trade ideas

Potential Correction Ahead for Waaree Energies Ltd After Strong Analysis:
1.Price Surge and Overextension: Waaree Energies Ltd has witnessed a sharp upward move, pushing prices significantly higher in a short period. This steep ascent could indicate an overextension, making the stock vulnerable to a pullback or consolidation phase.
2.Resistance Levels:
Immediate resistance is observed around the 3,600 level, with another support/resistance flip level near 3,300. Price nearing these levels might trigger profit-taking or selling pressure from short-term traders.
3.Overbought RSI Indicator: The RSI is currently in overbought territory, signaling an overvalued condition. Historically, an RSI above 70 often suggests a cooling-off period might be near, as buying momentum may slow down.
4.Volume Insights: The recent price rally has been accompanied by high volume, which validates the strength of the trend. However, any decrease in volume while the price stays elevated could indicate waning buying interest, strengthening the case for a correction.
Conclusion: Given the steep rise, overbought RSI, and proximity to resistance, caution is advised. A healthy correction could provide better entry opportunities. Monitor for potential reversal signals and volume changes to gauge the sustainability of this trend.
Trade Idea: Consider waiting for confirmation of a pullback or consolidation before entering new positions. Key support areas for potential retracement include 3,300, 2,625, and 2,280.

WAAREE ENERGIES LTD S/RSupport and Resistance Levels:
Support Levels: These are price points (green line/shade) where a downward trend may be halted due to a concentration of buying interest. Imagine them as a safety net where buyers step in, preventing further decline.
Resistance Levels: Conversely, resistance levels (red line/shade) are where upward trends might stall due to increased selling interest. They act like a ceiling where sellers come in to push prices down.
Breakouts:
Bullish Breakout: When the price moves above resistance, it often indicates strong buying interest and the potential for a continued uptrend. Traders may view this as a signal to buy or hold.
Bearish Breakout: When the price falls below support, it can signal strong selling interest and the potential for a continued downtrend. Traders might see this as a cue to sell or avoid buying.
20 EMA (Exponential Moving Average):
Above 20 EMA(50 EMA): If the stock price is above the 20 EMA, it suggests a potential uptrend or bullish momentum.
Below 20 EMA: If the stock price is below the 20 EMA, it indicates a potential downtrend or bearish momentum.
Trendline: A trendline is a straight line drawn on a chart to represent the general direction of a data point set.
Uptrend Line: Drawn by connecting the lows in an upward trend. Indicates that the price is moving higher over time. Acts as a support level, where prices tend to bounce upward.
Downtrend Line: Drawn by connecting the highs in a downward trend. Indicates that the price is moving lower over time. It acts as a resistance level, where prices tend to drop.
RSI: RSI readings greater than the 70 level are overbought territory, and RSI readings lower than the 30 level are considered oversold territory.
Combining RSI with Support and Resistance:
Support Level: This is a price level where a stock tends to find buying interest, preventing it from falling further. If RSI is showing an oversold condition (below 30) and the price is near or at a strong support level, it could be a good buy signal.
Resistance Level: This is a price level where a stock tends to find selling interest, preventing it from rising further. If RSI is showing an overbought condition (above 70) and the price is near or at a strong resistance level, it could be a signal to sell or short the asset.
Disclaimer:
I am not a SEBI registered. The information provided here is for learning purposes only and should not be interpreted as financial advice. Consider the broader market context and consult with a qualified financial advisor before making investment decisions.

Go long in Waaree Energies LtdYou can take a buy trade in Waaree Energies with a Stoploss of 2755. On the upper side we can expect targets of 3050, 3340. For investment purpose also, stoploss of 2755 is recommended. If market favours then target is 3050, or wait for a good dip.

WAAREE ENERGIES LTD S/RSupport and Resistance Levels:
Support Levels: These are price points (green line/shade) where a downward trend may be halted due to a concentration of buying interest. Imagine them as a safety net where buyers step in, preventing further decline.
Resistance Levels: Conversely, resistance levels (red line/shade) are where upward trends might stall due to increased selling interest. They act like a ceiling where sellers come in to push prices down.
Breakouts:
Bullish Breakout: When the price moves above resistance, it often indicates strong buying interest and the potential for a continued uptrend. Traders may view this as a signal to buy or hold.
Bearish Breakout: When the price falls below support, it can signal strong selling interest and the potential for a continued downtrend. Traders might see this as a cue to sell or avoid buying.
20 EMA (Exponential Moving Average):
Above 20 EMA(50 EMA): If the stock price is above the 20 EMA, it suggests a potential uptrend or bullish momentum.
Below 20 EMA: If the stock price is below the 20 EMA, it indicates a potential downtrend or bearish momentum.
Trendline: A trendline is a straight line drawn on a chart to represent the general direction of a data point set.
Uptrend Line: Drawn by connecting the lows in an upward trend. Indicates that the price is moving higher over time. Acts as a support level, where prices tend to bounce upward.
Downtrend Line: Drawn by connecting the highs in a downward trend. Indicates that the price is moving lower over time. It acts as a resistance level, where prices tend to drop.
RSI: RSI readings greater than the 70 level are overbought territory, and RSI readings lower than the 30 level are considered oversold territory.
Combining RSI with Support and Resistance:
Support Level: This is a price level where a stock tends to find buying interest, preventing it from falling further. If RSI is showing an oversold condition (below 30) and the price is near or at a strong support level, it could be a good buy signal.
Resistance Level: This is a price level where a stock tends to find selling interest, preventing it from rising further. If RSI is showing an overbought condition (above 70) and the price is near or at a strong resistance level, it could be a signal to sell or short the asset.
Disclaimer:
I am not a SEBI registered. The information provided here is for learning purposes only and should not be interpreted as financial advice. Consider the broader market context and consult with a qualified financial advisor before making investment decisions.

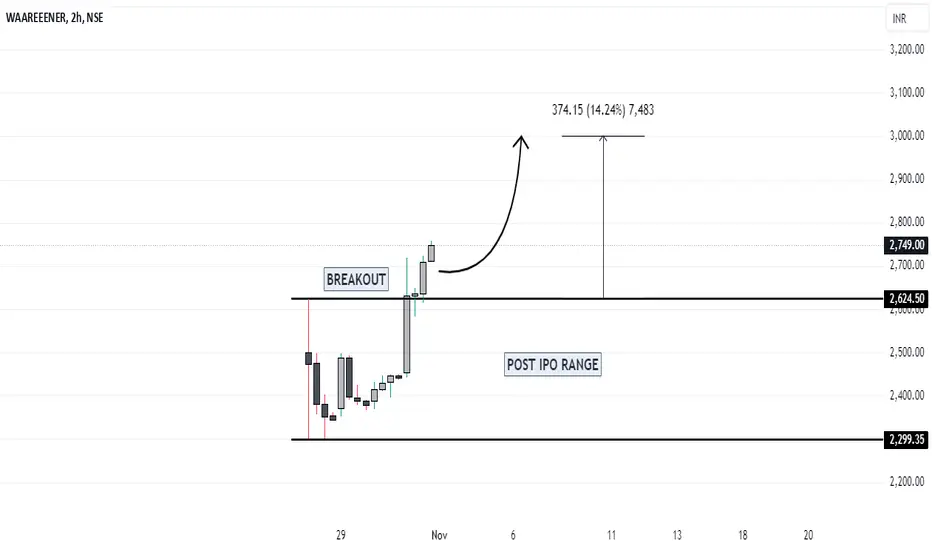
WAAREE ENERGIES: Set to Shine in the Next Rally...?WAAREE ENERGIES has recently broken out of its previous sideways trading range following its listing. This significant movement suggests a positive shift in market sentiment towards the stock. With this breakout, the company is now setting its sights on a price target of 3000, indicating strong bullish potential for investors.