CRUDE OIL (WTI) BUY SETUPCrude oil has pulled back to a strong support zone, aligning perfectly with the bottom of its ascending structure. Price action is showing signs of buyers stepping in, which could lead to a natural continuation of the uptrend.
🛢 Additional bullish factors:
🟢 Price reacted strongly from support, indicating accumulation.
🟢 Supply-side tensions and global demand outlook continue to support higher prices.
🟢 Technical structure favors a push toward higher highs if support holds.
📈 TP Levels:
TP1: 65.88
TP2: 66.65
TP3: 67.39
TP4: 68.13
SL below support 🚫
Trade ideas

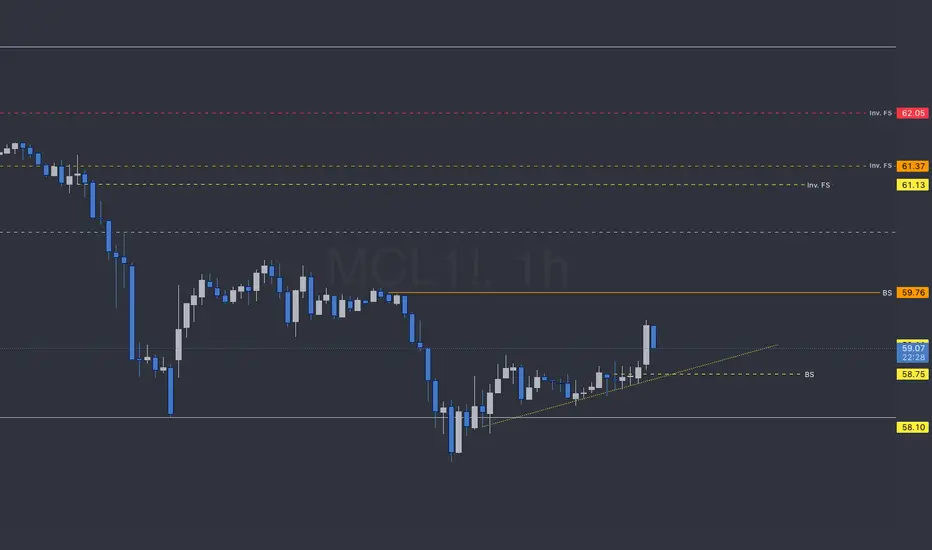
MCLJust an hourly chart with levels from above this timeframe.
year = black
pink = month
red= day
4hr = orange
1hr = yellow
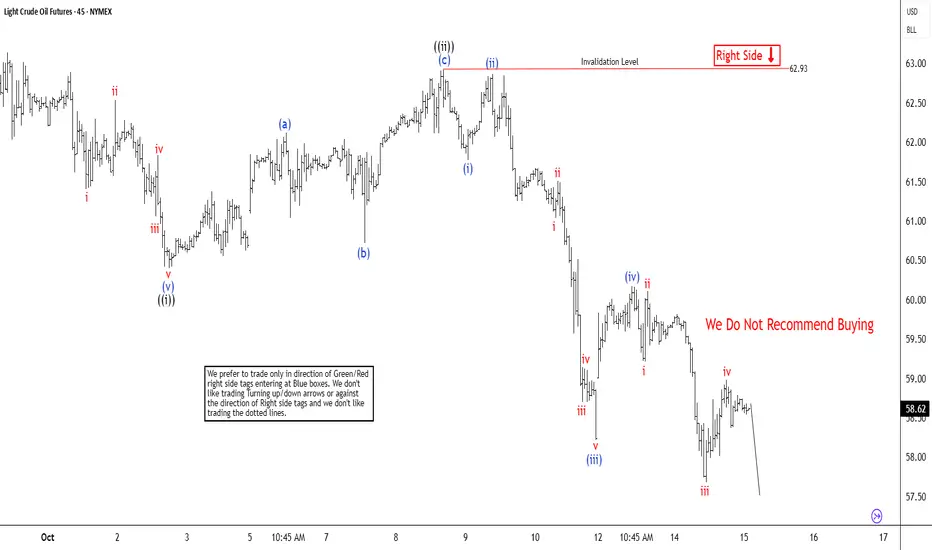
Light Crude Oil (CL) Weakness Expected to PersistThe short-term Elliott Wave analysis for oil indicates that a decline from the September 26, 2025, high is unfolding as a five-wave impulse. Starting from that peak, wave ((i)) concluded at $60.40, as depicted on the 45-minute chart. Subsequently, wave ((ii)) rallied in a zigzag Elliott Wave pattern. From the low of wave ((i)), wave (a) reached $62.12, followed by a pullback in wave (b) to $60.72. The upward move in wave (c) peaked at $62.93, completing wave ((ii)) at a higher degree.
Oil then continued its descent in wave ((iii)), structured as an impulsive sequence. From the wave ((ii)) high, wave (i) dropped to $61.78, and wave (ii) corrected to $62.87. Wave (iii) extended lower to $58.22, with a bounce in wave (iv) reaching $60.17. In the near term, as long as the pivot at $62.93 holds, any rally is expected to falter in a 3, 7, or 11-swing pattern, leading to further declines. The potential downside target lies between $53.2 and $56.9, based on the 100% to 161.8% Fibonacci extension of wave ((i)). This analysis suggests continued bearish momentum, with limited upside potential unless the key pivot is breached.
Oil Finally Breaks the Range — Downside Momentum EmergingAfter weeks of sideways, messy price action where most traders got chopped up, CL has finally chosen a direction. During that entire range-bound phase, we stayed on the sidelines and focused on cleaner markets instead — waiting patiently for this exact moment of clarity.
Now price has broken below the range lows with the 5/10/20 EMAs stacked cleanly beneath the 50 EMA, confirming downside momentum and the start of a new expansion phase. For the first time in weeks, structure is aligned and directional — no more fakeouts, no more noise.
This is the kind of clean context where money is made, not lost. The plan now is simple: wait for a lower-high pullback into the EMA stack and look for continuation setups if structure holds.
Questions for discussion:
– Did you avoid trading this chop or get caught inside it?
– Are you seeing similar clean shifts forming in other markets right now?
– Do you prefer to sit out until context like this forms, or trade through the noise?

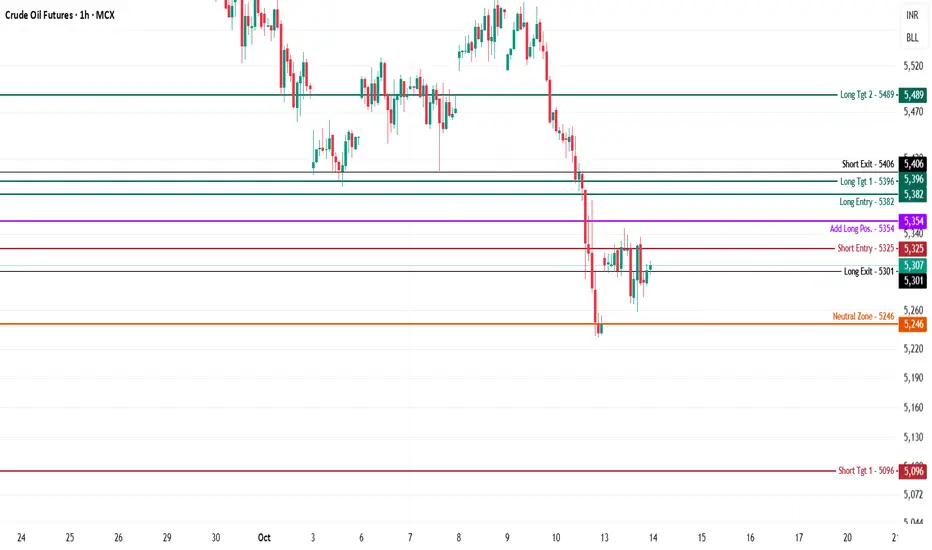
Crude Oil - Intraday Technical Analysis - 14th Oct., 2025 $MCX:CRUDEOIL
Crude Oil is trading at 5,307, consolidating after a steep fall and holding just above the neutral zone (5,246). Price is compressing between intraday supply and demand.
Bearish Scenario
Short Entry (5,325): Shorts become actionable below 5,325, especially if the price fails to reclaim 5,354 (add long zone) and loses momentum.
Downside Targets:
5,096 (Target 1): First mapped support for covering shorts.
5,003 (Target 2): Additional extension if selling accelerates.
Stop Loss: Hold shorts only if price remains below 5,301 (long exit); cover if it bounces above 5,354.
Bullish Scenario
Long Entry (5,382): Fresh longs trigger above 5,382, with additional conviction if price sustains over 5,396 (short exit).
Upside Targets:
5,489 (Target 1): Key resistance and logical profit booking area.
Stop Loss: Use 5,354 or 5,325 for active risk control.
Neutral/Range Logic
Neutral Zone (5,246):
If price continues to oscillate in this band, expect a choppy range until a directional breakout confirms the trend.
Watch for decisive moves out of the compression zone to activate either bullish or bearish plans.
If these levels help your trading, please boost, comment, and share. Follow for more daily key levels and actionable market logic!
Reach out in the comments—no hassle, just honest learning and open sharing. Your engagement drives this effort for all active viewers!
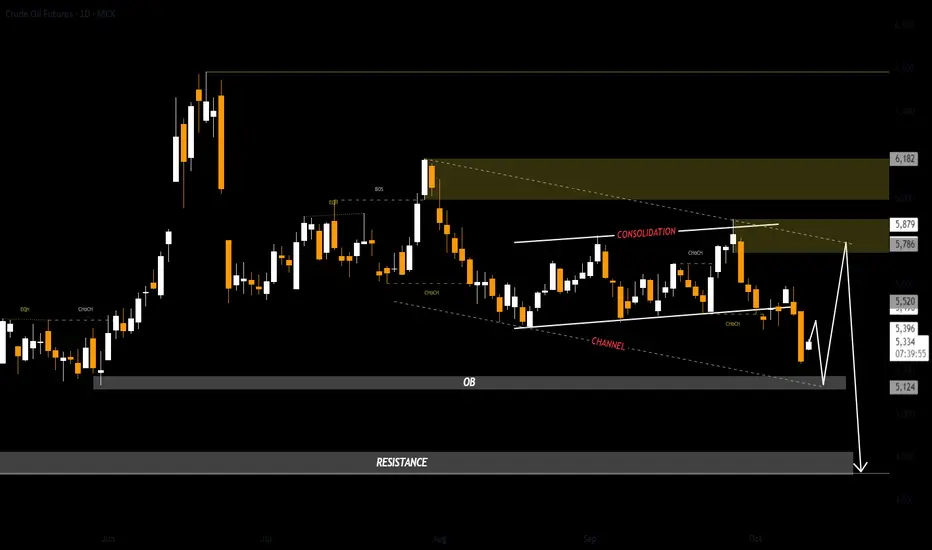
US OilCrude Oil
- Consolidation Phase
- Break of Structure
- Bearish Channel as an corrective pattern in Short Time Frame
- Order Block
- Resistance Level
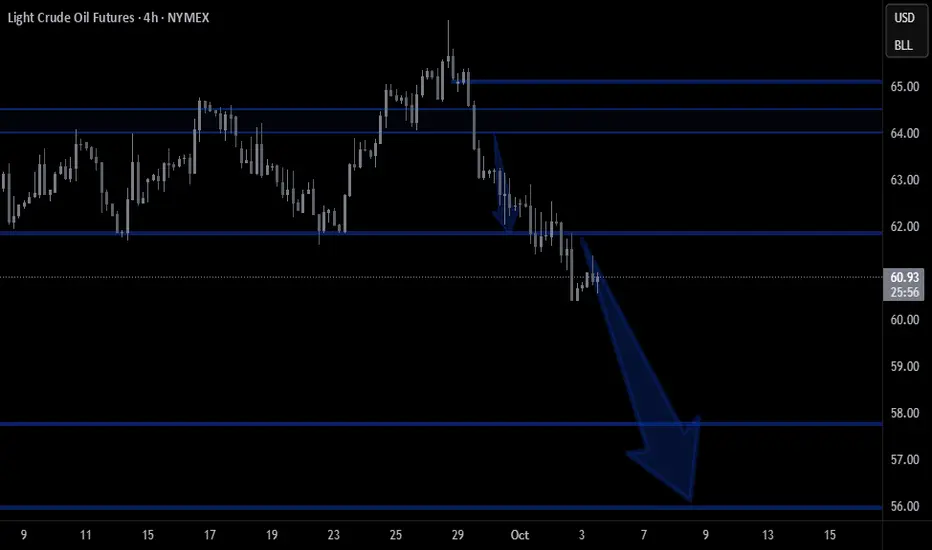
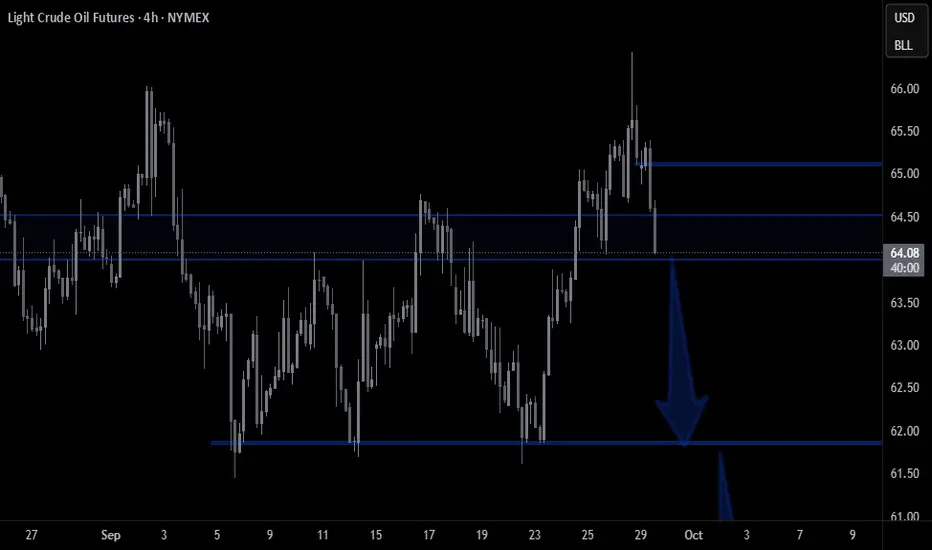
Lower Highs Signal Weakness: Crude Oil Bears Eye $61 Support
The recent attempt to rally stalled around $65–66, failing to break above the mid-Bollinger band resistance.
Multiple long upper wicks show selling pressure on rallies.
Price is moving closer to the lower band after failing to hold above the middle band.
The market shows weak upside momentum and dominant selling pressure.
As long as price stays below $65.50, bears maintain control.
If $61.00 support breaks, downside targets are $59.00, then $57.00.

Crude Oil price breakout.Looking for Crude to break downward trend. Strong demand around the $61 level. Price action confirming. Looking for entry after break and price action confirmation.

MCX Crude Oil Futures – Intraday Analysis 7th Oct., 25MCX:CRUDEOIL1!
Crude Oil is trading at 5,489 after a choppy, range-bound session, with price action coiling near both the long entry (5,494) and neutral zone (5,491) pivots—signaling a breakout or breakdown is due.
Bullish Scenario
Long Entry (5,494):
Initiate fresh longs above 5,494 as intraday swing highs get taken out, backing a push toward higher resistance.
Add more above 5,483 if dips are bought and the trend stays intact, confirming a base.
Upside Targets:
5,549 (Target 1): First mapped resistance and supply for partial profit booking.
5,585 (Target 2): Further extension zone if strong momentum develops.
Stop Loss:
Use just below 5,472 (short entry), or progressively trail as price advances for risk control.
Bearish Scenario
Short Entry (5,472):
Shorts are viable below 5,472, marking breakdown of support and the likelihood of a move back toward recent lows.
Downside Targets:
5,433 (Target 1): Bounce/support area and first logical exit for shorts.
5,397 (Target 2): Next mapped extension if heavy selloff appears.
Stop Loss:
Cover shorts if price retakes 5,494 to avoid whipsaws.
Structure & Neutral Logic
Neutral Zone (5,491):
Choppy, indecisive trading around this level—wait for a decisive move above 5,494 or below 5,472 for directional setups.
As long as price oscillates this band, expect more sideways action.

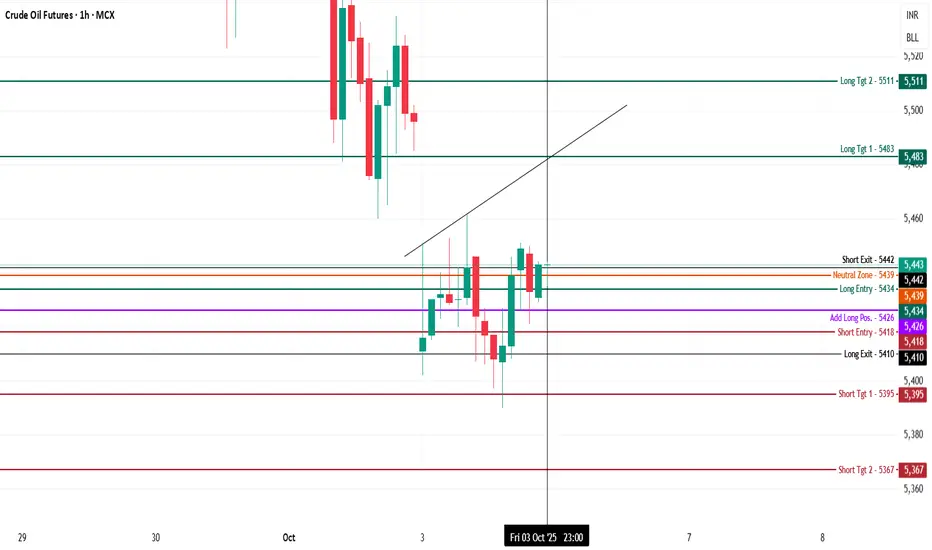
Crude Oil Futures (MCX) – Intraday Analysis - 6th Oct., 2025MCX:CRUDEOIL1!
Crude Oil is trading at 5,443 in a tight consolidation zone, oscillating between short-term support and resistance, with a neutral-to-slightly-bullish bias near the session high.
Bullish (Long) Setup
Long Entry (5,434):
Long positions can be initiated above 5,434 as the price consistently finds support here, creating a higher-low base.
Aggressive adds may be considered on strength above 5,426 (add-long band) if dips are supported with volume.
Upside Targets:
5,483 (Target 1): Key supply band and local swing high, where initial profit-booking is logical.
5,511 (Target 2): Extended target if momentum continues.
Stop Loss:
Keep stops just below 5,418, the immediate short entry zone, to guard against false breakouts.
Bearish (Short) Setup
Short Entry (5,418):
Short below 5,418, confirming breakdown of intraday support and flip toward sellers.
Downside Targets:
5,395 (Target 1): Major historical support and bounce area.
5,367 (Target 2): Deeper extension for continued weakness.
Stop Loss:
Cover shorts if price holds above 5,434, reducing exposure on failed break downs.
Neutral/Range Logic
Neutral Zone (5,439):
Acting as a pivot; price compressing here may result in whipsaw until a clear range breakout.
Wait for price acceptance above 5,443 or below 5,418 for trend alignment.
CRUDE OILPreferably suitable for scalping and accurate as long as you watch carefully the price action with the drawn areas.
With your likes and comments, you give me enough energy to provide the best analysis on an ongoing basis.
And if you needed any analysis that was not on the page, you can ask me with a comment or a personal message.
Enjoy Trading ;)

CL oil & Inflation are cooling-off towards $55!1). Corrective wave 4 is likely over! 2). MACD is divergent, as price inches up 3). Retail candle is an indecisive spinning top. 4). Overall correction needs a wave 5 south. 5). Volume is dropping. 6). Oil is an Inflation barometer, which is dropping. 7).I've been analyzing charts for over 20 yrs. as my strategies "trend" to be very accurate! A lot of effort goes into this, so please consider a "Boost".

61.74This channel is not providing individualized trading or investment advice, nor is it a banking service, brokerage service, trading service, investment service or money management service

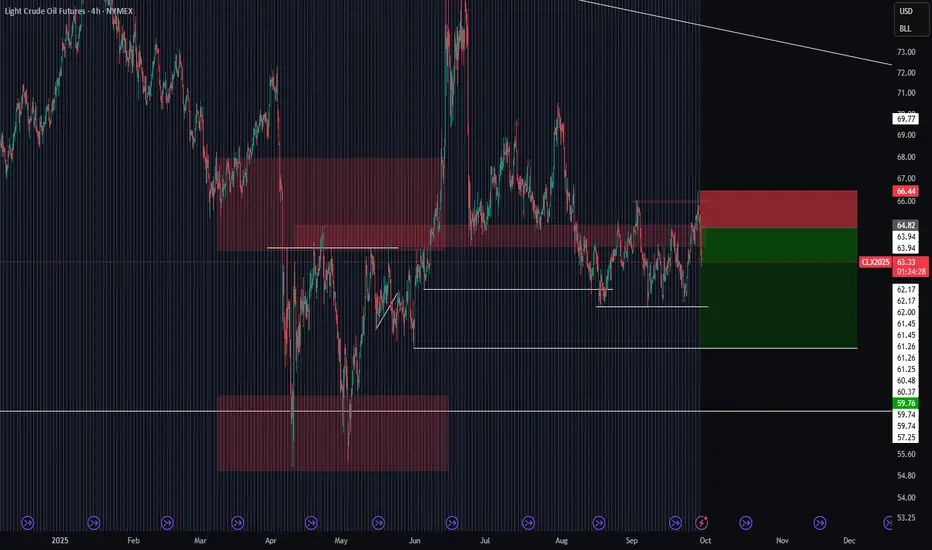
Oil Playing Twister: Triple Bottom or Quadruple Pretzel?A Triple Bottom Walks Into a Bar…
Crude Oil (CL) has been busy doing something traders love and hate at the same time: building bottoms. First, it carved a neat Triple Bottom on the daily chart — textbook stuff. Everyone lined up at 66.68 waiting for the breakout champagne to pop.
But what did price do? Instead of exploding higher, it slammed on the brakes and took a detour straight back to support. Typical CL — always keeping traders on their toes.
Now we’re staring at the possibility of a Quadruple Bottom. Not a typo. Yes, they exist, but you don’t see them every day. Like spotting a unicorn in Times Square.
Why We Care About 66.68
That level isn’t just random. It’s the line where:
The Triple Bottom neckline lives.
The Supertrend upper band hangs out.
And, conveniently, the breakeven of our options spread sits.
In other words: get above 66.68 and suddenly this setup has wings. Target? Around 70.63, where UFO resistance is waiting to greet us.
The Fun Part: Bull Call Spread
Instead of swinging a giant futures bat and risking unlimited pain, we play it smarter with a Bull Call Spread:
Buy the 65 Call (Nov-17)
Sell the 71 Call (Nov-17)
Pay about 1.75 points (≈ $1,750 per standard spread, ≈ $175 if you go micro).
That’s it. Risk capped, reward mapped. Max loss? $1,750. Max gain? $4,250.
And yes, the breakeven is… drumroll… 66.8. Same line as the chart breakout. Love when math and pictures line up.
Plot Twist: Cheaper Now, But…
Here’s the kicker: because price dipped back into support, the spread might actually be cheaper right now. Sounds good, right?
But there’s a catch. Waiting for the breakout confirmation could make the spread pricier later, shrinking your reward-to-risk. Classic trading dilemma: do you want cheaper tickets with less confirmation, or more expensive tickets after the bouncer checks your ID?
Risk in 3 Sentences
Keep your trade size sane.
Don’t marry the setup if price dumps below the bottoms.
If CL rushes toward 70, take the money and run (or at least roll the short strike higher).
Bottom Line
Crude Oil is still building its base. Maybe it’s a Triple Bottom. Maybe it becomes the rare Quadruple Bottom collectors dream about. Either way, the play is the same: breakout above 66.68, aim for 70.63, and do it with a defined-risk Bull Call Spread that doesn’t keep you up at night.
Sometimes the market is dramatic. That’s why we trade it. 🎭
Want More Depth?
If you’d like to go deeper into the building blocks of trading, check out our From Mystery to Mastery trilogy, three cornerstone articles that complement this one:
🔗 From Mystery to Mastery: Trading Essentials
🔗 From Mystery to Mastery: Futures Explained
🔗 From Mystery to Mastery: Options Explained
When charting futures, the data provided could be delayed. Traders working with the ticker symbols discussed in this idea may prefer to use CME Group real-time data plan on TradingView: www.tradingview.com - This consideration is particularly important for shorter-term traders, whereas it may be less critical for those focused on longer-term trading strategies.
General Disclaimer:
The trade ideas presented herein are solely for illustrative purposes forming a part of a case study intended to demonstrate key principles in risk management within the context of the specific market scenarios discussed. These ideas are not to be interpreted as investment recommendations or financial advice. They do not endorse or promote any specific trading strategies, financial products, or services. The information provided is based on data believed to be reliable; however, its accuracy or completeness cannot be guaranteed. Trading in financial markets involves risks, including the potential loss of principal. Each individual should conduct their own research and consult with professional financial advisors before making any investment decisions. The author or publisher of this content bears no responsibility for any actions taken based on the information provided or for any resultant financial or other losses.

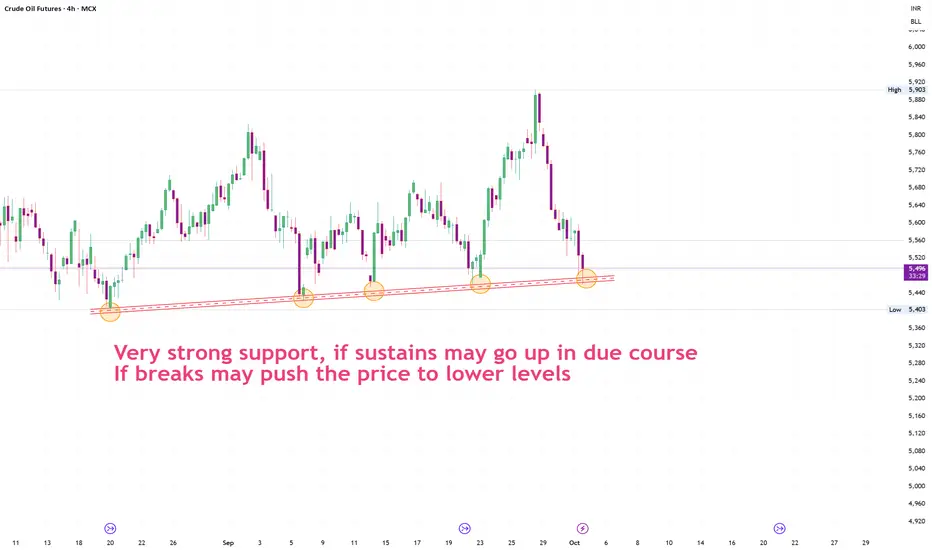
CureOil at support levelCrudeoil price depends on global scenario , as we see crudeoil is at Very strong support,
1. if sustains above the support may go up in due course
2. If breaks may push the price to lower levels
CRUDE OILPreferably suitable for scalping and accurate as long as you watch carefully the price action with the drawn areas.
With your likes and comments, you give me enough energy to provide the best analysis on an ongoing basis.
And if you needed any analysis that was not on the page, you can ask me with a comment or a personal message.
Enjoy Trading ;)

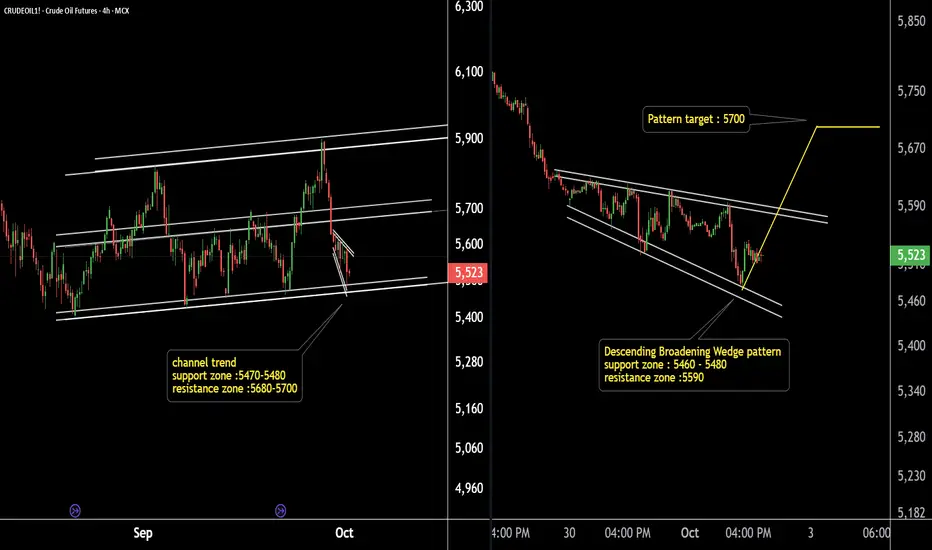
Crude Oil Ready to Explode ? Watch This Key Support Pattern!Crude Oil (4H & 15Min Chart) Analysis:
Crude Oil is moving within a well-defined parallel channel on the 4-hour timeframe, with a strong support zone at 5480–5490.
On the 15-minute chart, a descending broadening wedge is forming, with the pattern support zone also near 5480–5490 and pattern resistance around 5600.
Potential breakout target: 5700.
If the support zone holds, we may see higher prices in Crude Oil.
Summary: Key support at 5480–5490 is critical. Watch for a breakout above 5600 for a potential upside move toward 5700.
Thank you !!
OILPreferably suitable for scalping and accurate as long as you watch carefully the price action with the drawn areas.
With your likes and comments, you give me enough energy to provide the best analysis on an ongoing basis.
And if you needed any analysis that was not on the page, you can ask me with a comment or a personal message.
Enjoy Trading ;)
Light Crude Oil (CL) Elliott Wave Outlook Points to Lower PricesThe short-term Elliott Wave structure in crude oil indicates a downward cycle from the June 23, 2025, high, unfolding as a five-wave impulse. Wave 1 concluded at $61.45, and wave 2 rallied to $66.42, as shown on the 1-hour chart. Wave 2 developed as a regular flat structure. From wave 1’s low, wave ((a)) peaked at $64.76. Wave ((b)) fell to $61.85, and wave ((c)) advanced to $66.42, finalizing wave 2.
Oil now declines in wave 3, structured as an impulse. From wave 2’s high, wave (i) reached $64.87, and wave (ii) corrected to $65.40. Wave (iii) dropped to $62.98, followed by wave (iv) at $63.50. Oil should extend lower in wave (v) to complete wave ((i)) of 3. Afterward, a wave ((ii)) rally will likely adjust the decline from the September 26, 2025, high in a 3, 7, or 11-swing pattern before resuming downward. As long as the $66.42 pivot high remains intact, near-term rallies are expected to fail in a 3, 7, or 11-swing sequence, leading to further declines. This structure suggests oil faces continued bearish pressure in the short term, with limited upside potential unless the pivot breaks.

[CL] USOIL Trade ideaI can even see a target much lower but fondamentally for now I am not sure it will be reasonable ... let's adapt to the market conditions.
Great Trade !
Gold oil9 29 September it occurred to me that I probably should have talked about silver and there were markets that I have posted that are actually doing well and some are not... But since gold was making another new high... I will put out another video later this week.

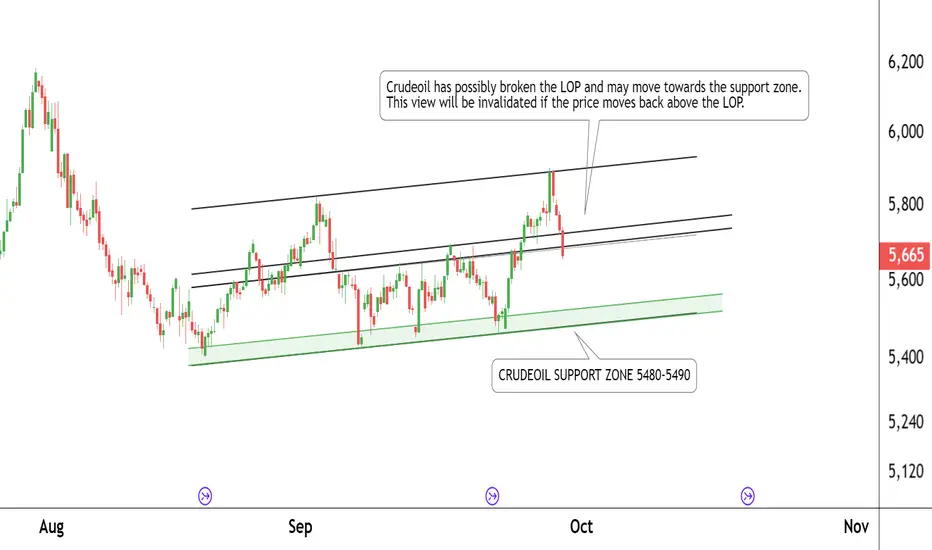
Crude Oil Breakdown – Short Trade ViewThis is the 4-hour timeframe chart of Crude Oil.
Crude Oil has broken the LOP support zone around 5700–5720.
The next key support zone is placed around 5480–5490.
The previous LOP zone may now act as a resistance.
If this resistance holds, Crude Oil prices may continue to move lower.
Thank You!!