crudeoil probable price movements crudeoil is at key levels.
1. if rejected from the levels may test lower levels
2. if crosses above may touch upper levels
Contract highlights
Related commodities

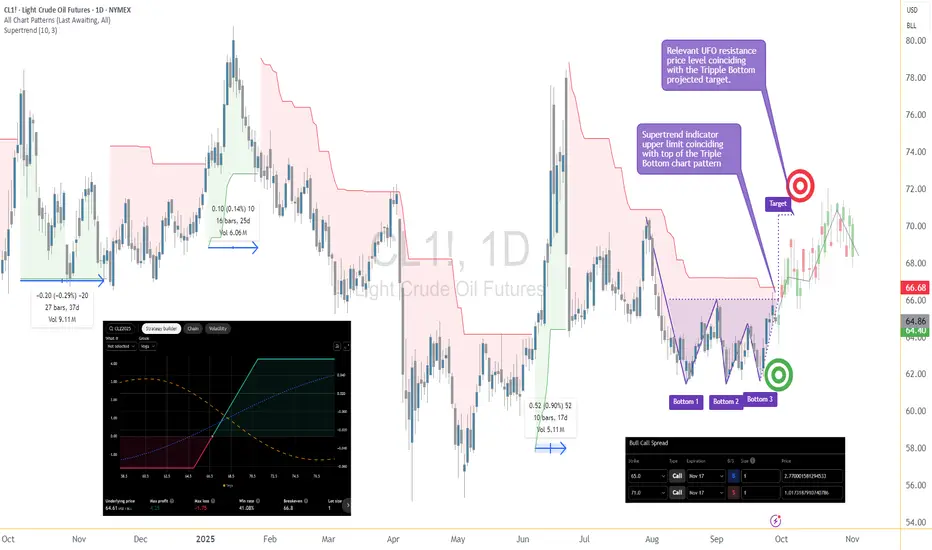
Oil Playing Twister: Triple Bottom or Quadruple Pretzel?A Triple Bottom Walks Into a Bar…
Crude Oil (CL) has been busy doing something traders love and hate at the same time: building bottoms. First, it carved a neat Triple Bottom on the daily chart — textbook stuff. Everyone lined up at 66.68 waiting for the breakout champagne to pop.
But what did pr

CL oil & Inflation are cooling-off towards $55!1). Corrective wave 4 is likely over! 2). MACD is divergent, as price inches up 3). Retail candle is an indecisive spinning top. 4). Overall correction needs a wave 5 south. 5). Volume is dropping. 6). Oil is an Inflation barometer, which is dropping. 7).I've been analyzing charts for over 20 yrs. a

Options Blueprint Series [Basic]: Risk-Defined Bull Spread on CLIntroduction
Crude Oil has been carving out a compelling structure on the daily timeframe. The chart has formed a Triple Bottom pattern, a classic base-building formation that often precedes significant directional moves. As prices approach a critical resistance area, traders are watching closely
Gold oil9 29 September it occurred to me that I probably should have talked about silver and there were markets that I have posted that are actually doing well and some are not... But since gold was making another new high... I will put out another video later this week.

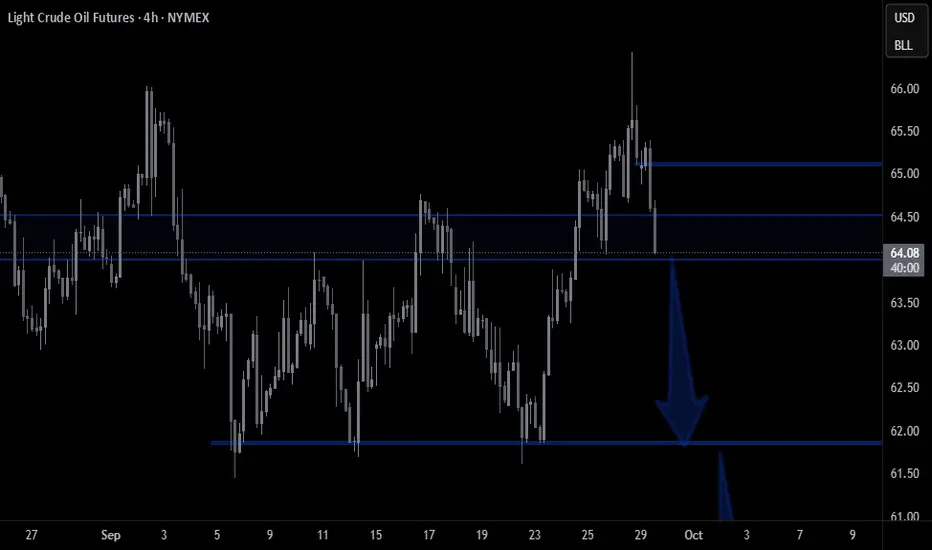
OILPreferably suitable for scalping and accurate as long as you watch carefully the price action with the drawn areas.
With your likes and comments, you give me enough energy to provide the best analysis on an ongoing basis.
And if you needed any analysis that was not on the page, you can ask me with a
Crudeoil Probable price levelsCrudeoil price tested 5400 -5450 levels many times.
1. if buyers couldnt support the level then the pirce moves down.
2. if buyers defend the position then the price moves up.
CRUDE OILPreferably suitable for scalping and accurate as long as you watch carefully the price action with the drawn areas.
With your likes and comments, you give me enough energy to provide the best analysis on an ongoing basis.
And if you needed any analysis that was not on the page, you can ask me with a

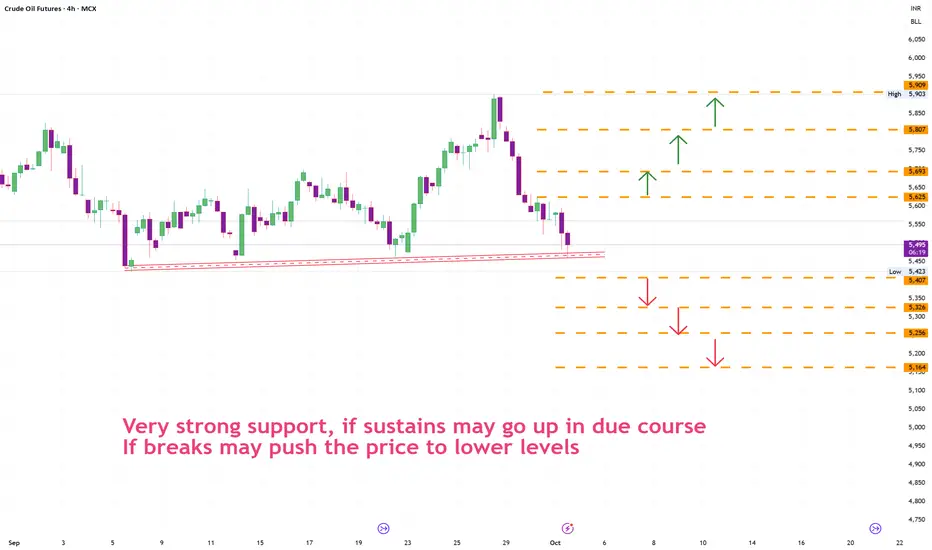
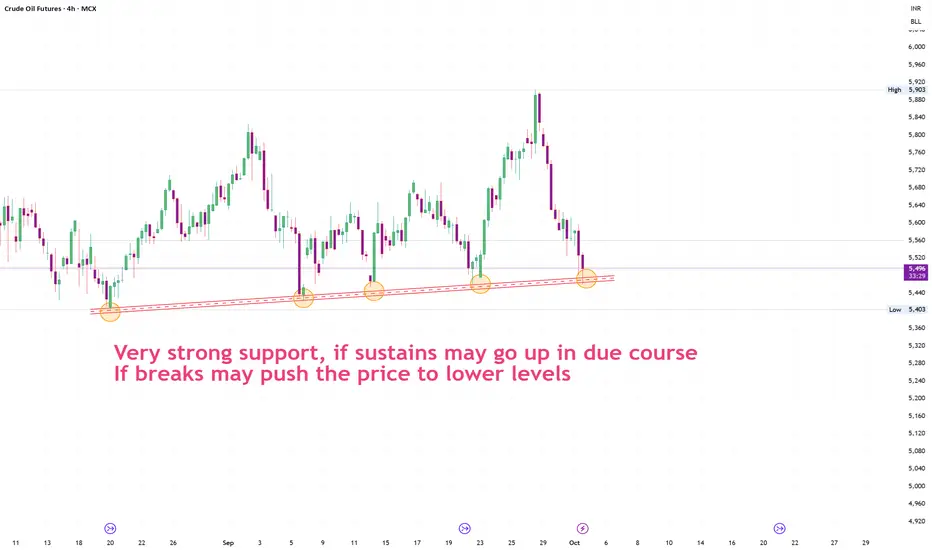
CureOil at support levelCrudeoil price depends on global scenario , as we see crudeoil is at Very strong support,
1. if sustains above the support may go up in due course
2. If breaks may push the price to lower levels
See all ideas
Summarizing what the indicators are suggesting.
Neutral
SellBuy
Strong sellStrong buy
Strong sellSellNeutralBuyStrong buy
Neutral
SellBuy
Strong sellStrong buy
Strong sellSellNeutralBuyStrong buy
Neutral
SellBuy
Strong sellStrong buy
Strong sellSellNeutralBuyStrong buy
A representation of what an asset is worth today and what the market thinks it will be worth in the future.
Displays a symbol's price movements over previous years to identify recurring trends.
Frequently Asked Questions
The current price of Crude Oil Futures (Feb 2029) is 62.21 USD / BLL — it has risen 0.05% in the past 24 hours. Watch Crude Oil Futures (Feb 2029) price in more detail on the chart.
Track more important stats on the Crude Oil Futures (Feb 2029) chart.
The nearest expiration date for Crude Oil Futures (Feb 2029) is Jan 22, 2029.
Traders prefer to sell futures contracts when they've already made money on the investment, but still have plenty of time left before the expiration date. Thus, many consider it a good option to sell Crude Oil Futures (Feb 2029) before Jan 22, 2029.
Open interest is the number of contracts held by traders in active positions — they're not closed or expired. For Crude Oil Futures (Feb 2029) this number is 750.00. You can use it to track a prevailing market trend and adjust your own strategy: declining open interest for Crude Oil Futures (Feb 2029) shows that traders are closing their positions, which means a weakening trend.
Buying or selling futures contracts depends on many factors: season, underlying commodity, your own trading strategy. So mostly it's up to you, but if you look for some certain calculations to take into account, you can study technical analysis for Crude Oil Futures (Feb 2029). Today its technical rating is strong sell, but remember that market conditions change all the time, so it's always crucial to do your own research. See more of Crude Oil Futures (Feb 2029) technicals for a more comprehensive analysis.