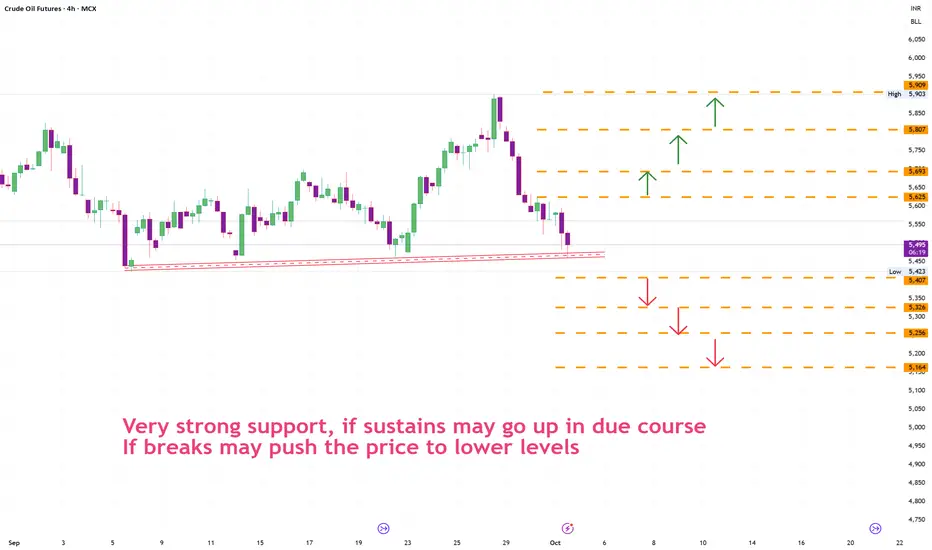
Crudeoil Probable price levelsCrudeoil price tested 5400 -5450 levels many times.
1. if buyers couldnt support the level then the pirce moves down.
2. if buyers defend the position then the price moves up.
Contract highlights
Related commodities
CRUDE OILPreferably suitable for scalping and accurate as long as you watch carefully the price action with the drawn areas.
With your likes and comments, you give me enough energy to provide the best analysis on an ongoing basis.
And if you needed any analysis that was not on the page, you can ask me with a
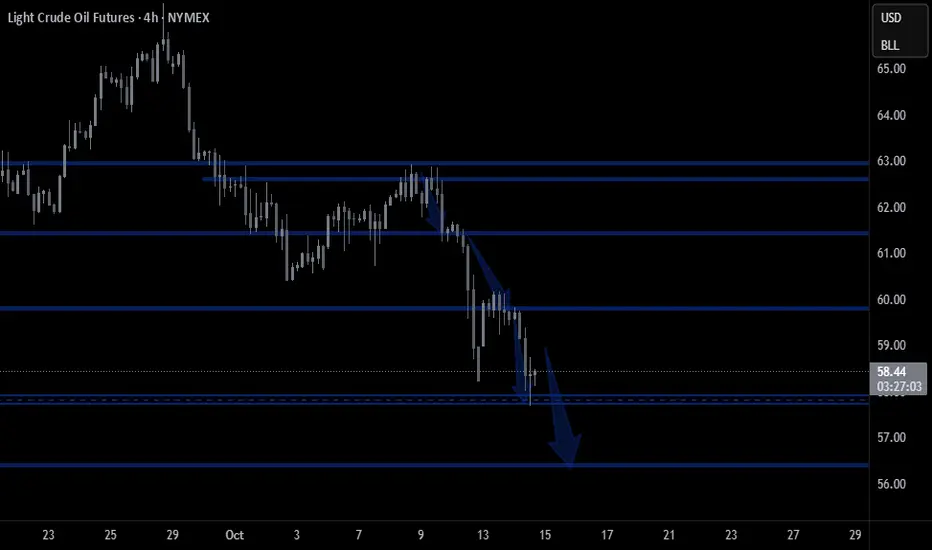
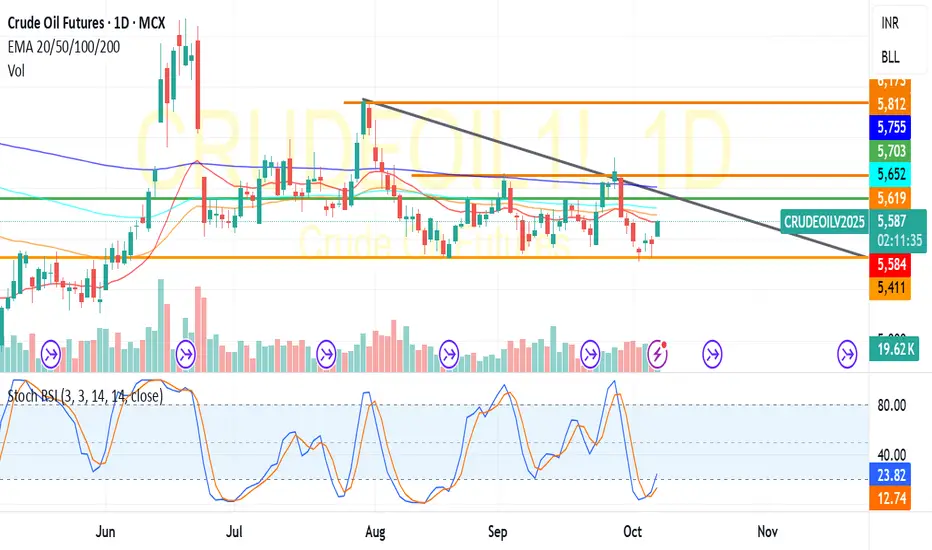
In daily time frame formed head shoulder pattern it seems to be In daily time frame formed H&S pattern confirmed. It seems to be downtrend
Target of head to neck line measurement

CRUDE OILPreferably suitable for scalping and accurate as long as you watch carefully the price action with the drawn areas.
With your likes and comments, you give me enough energy to provide the best analysis on an ongoing basis.
And if you needed any analysis that was not on the page, you can ask me with a
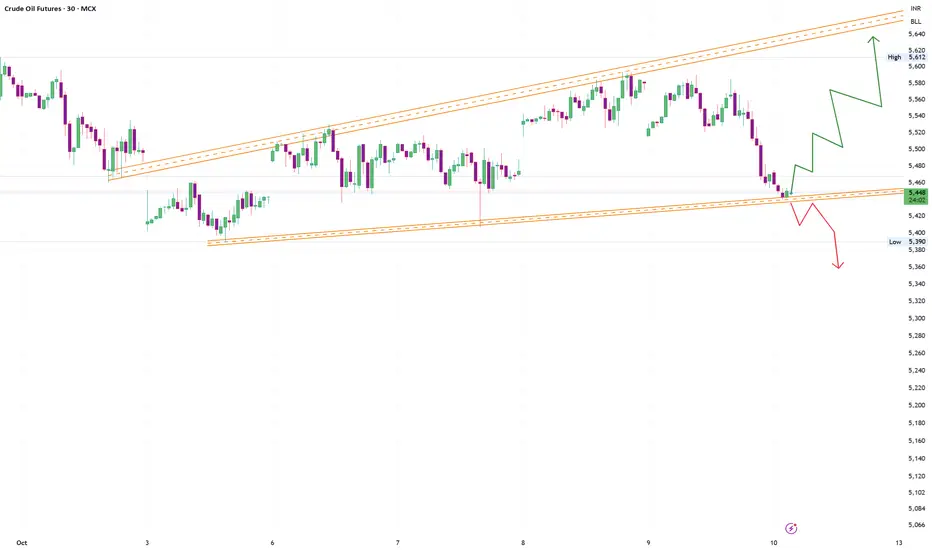
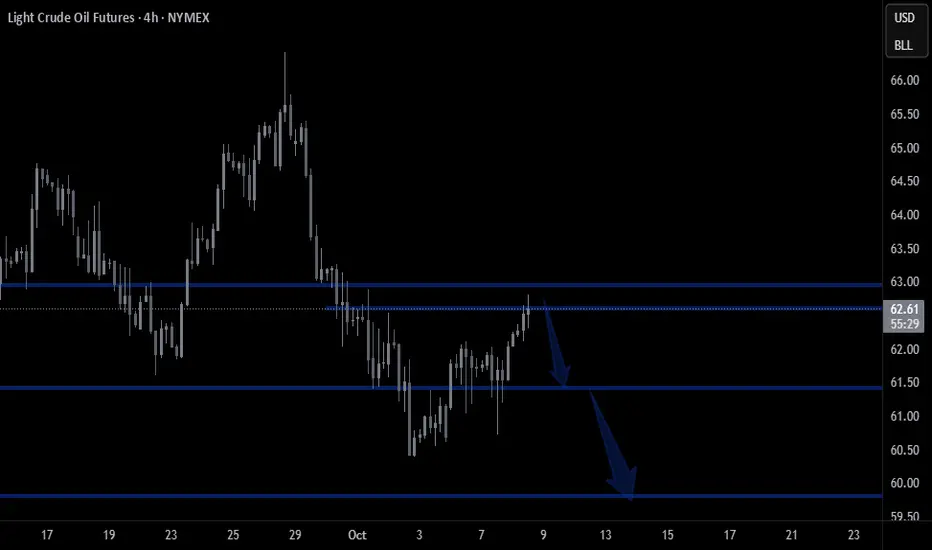
Crudeoil probable price projection1. if takes support may push the price up
2. if breaks it may push the price to lower side
CRUDE OILPreferably suitable for scalping and accurate as long as you watch carefully the price action with the drawn areas.
With your likes and comments, you give me enough energy to provide the best analysis on an ongoing basis.
And if you needed any analysis that was not on the page, you can ask me with a
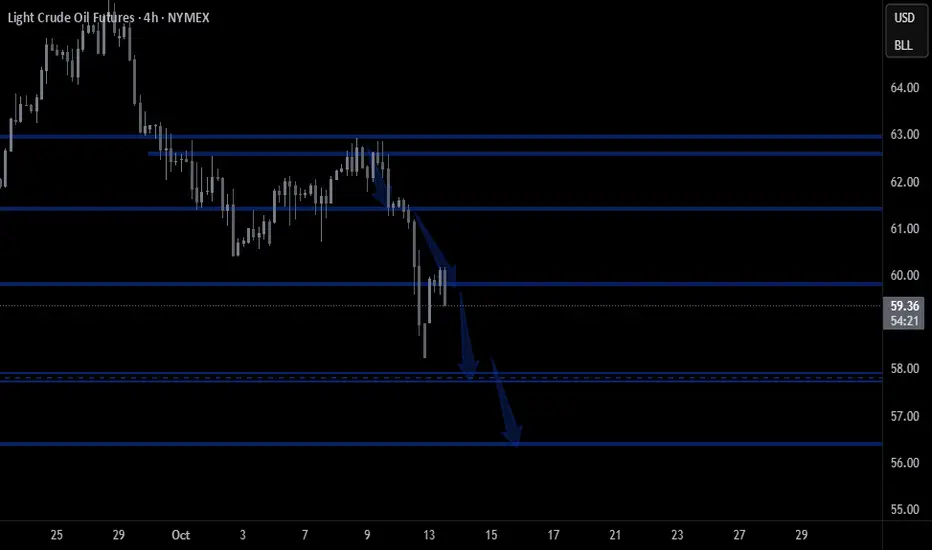
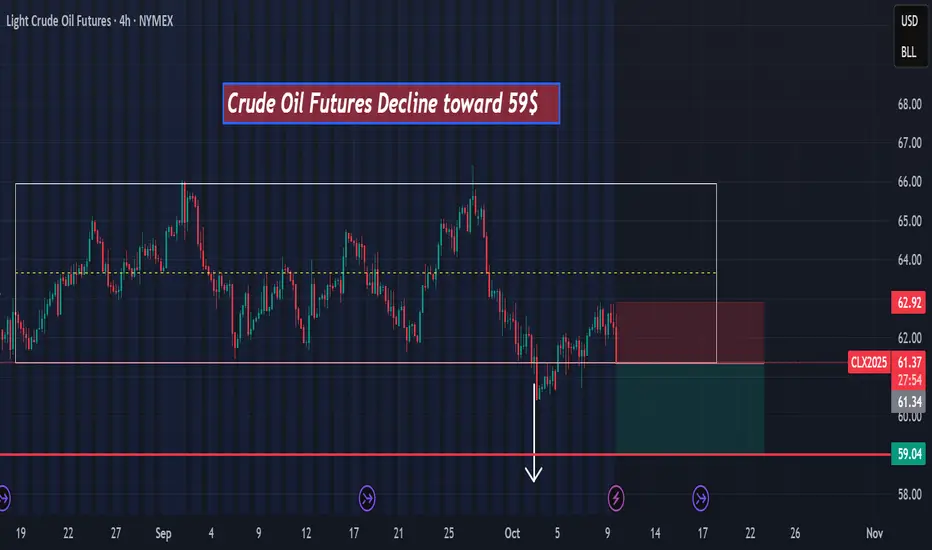
Crude oil decline toward 59$hello,
According to my technical analysis, there is a high probability of a decline toward $59 in the next few hours,
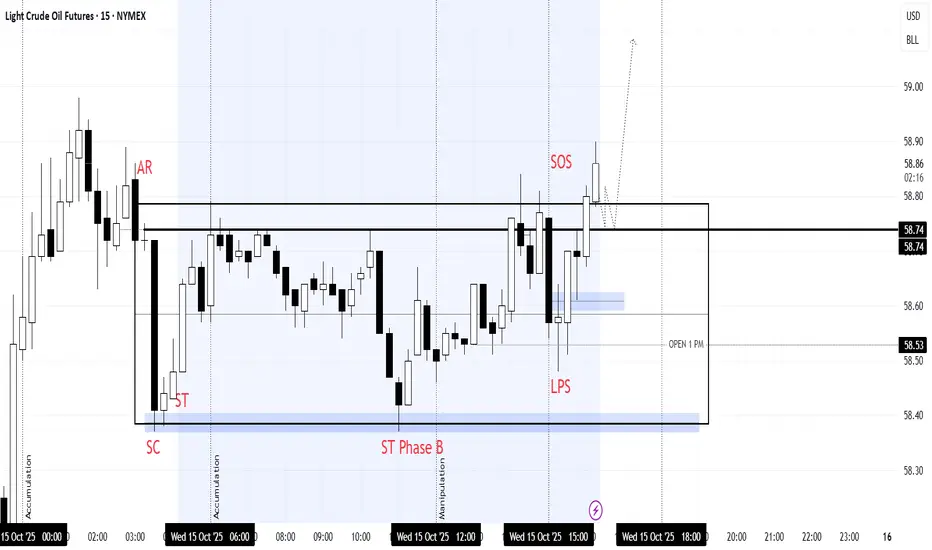
OIL WYCKOFF PHASEPhase A – Stopping the Downtrend
SC (Selling Climax): Heavy selling pressure absorbed by strong hands.
AR (Automatic Rally): First sign of demand entering the market.
ST (Secondary Test): Price revisits the lower range to confirm support.
Phase B – Building a Cause
Market continues ranging with
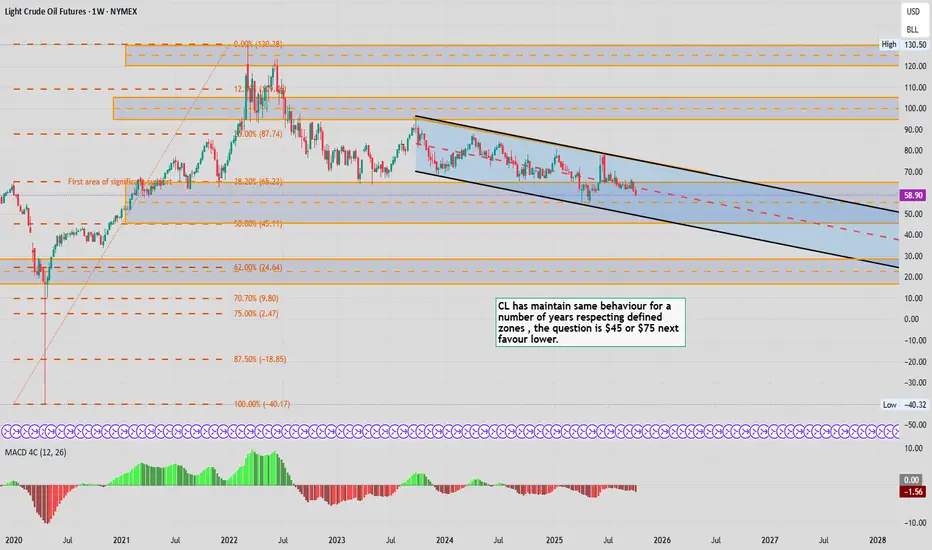
Updating Last months CL chart CL been behaving within defined ranges for the longest time and do not see anything changing just yet, and look like we willprobe lower in the short term
MCX CRUDE: Showing Traces of a bounce bk RallyMCX CRUDE: Trading at around 5600 has given Golden EMA Cross over in 30Min chart .
Major Resistance lies at 5700 -5800.
Close above 5800 likely to trigger a rally towards 6400 whereas 5400 likely to act as the crucial support.
Drifting below its 5400 likely to test 5100 its June ,2025.My bias is pos
See all ideas
Summarizing what the indicators are suggesting.
Neutral
SellBuy
Strong sellStrong buy
Strong sellSellNeutralBuyStrong buy
Neutral
SellBuy
Strong sellStrong buy
Strong sellSellNeutralBuyStrong buy
Neutral
SellBuy
Strong sellStrong buy
Strong sellSellNeutralBuyStrong buy
A representation of what an asset is worth today and what the market thinks it will be worth in the future.
Displays a symbol's price movements over previous years to identify recurring trends.
Frequently Asked Questions
The current price of Crude Oil Futures (Apr 2033) is 62.91 USD / BLL — it has fallen −0.02% in the past 24 hours. Watch Crude Oil Futures (Apr 2033) price in more detail on the chart.
Track more important stats on the Crude Oil Futures (Apr 2033) chart.
The nearest expiration date for Crude Oil Futures (Apr 2033) is Mar 22, 2033.
Traders prefer to sell futures contracts when they've already made money on the investment, but still have plenty of time left before the expiration date. Thus, many consider it a good option to sell Crude Oil Futures (Apr 2033) before Mar 22, 2033.
Open interest is the number of contracts held by traders in active positions — they're not closed or expired. For Crude Oil Futures (Apr 2033) this number is 0.00. You can use it to track a prevailing market trend and adjust your own strategy: declining open interest for Crude Oil Futures (Apr 2033) shows that traders are closing their positions, which means a weakening trend.
Buying or selling futures contracts depends on many factors: season, underlying commodity, your own trading strategy. So mostly it's up to you, but if you look for some certain calculations to take into account, you can study technical analysis for Crude Oil Futures (Apr 2033). Today its technical rating is sell, but remember that market conditions change all the time, so it's always crucial to do your own research. See more of Crude Oil Futures (Apr 2033) technicals for a more comprehensive analysis.