CRUDE OILPreferably suitable for scalping and accurate as long as you watch carefully the price action with the drawn areas.
With your likes and comments, you give me enough energy to provide the best analysis on an ongoing basis.
And if you needed any analysis that was not on the page, you can ask me with a
Related commodities
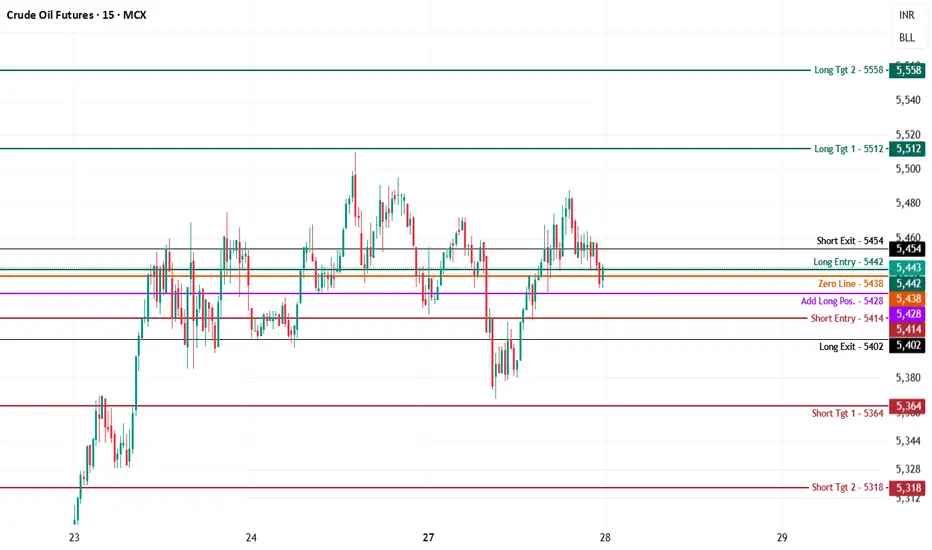
Crude Oil MCX Future Intraday Technical Analysis - 28th Oct., 25$MCX:CRUDEOIL — Chart Pathik Insights | 28-Oct-25
Crude Oil is holding steady at 5,443, consolidating at the long entry (5,442) while toggling just around the zero line of 5,438. After a session marked by quick retracements and fakeouts, strong hands are waiting for a conviction move from this tig
CRUDE OILPreferably suitable for scalping and accurate as long as you watch carefully the price action with the drawn areas.
With your likes and comments, you give me enough energy to provide the best analysis on an ongoing basis.
And if you needed any analysis that was not on the page, you can ask me with a

Oil bounced from POC. Sanctions aganst russia did't push it upOil bounced from POC. Sanctions aganst russia did't push it up
which is so good for down trend)
in a case of retest of POC - u can take short trade with goals $55 and $49

CRUDE OIL "3 Heads Monster"Could this 3 Heads & Shoulders come to live ?
Built in "Close Price Line Chart" (Candle = Same formation)
Small (black) H&S Target @ 59.34
Medium (orange) H&S Target @ 44.32
Large (blue) H&S Target @ 10.29

Crude Oil is InflationOne of the best ways to gauge where inflation is heading is by tracking the relationship between crude oil prices and the U.S. Consumer Price Index (CPI).
If we take a moment to observe their movement from the 1980s to today, we can see that they have generally moved in tandem. The year of their pe

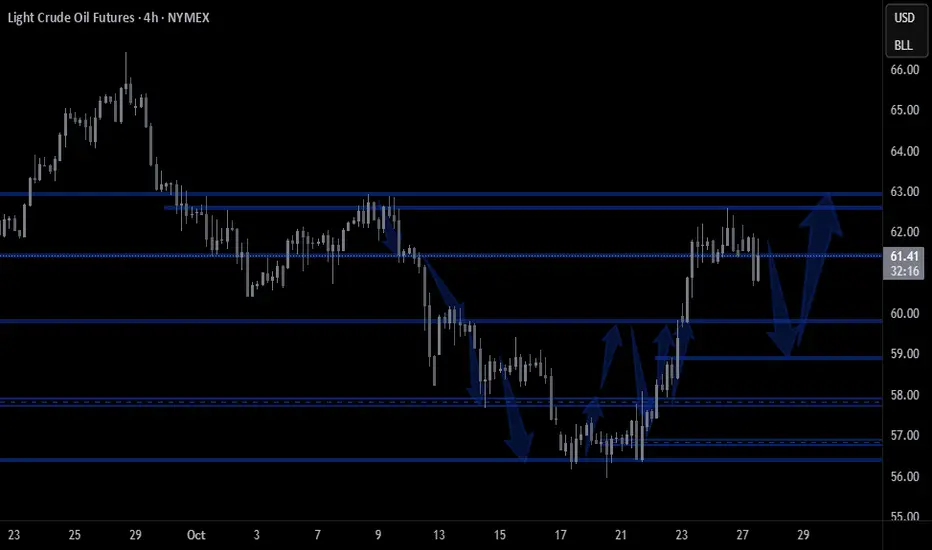
Sell crude oil around 62.00, with a target of 60.00-58.00Crude Oil Market Analysis:
Crude oil has been trending downwards with fluctuations recently. Our strategy remains to sell at higher prices; any rebound is an opportunity to sell. Today, watch for opportunities to sell around 62.00. Currently, the interest rate cut appears to be having an effective

Crude Oil November Contract Breakdown Setup – 5450 PE in PlayMCX Crude Oil – November Contract
CMP: ₹5398
Bearish view
Holding 5450 Put Option (Expiry: 17 Nov 2025)
Avg Price: ₹251.50
Target: ₹320 to ₹325
Target valid till 14 Nov 2025
Tracking price action closely. Will reassess if momentum fades or structure breaks.
#CrudeOilOptions #MCX #OptionsT
crude oil probable price movement1. price looks strong may go up
2. if price doesnt sustain higher levels may go down

CL Crude Oil Short Supply-DemandSee Chart For Details.
Mainly a technical edge with price inside Daily supply + resistance and we have confirmation on lower timeframes.
Technicals = bearish
Fundamentals = Mixed
Sentiment = Mixed
Overall Slight edge I would say roughly 25% chance of 5:1

See all ideas
Summarizing what the indicators are suggesting.
Neutral
SellBuy
Strong sellStrong buy
Strong sellSellNeutralBuyStrong buy
Neutral
SellBuy
Strong sellStrong buy
Strong sellSellNeutralBuyStrong buy
Neutral
SellBuy
Strong sellStrong buy
Strong sellSellNeutralBuyStrong buy
A representation of what an asset is worth today and what the market thinks it will be worth in the future.
Frequently Asked Questions
The current price of WTI Financial Futures (May 2029) is 62.09 USD — it has fallen −0.27% in the past 24 hours. Watch WTI Financial Futures (May 2029) price in more detail on the chart.
Track more important stats on the WTI Financial Futures (May 2029) chart.
The nearest expiration date for WTI Financial Futures (May 2029) is May 31, 2029.
Traders prefer to sell futures contracts when they've already made money on the investment, but still have plenty of time left before the expiration date. Thus, many consider it a good option to sell WTI Financial Futures (May 2029) before May 31, 2029.
Open interest is the number of contracts held by traders in active positions — they're not closed or expired. For WTI Financial Futures (May 2029) this number is 30.00. You can use it to track a prevailing market trend and adjust your own strategy: declining open interest for WTI Financial Futures (May 2029) shows that traders are closing their positions, which means a weakening trend.
Buying or selling futures contracts depends on many factors: season, underlying commodity, your own trading strategy. So mostly it's up to you, but if you look for some certain calculations to take into account, you can study technical analysis for WTI Financial Futures (May 2029). Today its technical rating is sell, but remember that market conditions change all the time, so it's always crucial to do your own research. See more of WTI Financial Futures (May 2029) technicals for a more comprehensive analysis.