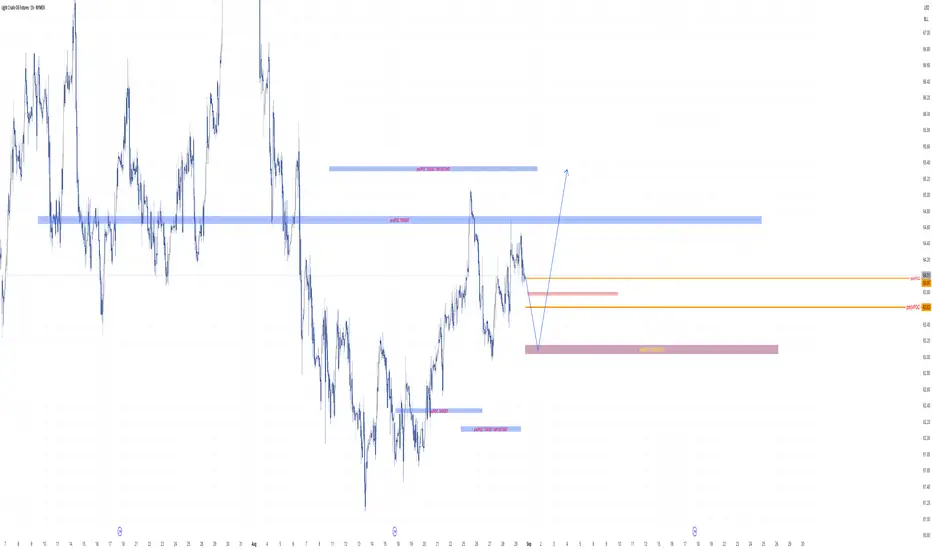
Bullish on Oil week 01-07/09 2025Will wait to see price reach and react from the previous month POC. That should be the play off the week. Bullish setups only. I the week starts going higher we should expect for this to reverse in the middle of the month.
Related commodities
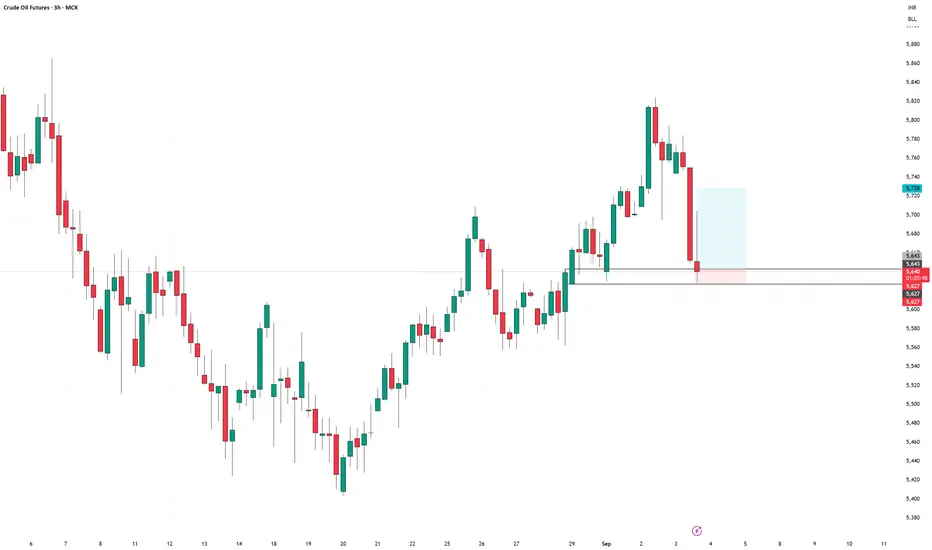
CRUDEOIL September Futures long setupCRUDEOIL September Futures long setup
Entry - 5643
Stop Loss - 5627
Target - 5728
Risk Reward - 1:5.3
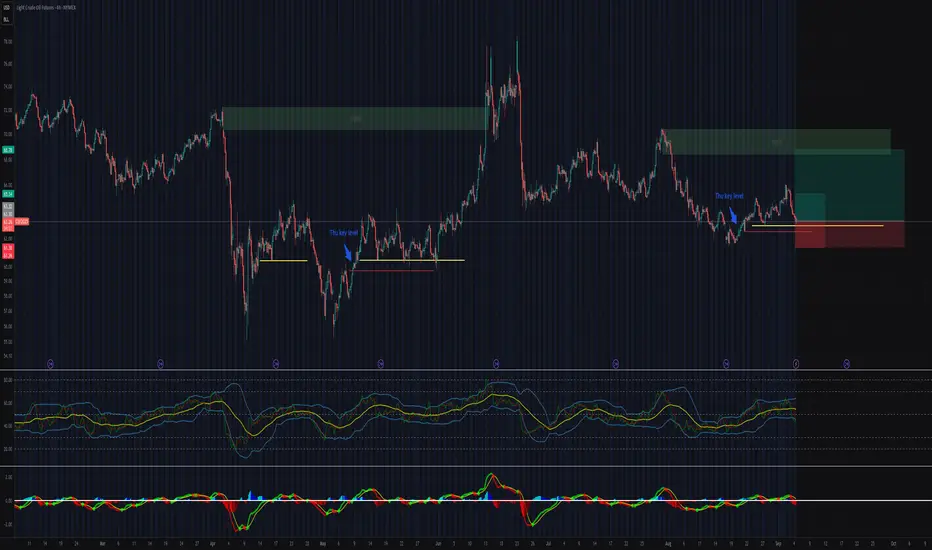
return to proven buyers presents trend continuation opportunity 1->3 : higher high , number 2 proven buyers
3->4 : reutrn to buyers
what do I think will happen next ?
* push above vpoc
* hidden bullish divergence
* obv support line predicting buying interest

CRUDE OILPreferably suitable for scalping and accurate as long as you watch carefully the price action with the drawn areas.
With your likes and comments, you give me enough energy to provide the best analysis on an ongoing basis.
And if you needed any analysis that was not on the page, you can ask me with a
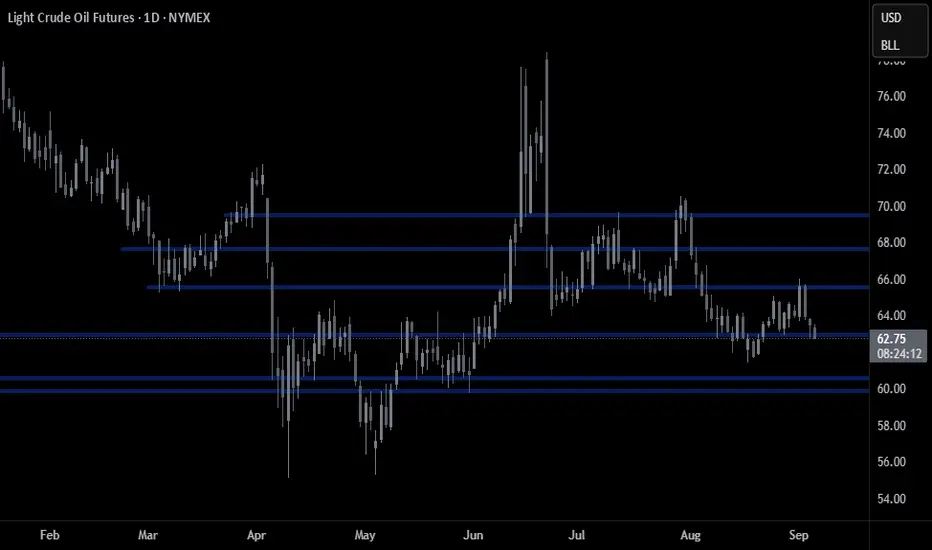
Oil Long Setup (A Setup)Oil is basically in a sideways price action following a predictable range. Overall, there isn't much momentum. However, considering the current sideways move, and taking into consideration key demand levels, it seems it has a high probability of a move to the upside to next supply zone.
I give this
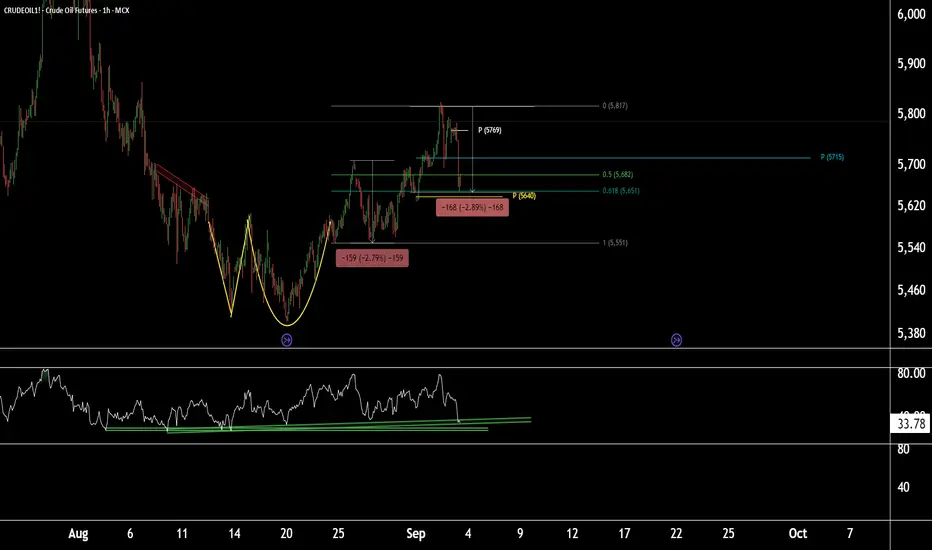
Price action + RSI support = fresh buy opportunity in CrudeOil1!CrudeOil1! (1-Hour Timeframe) Technical Outlook
CrudeOil1! is currently sustaining at the Fibonacci Golden Ratio level of 0.618, with the weekly pivot placed near 5640. Based on Fibonacci projections and price action, this 5640 zone appears to be a crucial area, as it aligns with a 2.8% retracement
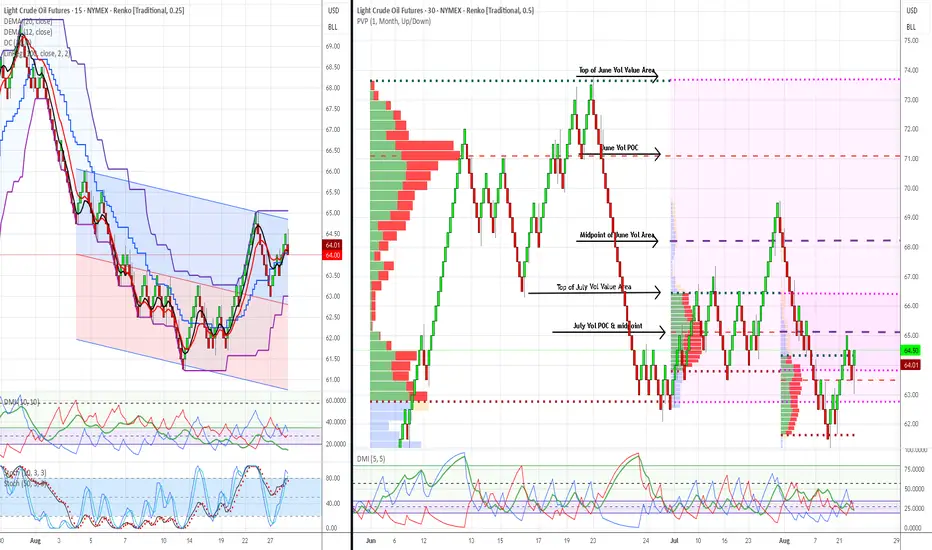
WTI Crude Oil Trading Analysis: 02-September-2025Week Ahead Plan: September 2-6, 2025
Analysis Period : August 26-30, 2025 Review | September 2-6, 2025 Outlook
Market : WTI Crude Oil Futures (CL1!)
Methodology : Dual Renko Chart System ($0.25/15min + $0.50/30min)
Current Price : $64.00 (August 30, 2025)
______________________________________
Crude oil - Potential UPThe break of breakeven must be give a push UP of price until next resistence area

potential for push down in bearish continuation 1->4 : market pushes down with number
2 buyers defeated by number 3 sellers
4->5 : we return to number 3 sellers
next?
* some bearish candles , large poc volume
if push below protects sells
* bearish 2nd degree divergence
* downtrend interest maintained with
obv trendline , buyers pushing

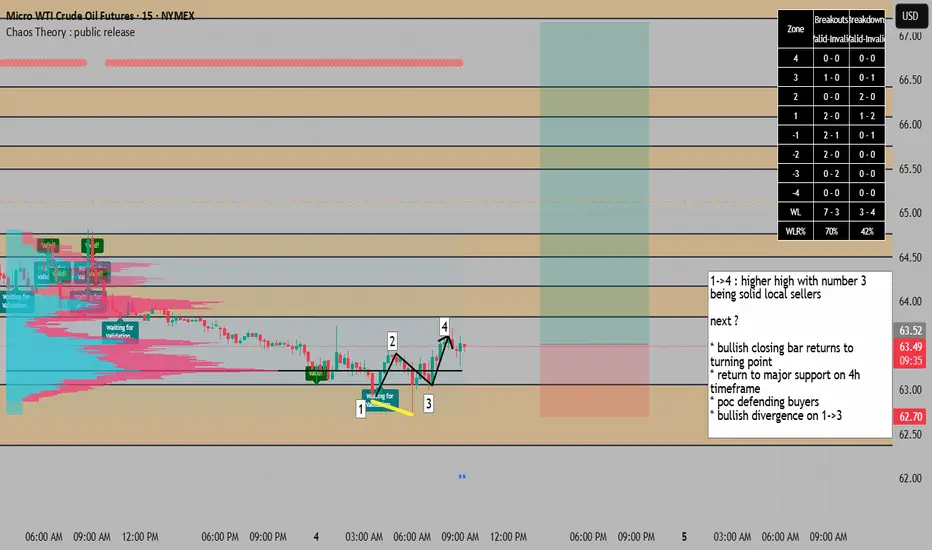
potential uptrend continuation on 15M from 4H structure 1->4 : higher high with number 3
being solid local sellers
next ?
* bullish closing bar returns to turning point
* return to major support on 4h timeframe
* poc defending buyers
* bullish divergence on 1->3
See all ideas
Summarizing what the indicators are suggesting.
Neutral
SellBuy
Strong sellStrong buy
Strong sellSellNeutralBuyStrong buy
Neutral
SellBuy
Strong sellStrong buy
Strong sellSellNeutralBuyStrong buy
Neutral
SellBuy
Strong sellStrong buy
Strong sellSellNeutralBuyStrong buy
A representation of what an asset is worth today and what the market thinks it will be worth in the future.
Displays a symbol's price movements over previous years to identify recurring trends.
Frequently Asked Questions
The current price of WTI Financial Futures (May 2033) is 62.91 USD — it has fallen −0.60% in the past 24 hours. Watch WTI Financial Futures (May 2033) price in more detail on the chart.
Track more important stats on the WTI Financial Futures (May 2033) chart.
The nearest expiration date for WTI Financial Futures (May 2033) is May 31, 2033.
Traders prefer to sell futures contracts when they've already made money on the investment, but still have plenty of time left before the expiration date. Thus, many consider it a good option to sell WTI Financial Futures (May 2033) before May 31, 2033.
Buying or selling futures contracts depends on many factors: season, underlying commodity, your own trading strategy. So mostly it's up to you, but if you look for some certain calculations to take into account, you can study technical analysis for WTI Financial Futures (May 2033). Today its technical rating is buy, but remember that market conditions change all the time, so it's always crucial to do your own research. See more of WTI Financial Futures (May 2033) technicals for a more comprehensive analysis.