CRUDE OILPreferably suitable for scalping and accurate as long as you watch carefully the price action with the drawn areas.
With your likes and comments, you give me enough energy to provide the best analysis on an ongoing basis.
And if you needed any analysis that was not on the page, you can ask me with a
Related commodities

CRUDE OILPreferably suitable for scalping and accurate as long as you watch carefully the price action with the drawn areas.
With your likes and comments, you give me enough energy to provide the best analysis on an ongoing basis.
And if you needed any analysis that was not on the page, you can ask me with a

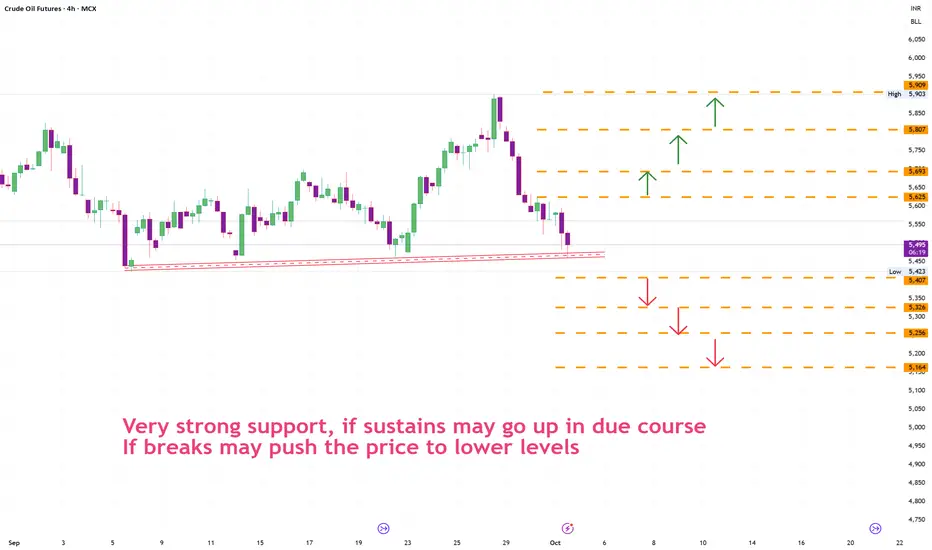
Crudeoil Probable price levelsCrudeoil price tested 5400 -5450 levels many times.
1. if buyers couldnt support the level then the pirce moves down.
2. if buyers defend the position then the price moves up.
CRUDE OILPreferably suitable for scalping and accurate as long as you watch carefully the price action with the drawn areas.
With your likes and comments, you give me enough energy to provide the best analysis on an ongoing basis.
And if you needed any analysis that was not on the page, you can ask me with a

CRUDE OIL "3 Heads Monster"Could this 3 Heads & Shoulders come to live ?
Built in "Close Price Line Chart" (Candle = Same formation)
Small (black) H&S Target @ 59.34
Medium (orange) H&S Target @ 44.32
Large (blue) H&S Target @ 10.29

Using tools to find reversal patterns for Sunday afternoonThis is Friday and we went through a number of markets that look like they have some good reversal patterns setting up there are at least 2 or 3 good opportunities based on the patterns there are some nice reversal patterns

CRUDE OIL BEARISH MOVEMENT - WYCKOFF METHOD🧠 Wyckoff Distribution in Action (Phase B–D Transition)
Instrument: Light Crude Oil Futures (3-Minute)
Concept: Wyckoff Distribution × Smart Money Logic
🔍 Market Narrative
PSY → BC → AR → ST → SOW → UT (B) — structure clearly shows the composite operator distributing above 59.00.
The Upthrust (U

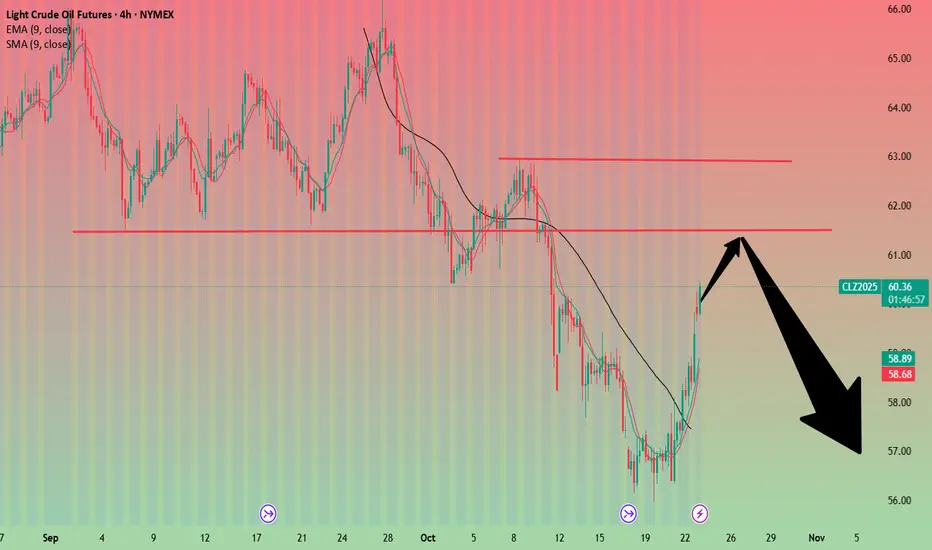
Crude oil - Sell around 61.00, target 58.00-56.00Crude Oil Market Analysis:
Crude oil previously started to decline on the daily chart. Yesterday's daily chart rebounded due to the EIA crude oil inventory data. Today's crude oil strategy remains bearish. Continue selling on rebounds. There's no chance of a reversal in crude oil sales, and the dat

In daily time frame formed head shoulder pattern it seems to be In daily time frame formed H&S pattern confirmed. It seems to be downtrend
Target of head to neck line measurement

See all ideas
Summarizing what the indicators are suggesting.
Neutral
SellBuy
Strong sellStrong buy
Strong sellSellNeutralBuyStrong buy
Neutral
SellBuy
Strong sellStrong buy
Strong sellSellNeutralBuyStrong buy
Neutral
SellBuy
Strong sellStrong buy
Strong sellSellNeutralBuyStrong buy
A representation of what an asset is worth today and what the market thinks it will be worth in the future.
Displays a symbol's price movements over previous years to identify recurring trends.
Frequently Asked Questions
The current price of WTI Financial Futures (Jun 2028) is 61.41 USD — it has risen 0.52% in the past 24 hours. Watch WTI Financial Futures (Jun 2028) price in more detail on the chart.
Track more important stats on the WTI Financial Futures (Jun 2028) chart.
The nearest expiration date for WTI Financial Futures (Jun 2028) is Jun 30, 2028.
Traders prefer to sell futures contracts when they've already made money on the investment, but still have plenty of time left before the expiration date. Thus, many consider it a good option to sell WTI Financial Futures (Jun 2028) before Jun 30, 2028.
Open interest is the number of contracts held by traders in active positions — they're not closed or expired. For WTI Financial Futures (Jun 2028) this number is 309.00. You can use it to track a prevailing market trend and adjust your own strategy: declining open interest for WTI Financial Futures (Jun 2028) shows that traders are closing their positions, which means a weakening trend.
Buying or selling futures contracts depends on many factors: season, underlying commodity, your own trading strategy. So mostly it's up to you, but if you look for some certain calculations to take into account, you can study technical analysis for WTI Financial Futures (Jun 2028). Today its technical rating is neutral, but remember that market conditions change all the time, so it's always crucial to do your own research. See more of WTI Financial Futures (Jun 2028) technicals for a more comprehensive analysis.