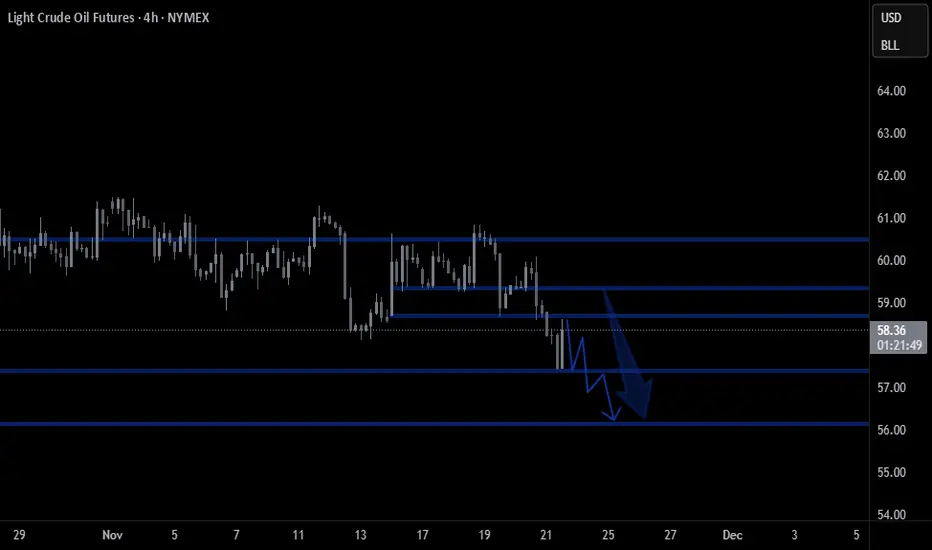
Crude oil probable price projection1. if price closes above the level then it moves up
2. if price breaks below may test lower levls
Related commodities

Crude Ready For New Strong Leg UpCrude oil is recovering for the last few weeks, after new sanctions against Russia, with price rebounding from 56 sharply and impulsively. This suggests an important new swing low is in place, and we should now be aware of more upside ahead, with a minimum three-wave recovery that could take us towa

CRUDE OILDO YOU KNOW WHATS BEHIND THIS OR OTHER IDEAS?? in bio..
Preferably suitable for scalping and accurate as long as you watch carefully the price action with the drawn areas.
With your likes and comments, you give me enough energy to provide the best analysis on an ongoing basis.
And if you needed any
CRUDE OILDO YOU KNOW WHATS BEHIND THIS OR OTHER IDEAS?? look bio..
Preferably suitable for scalping and accurate as long as you watch carefully the price action with the drawn areas.
With your likes and comments, you give me enough energy to provide the best analysis on an ongoing basis.
And if you needed an

CRUDE OILDO YOU KNOW WHATS BEHIND THIS OR OTHER IDEAS?? in bio..
Preferably suitable for scalping and accurate as long as you watch carefully the price action with the drawn areas.
With your likes and comments, you give me enough energy to provide the best analysis on an ongoing basis.
And if you needed any

CRUDE OIlDO YOU KNOW WHATS BEHIND THIS OR OTHER IDEAS?? in bio..
Preferably suitable for scalping and accurate as long as you watch carefully the price action with the drawn areas.
With your likes and comments, you give me enough energy to provide the best analysis on an ongoing basis.
And if you needed any

US OilCrude Oil
- Order Block
- Falling Wedge as an corrective pattern in Long Time Frame
- RSI -Divergence
- Demand Zone
- Completed " 1234 " Impulsive Waves

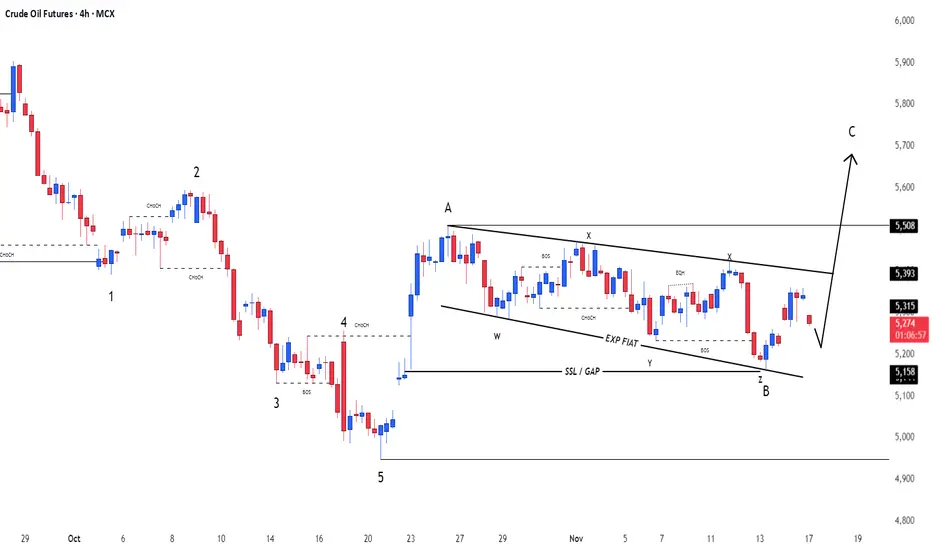
Crude OilU.S Oil Index
- Exp Fiat as an corrective pattern in Short Time Frame
- Break of Structure
- Completed " 12345 " Impulsive Waves and " AB " Corrective Waves
- Sell Side Liquidity
- Order Block
SellsI'm looking to sell, but patiently waiting for the price to enter my zone. On the Higher time frame, I see we are making LL & HL, which indicates a downtrend. Then I found a high-probability area where I believe the price will reject. We are waiting for a candlestick pattern or price action pattern

Sexy 60 3 hr Here's a new daily - watching the dance either side of 60 she's been testing the Big blue fib grain above to try for 61.25 + .382 -65.24 . Mama bear could drop to the blue mid mth Fib barn below 57.5 to .5 - 45.09 . It's showing an implied IHS bounce would be 3rd bovine EW big bull 65.24 o

See all ideas
Summarizing what the indicators are suggesting.
Neutral
SellBuy
Strong sellStrong buy
Strong sellSellNeutralBuyStrong buy
Neutral
SellBuy
Strong sellStrong buy
Strong sellSellNeutralBuyStrong buy
Neutral
SellBuy
Strong sellStrong buy
Strong sellSellNeutralBuyStrong buy
A representation of what an asset is worth today and what the market thinks it will be worth in the future.
Frequently Asked Questions
The current price of WTI Financial Futures (Apr 2029) is 61.20 USD — it has risen 0.25% in the past 24 hours. Watch WTI Financial Futures (Apr 2029) price in more detail on the chart.
Track more important stats on the WTI Financial Futures (Apr 2029) chart.
The nearest expiration date for WTI Financial Futures (Apr 2029) is Apr 30, 2029.
Traders prefer to sell futures contracts when they've already made money on the investment, but still have plenty of time left before the expiration date. Thus, many consider it a good option to sell WTI Financial Futures (Apr 2029) before Apr 30, 2029.
Open interest is the number of contracts held by traders in active positions — they're not closed or expired. For WTI Financial Futures (Apr 2029) this number is 35.00. You can use it to track a prevailing market trend and adjust your own strategy: declining open interest for WTI Financial Futures (Apr 2029) shows that traders are closing their positions, which means a weakening trend.
Buying or selling futures contracts depends on many factors: season, underlying commodity, your own trading strategy. So mostly it's up to you, but if you look for some certain calculations to take into account, you can study technical analysis for WTI Financial Futures (Apr 2029). Today its technical rating is sell, but remember that market conditions change all the time, so it's always crucial to do your own research. See more of WTI Financial Futures (Apr 2029) technicals for a more comprehensive analysis.