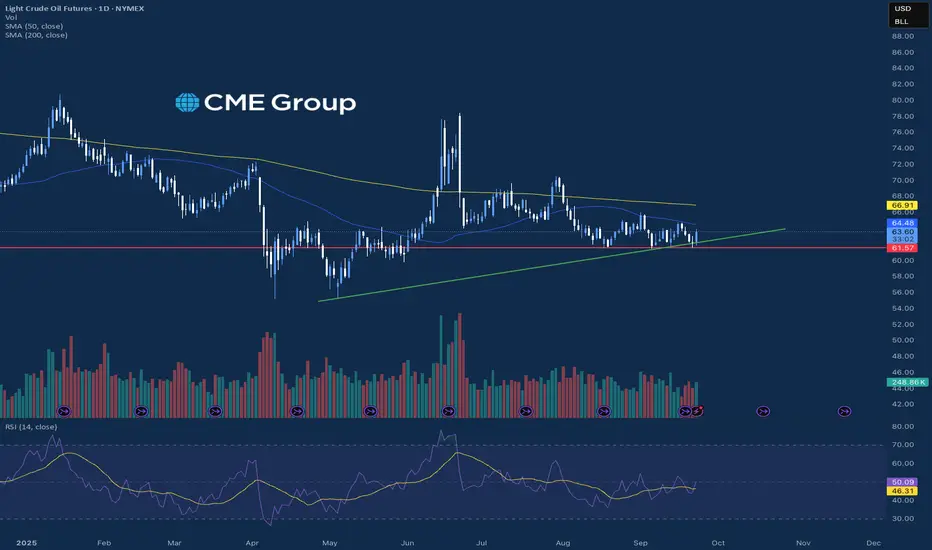
crudeoil probable price movements crudeoil is at key levels.
1. if rejected from the levels may test lower levels
2. if crosses above may touch upper levels
Related commodities


Crude oil: Sell around 64.90, target 63.00-61.00Crude Oil Market Analysis:
The rise in crude oil prices has left many investors confused. Shouldn't they be selling crude oil? Why is it so strong again? A look at the 4-hour candlestick chart will show that the current rally is still within a range of fluctuations and hasn't broken out. Furthermor

Momentum Speaks: Crude Oil Buy OpportunityCrude Oil Momentum Buy Setup
4H & 15M Timeframe View
Crude Oil is respecting the channel lower boundary with reversal from 5460–5490 support zone.
Currently moving in momentum, with Supertrend also confirming buy-on-dip opportunity.
Watch for pullbacks near 5540–5550 support (Supertrend zone) fo

CL oil & Inflation are cooling-off towards $55!1). Corrective wave 4 is likely over! 2). MACD is divergent, as price inches up 3). Retail candle is an indecisive spinning top. 4). Overall correction needs a wave 5 south. 5). Volume is dropping. 6). Oil is an Inflation barometer, which is dropping. 7).I've been analyzing charts for over 20 yrs. a

Equities Cooling From All Time HighsEquity Indices are seeing selling pressure into the close today marking the first down day of the week. The selling was led by the Nasdaq which traded down near 0.6% after being the most technically “overbought” of the equity indices on a daily basis. The economic data slate today showed PMI came in
From Mystery to Mastery: Trading EssentialsIntroduction: Why Trading Feels Like a Mystery
For many aspiring traders, the markets appear as a mysterious puzzle. Prices move in ways that often feel unpredictable, charts are filled with patterns that seem random, and every strategy seems to work until it suddenly doesn’t. This is why trading
CRUDE OILPreferably suitable for scalping and accurate as long as you watch carefully the price action with the drawn areas.
With your likes and comments, you give me enough energy to provide the best analysis on an ongoing basis.
And if you needed any analysis that was not on the page, you can ask me with a


Crude Oil Target LongStrong Buy until Daily Bearish FVG
With news on Russia cuts fuel exports, Crude Oil is expected to continue Bullish during US AM sessions.
Expected a manipulation during london session.

See all ideas
Summarizing what the indicators are suggesting.
Neutral
SellBuy
Strong sellStrong buy
Strong sellSellNeutralBuyStrong buy
Neutral
SellBuy
Strong sellStrong buy
Strong sellSellNeutralBuyStrong buy
Neutral
SellBuy
Strong sellStrong buy
Strong sellSellNeutralBuyStrong buy
A representation of what an asset is worth today and what the market thinks it will be worth in the future.
Displays a symbol's price movements over previous years to identify recurring trends.
Frequently Asked Questions
The current price of Guernsey Light Sweet (EMDA) Monthly Futures (Mar 2026) is −1.00 USD — it hasn't changed in the past 24 hours. Watch Guernsey Light Sweet (EMDA) Monthly Futures (Mar 2026) price in more detail on the chart.
Track more important stats on the Guernsey Light Sweet (EMDA) Monthly Futures (Mar 2026) chart.
The nearest expiration date for Guernsey Light Sweet (EMDA) Monthly Futures (Mar 2026) is Feb 27, 2026.
Traders prefer to sell futures contracts when they've already made money on the investment, but still have plenty of time left before the expiration date. Thus, many consider it a good option to sell Guernsey Light Sweet (EMDA) Monthly Futures (Mar 2026) before Feb 27, 2026.
Buying or selling futures contracts depends on many factors: season, underlying commodity, your own trading strategy. So mostly it's up to you, but if you look for some certain calculations to take into account, you can study technical analysis for Guernsey Light Sweet (EMDA) Monthly Futures (Mar 2026). Today its technical rating is buy, but remember that market conditions change all the time, so it's always crucial to do your own research. See more of Guernsey Light Sweet (EMDA) Monthly Futures (Mar 2026) technicals for a more comprehensive analysis.