CRUDE OILPreferably suitable for scalping and accurate as long as you watch carefully the price action with the drawn areas.
With your likes and comments, you give me enough energy to provide the best analysis on an ongoing basis.
And if you needed any analysis that was not on the page, you can ask me with a comment or a personal message.
Enjoy Trading ;)
MCLN2028 trade ideas
I have a dream - OIl below $50I have a dream OIl below $50
since US strike on Iran OIl hit $76 per barral for several days
after down only
I think that trend would go on
and in a case of reaching $50 per barrel WAr in Ukraine would stop

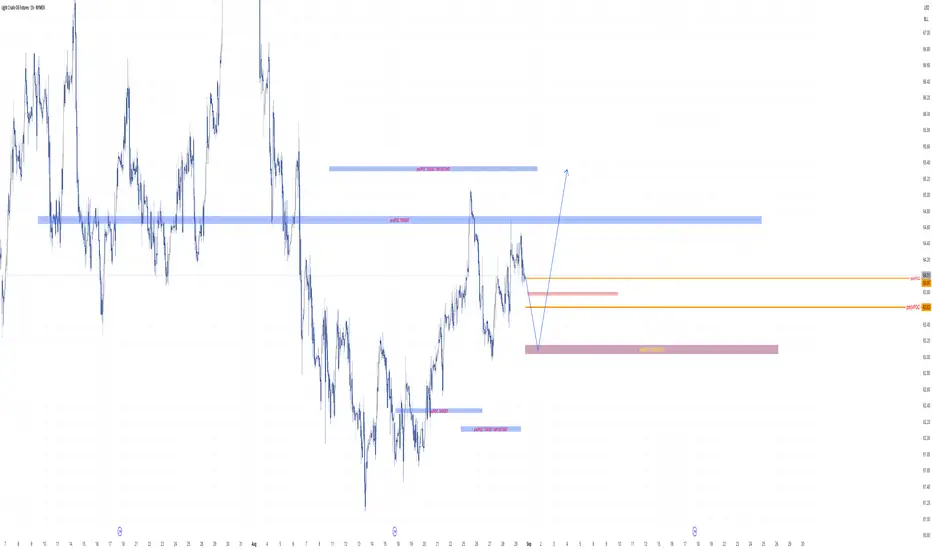
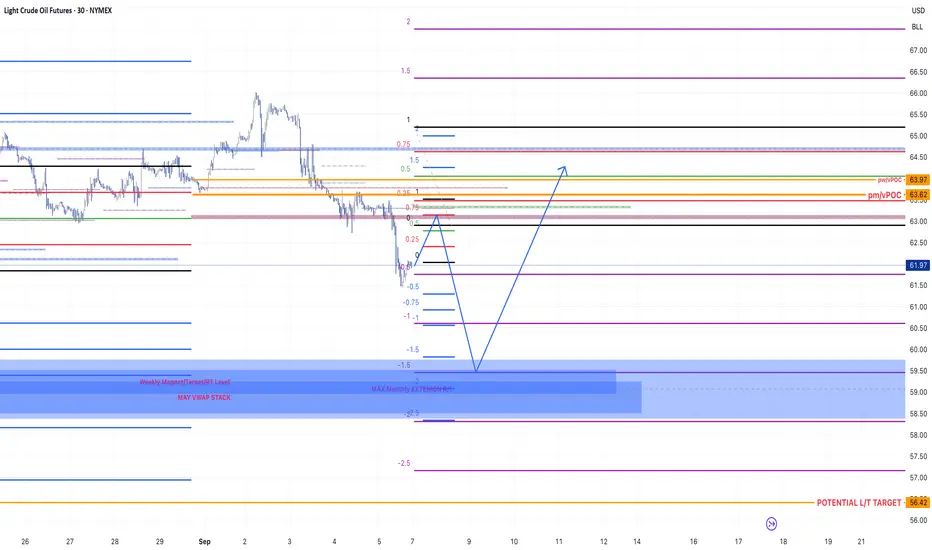
Bullish on Oil week 01-07/09 2025Will wait to see price reach and react from the previous month POC. That should be the play off the week. Bullish setups only. I the week starts going higher we should expect for this to reverse in the middle of the month.
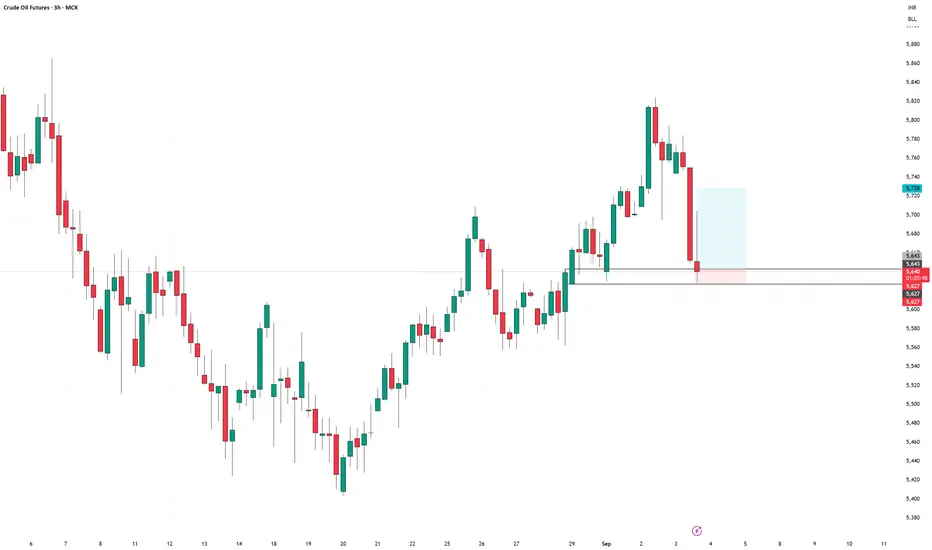
CRUDEOIL September Futures long setupCRUDEOIL September Futures long setup
Entry - 5643
Stop Loss - 5627
Target - 5728
Risk Reward - 1:5.3
return to proven buyers presents trend continuation opportunity 1->3 : higher high , number 2 proven buyers
3->4 : reutrn to buyers
what do I think will happen next ?
* push above vpoc
* hidden bullish divergence
* obv support line predicting buying interest

potential for push down in bearish continuation 1->4 : market pushes down with number
2 buyers defeated by number 3 sellers
4->5 : we return to number 3 sellers
next?
* some bearish candles , large poc volume
if push below protects sells
* bearish 2nd degree divergence
* downtrend interest maintained with
obv trendline , buyers pushing up but
not breaking structure

Crude Oil Idea of week 08-12/09/25This week I see Oil continuing lower with a potential bullish reaction after reaching lower price areas of interest. Monitoring price action on Monday to decide what we will attack and trade. I wouldn't be surprised if this week is choppy!
Always caution, patience and risk!
GL!
If you like the content give me a follow on X!
Check Bio. Cheers!
Oil Long Setup (A Setup)Oil is basically in a sideways price action following a predictable range. Overall, there isn't much momentum. However, considering the current sideways move, and taking into consideration key demand levels, it seems it has a high probability of a move to the upside to next supply zone.
I give this setup an 80% chance (A setup). My buy limit has already been triggered, with TP1 and TP2 levels I indicated on chart.
Let's see how it goes.
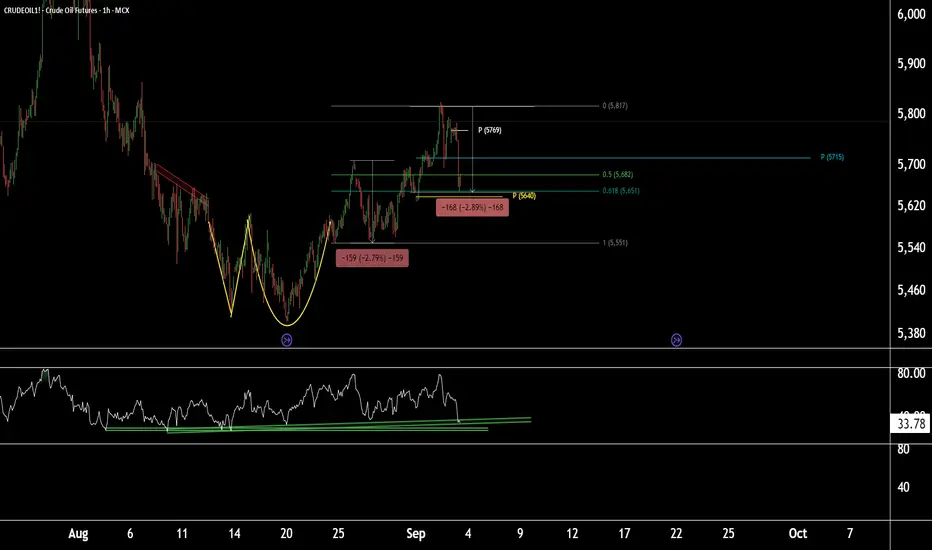
Price action + RSI support = fresh buy opportunity in CrudeOil1!CrudeOil1! (1-Hour Timeframe) Technical Outlook
CrudeOil1! is currently sustaining at the Fibonacci Golden Ratio level of 0.618, with the weekly pivot placed near 5640. Based on Fibonacci projections and price action, this 5640 zone appears to be a crucial area, as it aligns with a 2.8% retracement completion.
On the 1-hour timeframe, the RSI is showing a decline but may take support near the current levels, adding further weight to this support zone.
All technical indicators together suggest that the 5640–5650 zone could act as a strong support in the short term. If this support holds, we may see upside targets at 5715 and 5750, with the potential for CrudeOil1! to make a new high if the bullish momentum continues.
Thank you.
Crude oil - Potential UPThe break of breakeven must be give a push UP of price until next resistence area

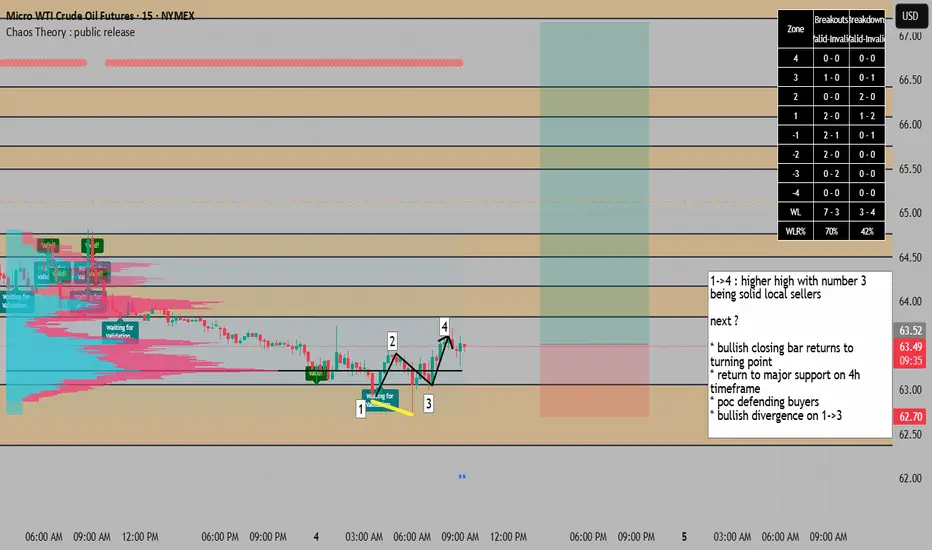
potential uptrend continuation on 15M from 4H structure 1->4 : higher high with number 3
being solid local sellers
next ?
* bullish closing bar returns to turning point
* return to major support on 4h timeframe
* poc defending buyers
* bullish divergence on 1->3
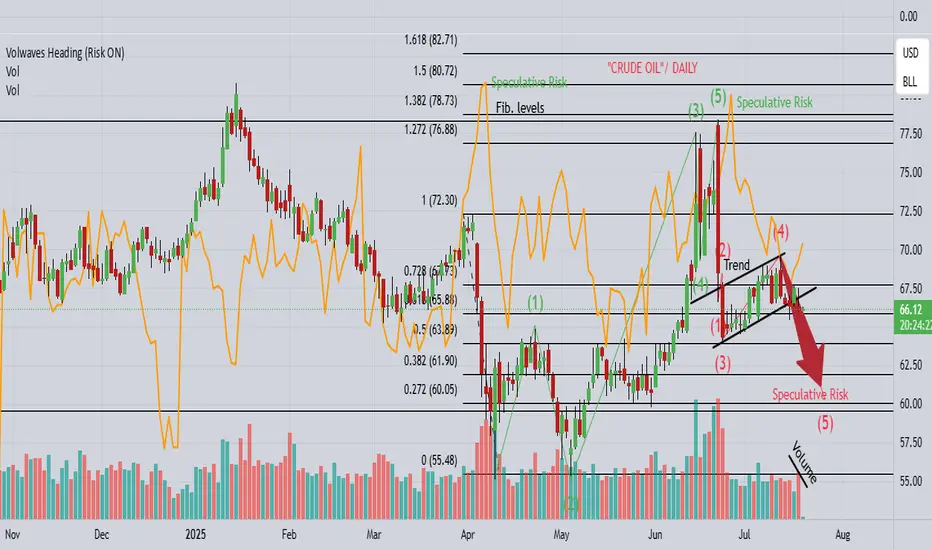
CL "OIL" continues the drop towards $60!1). Wave 5 drop needs a completion lower! 2). Risk is selling off! 3). Volume is falling! 4). Price appears to be heading towards lower market sentiment! 5). Trump is imposing more Tariffs, which is likely causing deeper corrections!
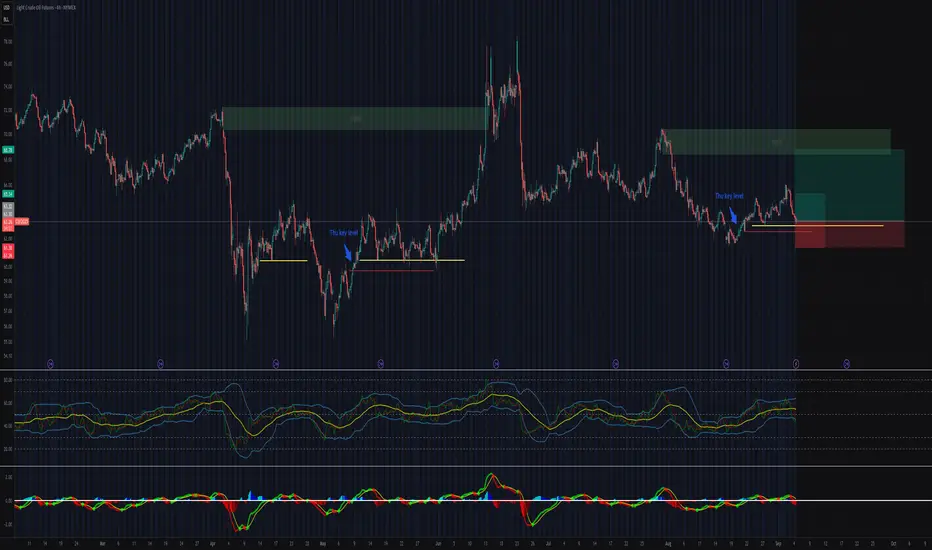
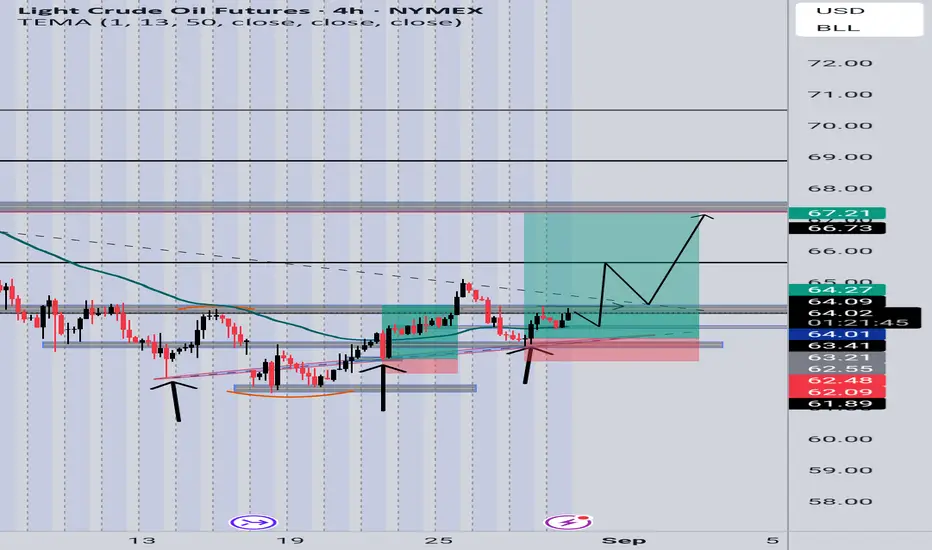
CL1! 4H | Bullish Setup
Price has respected multiple bullish structures and key demand zones. Strong higher lows with clean breaks of internal structure.
If theris pullback before continuation to the upside then can add entries
Entry: 64.03 (re-entry)
SL: 62.55
TP: 67.21
R:R ≈ 2.5
Final target aligns with previous supply and imbalance fill. Monitoring reaction around 66.70 zone for partials
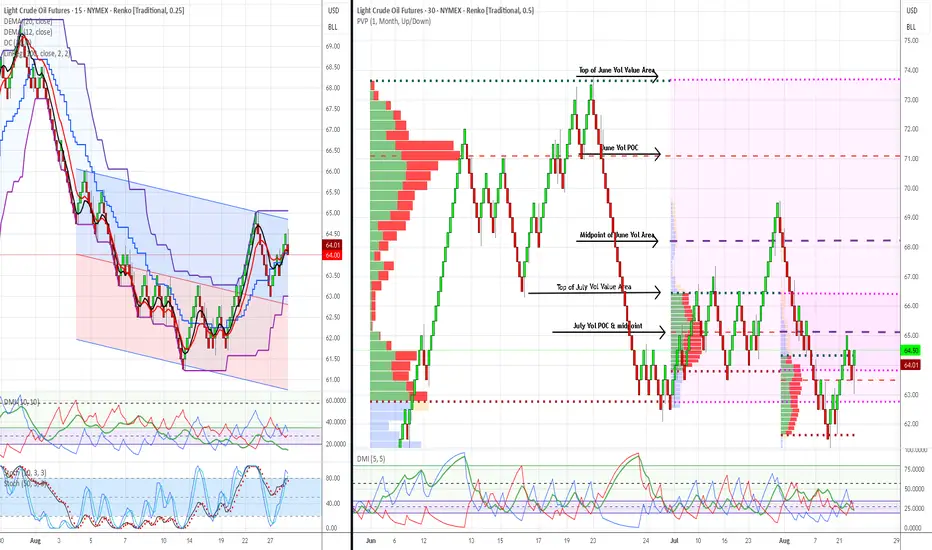
WTI Crude Oil Trading Analysis: 02-September-2025Week Ahead Plan: September 2-6, 2025
Analysis Period : August 26-30, 2025 Review | September 2-6, 2025 Outlook
Market : WTI Crude Oil Futures (CL1!)
Methodology : Dual Renko Chart System ($0.25/15min + $0.50/30min)
Current Price : $64.00 (August 30, 2025)
________________________________________
Strategic Outlook & Market Setup
Primary Scenario (70% Probability): Pullback First, Then Recovery
What to Expect : Market opens lower Tuesday ($63.00-63.50 range) due to bearish signal on short-term chart. This creates a buying opportunity if support holds.
Trading Plan:
Tuesday Opening : Expect gap down - don't panic, this was anticipated
Buy Zone : Look for entries between $62.00-63.50 (strong institutional support)
Confirmation Needed : Wait for short-term trend to flip bullish again before buying
Target : Still aiming for $66.50 but may take extra 3-5 days to get there
Secondary Scenario (25% Probability): Sideways Consolidation
What to Expect : Market trades in $63.50-64.50 range for several days while technical signals realign.
Trading Plan:
Strategy: Be patient - don't force trades in choppy conditions
Wait For: Clear breakout above $64.50 with volume
Risk: Could waste 1-2 weeks in sideways action
Low Probability Scenario (5% Probability): Immediate Continuation Up
What to Expect : Market gaps up above $64.25 and keeps rising.
Trading Plan:
Verify: Make sure both short-term and long-term signals turn bullish
Caution: Be skeptical without strong volume confirmation
Action: Can buy but use smaller position sizes until confirmed
________________________________________
Market Risk Factors & Monitoring
Critical Support Level : $62.00
Why Important: Massive institutional buying occurred here - if it breaks, the bullish case is dead
Action If Broken: Exit all long positions immediately, wait for new setup
Probability of Break: Low (15%) but must be respected
Key Events This Week :
Tuesday: ISM Services data (economic health indicator)
Wednesday: Weekly oil inventory report (could cause volatility)
Friday: Jobs report (affects overall market sentiment)
Warning Signs to Watch:
Technical: Short-term trend staying bearish for more than 3 days
Volume: Declining volume on any bounce attempts
Support: Any trading below $62.50 for extended periods
Time: No progress toward $66.50 target within 10 total trading days
Positive Signs to Look For :
Technical: Short-term trend flipping back to bullish (key confirmation)
Volume: Above-average volume on any recovery moves
Support: Strong buying interest at $62-63 zone
Momentum: Clean breakout above $64.50 with follow-through
________________________________________
Forward-Looking Adjustments
Modified Risk Management :
Position Size: Use 50% of normal position size until both timeframes align bullish
Stop Loss: Tighter stops at $62.75 (just below support zone)
Entry Patience: Don't chase - wait for pullback to support levels
Profit Taking: Be more aggressive taking profits at first target ($66.50)
Revised Entry Strategy:
Before Buying, Confirm ALL Three:
Price: Trading at or near $62-63 support zone
Technical: Short-term trend signal flips back to bullish
Volume: Above-average buying interest visible
Timeline Expectations :
Days 1-3: Expect pullback/consolidation phase
Days 4-5: Look for bullish confirmation signals
Days 6-10: Resume advance toward $66.50 target if signals align
Beyond Day 10: If no progress, reassess entire strategy
Success Metrics:
Minimum Goal: Protect capital during pullback phase
Primary Target: $66.50 within 2 weeks (revised from 1 week)
Risk Limit: Maximum 2% account loss if support fails
Time Limit: Exit strategy if no directional progress within 10 days total
Simplified Decision Framework :
Green Light to Buy: Price near $62-63 + Short-term trend bullish + Good volume Yellow Light (Wait): Mixed signals, choppy price action, low volume
Red Light (Exit): Price below $62, bearish trend continuing, time limit exceeded
________________________________________
Bottom Line : The bigger picture remains bullish, but short-term signals suggest a pullback first. Use any weakness to $62-63 as a buying opportunity, but only with proper confirmation. Be patient - the setup is still valid but timing may be delayed by a few days.
________________________________________
Document Classification : Trading Analysis
Next Update : September 6, 2025 (Weekly Review)
Risk Level : Moderate (controlled institutional setup)
This analysis represents continued validation of a systematic, institutional-grade trading methodology with demonstrated predictive accuracy and risk control capabilities. This is a view that represents possible scenarios but ultimate responsibility is with each individual trader.
Risk Disclaimer: Past performance does not guarantee future results. All trading involves risk of loss.
Crude Oil's $62.57 Price Signals Potential Long Opportunity
Current Price: $62.57
Direction: LONG
Targets:
- T1 = $65.50
- T2 = $68.00
Stop Levels:
- S1 = $61.00
- S2 = $59.50
**Wisdom of Professional Traders:**
This analysis synthesizes insights from thousands of professional crude oil traders and energy market experts. From supply-driven catalysts to macroeconomic pressures, traders continually refine their strategies to align with data-driven probabilities. Leveraging trends in inventory reports, OPEC-plus production decisions, and geopolitical developments, these professionals identify price dynamics and critical resistance levels. Collective analysis underscores how sentiment and external conditions integrate with crude oil's cyclical behavior to shape high-probability setups.
**Key Insights:**
Crude oil continues to navigate a delicate balance between fundamental supply-demand dynamics and investor sentiment. The recovery rally from recent lows indicates that global demand fears may have been overstated, with China’s reopening boosting optimism for consumption over the coming quarters. Seasonal factors like increased fuel demand during warmer months further support upward momentum. On the supply side, OPEC’s recent commitment to maintaining production cuts is expected to underpin crude prices, while the incremental decline in U.S. shale output points to tighter supplies globally. Moreover, falling inventories, particularly in the U.S., further enhance the bullish narrative as lower stockpiles usually lead to higher prices.
Technical indicators reveal a positive shift. A breakout above a short-term consolidation near $62 suggests buyers are gaining confidence and could drive higher levels. Key moving averages, including the 50-day and 200-day, are converging toward bullish alignment, and relative strength index (RSI) readings remain well within uptrend territory. These conditions support a continuation toward $65 and $68 price targets if the current trajectory solidifies.
**Recent Performance:**
Crude prices dipped below $60 earlier this month following disappointing macroeconomic data and fears of a prolonged recession. However, a rebound emerged as central banks reassessed their interest rate policies amid signs of slowing inflation. Further compounding this rise is the positive sentiment surrounding reduced Russian oil exports coupled with easing U.S. Federal Reserve hawkishness on energy consumption forecasts. In the current trading session, crude oil has shown strong support near $62.00, paving the way for upward momentum.
**Expert Analysis:**
Top market experts highlight crude’s responsiveness to geopolitical headlines, including OPEC’s production strategy, unstable export dynamics in Russia, and policy implications from the Biden administration regarding strategic petroleum reserves. A favorable technical structure consolidates this view, with recent pivot levels supporting further upside. Analysts emphasize that risk remains asymmetric—short-term dips near $61 may serve as entry points for bullish momentum as demand stabilizes globally. However, traders should prudently monitor inflation impacts and recession fears since these might cap gains above $68 levels.
**News Impact:**
OPEC's latest strategy to carry forward production cuts through 2023 will likely restrict supply flows, tightening inventories. Additionally, recent U.S. government data reveals declining crude oil stockpiles, pointing to robust consumption despite macro headwinds. Geopolitical risks, including Russian export disruptions due to sanctions, further amplify bullish sentiment. Finally, China’s post-COVID stimulus to accelerate industrial activity may bolster global oil demand in the months to come, making upside targets plausible.
**Trading Recommendation:**
Based on fundamental catalysts, technical analysis, and professional insights, crude oil exhibits a strong case for a bullish position. Traders are advised to take a long stance if prices hold above $62, targeting $65.50 in the short term and $68.00 in the medium term. Risk management is vital—setting stops at $61.00 and $59.50 ensures protection against volatility. As supply tightens and demand stabilizes globally, crude oil presents an attractive upside opportunity in the current market environment.
Do you want to save hours every week? Register for the free weekly update in your language!

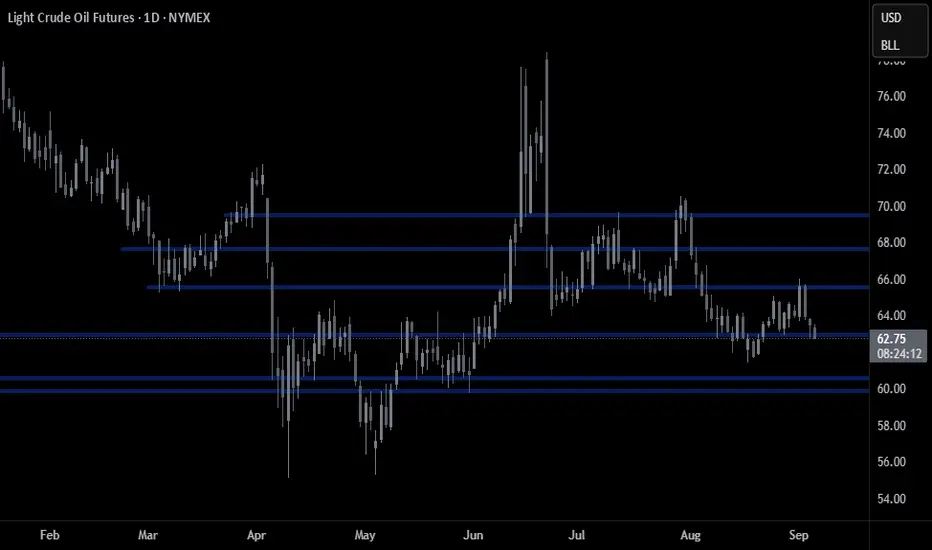
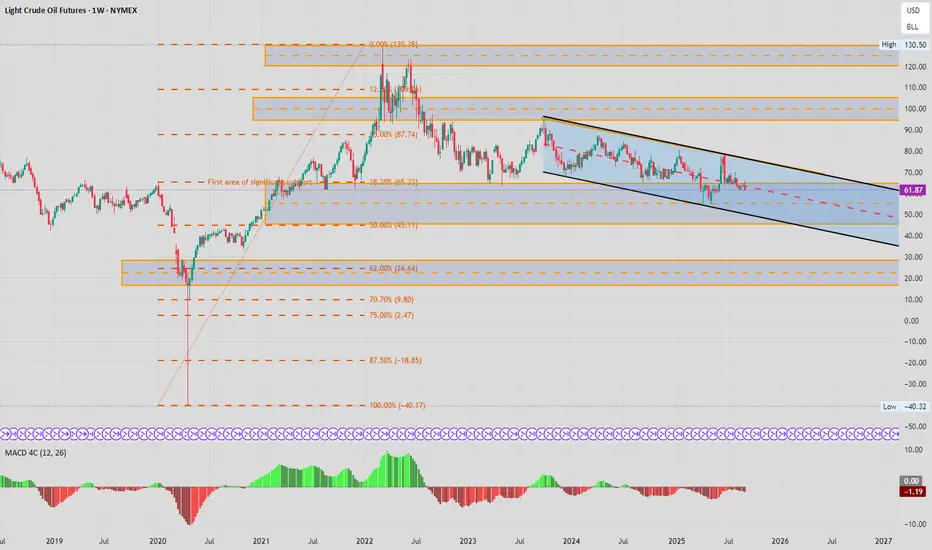
Broad look at CL Futures Just mapping out CL Futures on weekly chart
This market has been range bound for more than a year buyers at $60 and sellers at $80
Last week finished weak and could be the catalyst for another test of the support area
Be patient wait for your set up and trade within tight risk parameters.

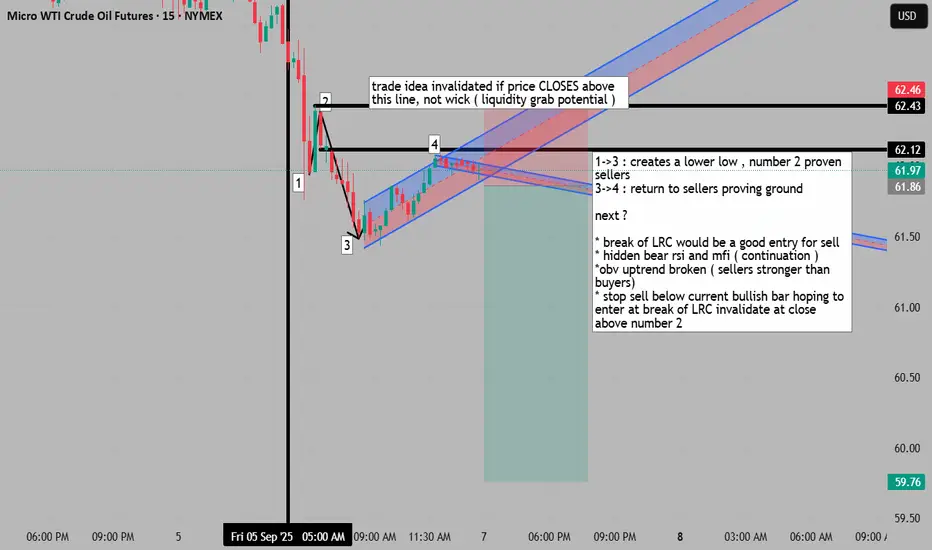
potential return to trend after pullback 1->3 : creates a lower low , number 2 proven sellers
3->4 : return to sellers proving ground
next ?
* break of LRC would be a good entry for sell
* hidden bear rsi and mfi ( continuation )
*obv uptrend broken ( sellers stronger than buyers)
* stop sell below current bullish bar hoping to
enter at break of LRC invalidate at close above number 2
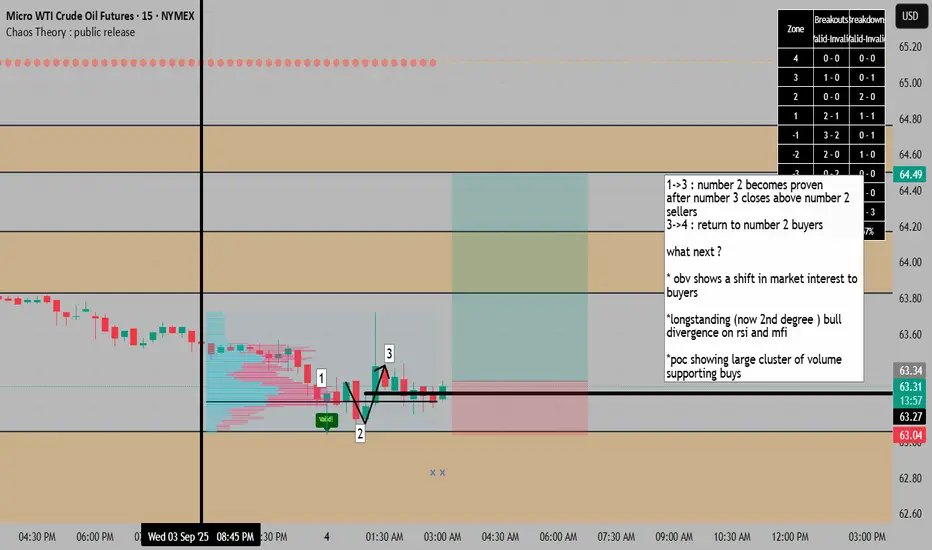
risky but plusable trade idea to upside ( very risky ) 1->3 : number 2 becomes proven
after number 3 closes above number 2
sellers
3->4 : return to number 2 buyers
what next ?
* obv shows a shift in market interest to
buyers
*longstanding (now 2nd degree ) bull
divergence on rsi and mfi
*poc showing large cluster of volume
supporting buys
Oil falls after rejection at the 50 SMAOil trades within a descending channel dating back to 2023. The price trades below its 200 SMA in a bearish trend. Oil failed to rise above the 50 SMA and the 65.00 round number, rebounding lower, with the RSI below 50 highlighting bearish pressure.
Should sellers extend the bearish move below 61.45, the August low, and 60.00 round number, this creates a lower low and could spur a deeper selloff towards 55.00.
FC

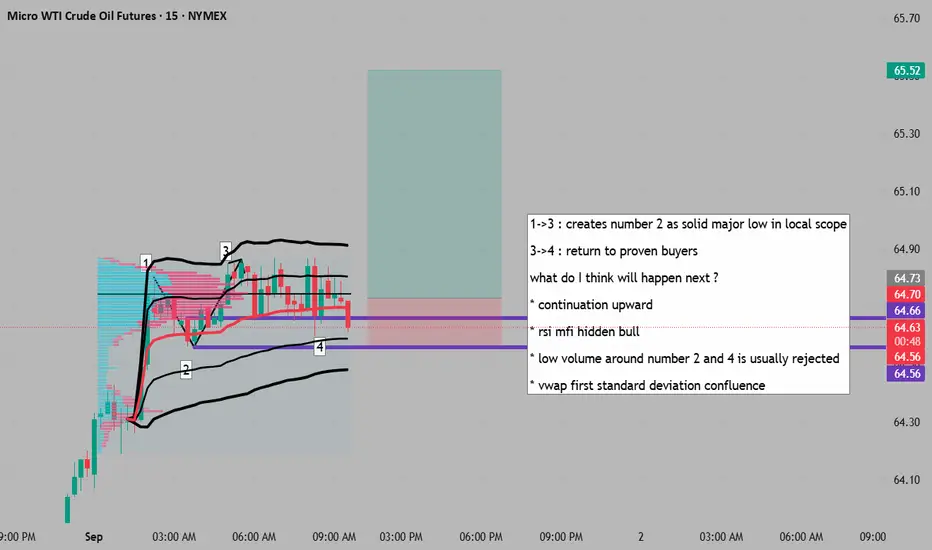
potential continuation of uptrend with return to proven buyers1->3 : creates number 2 as solid major low in local scope
3->4 : return to proven buyers
what do I think will happen next ?
* continuation upward
* rsi mfi hidden bull
* low volume around number 2 and 4 is usually rejected
* vwap first standard deviation confluence
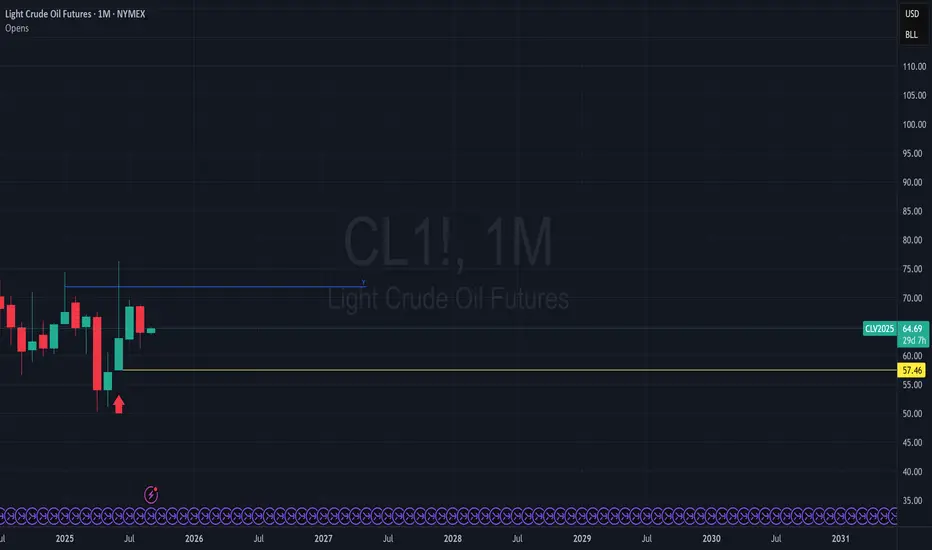
Oil has 2 consecutive months closing below June's pop in priceWill oil futures eventually retest 57.46 now that two months have been unable to press for June's price high?
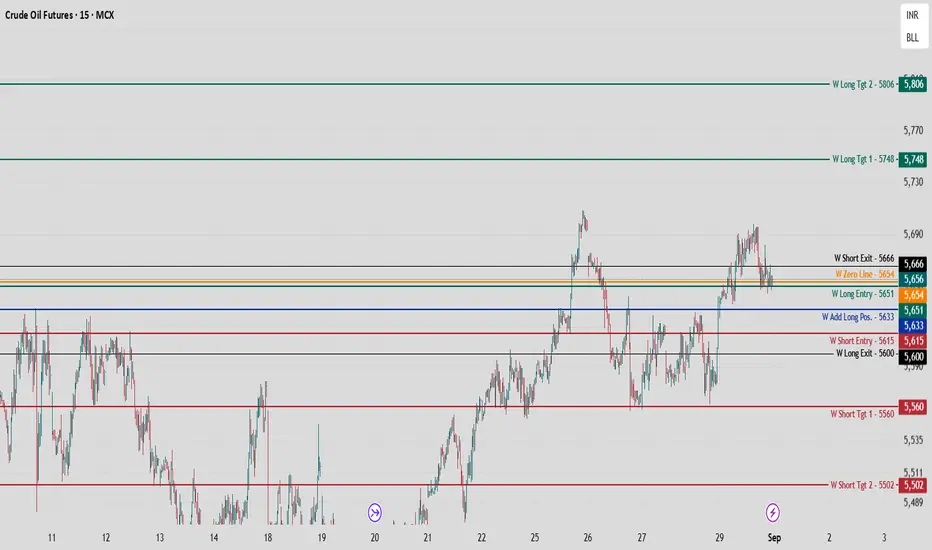
Crude Oil MCX Futures — Weekly Positional Roadmap (1-5 Sep-2025)MCX:CRUDEOIL1! For positional and swing traders in Crude Oil MCX Futures, weekly levels provide a clear directional blueprint for the week ahead.
Weekly Key Levels
Zero Line: 5654 — This is the pivotal level dividing bullish and bearish sentiment for the entire week. Any 1 hour candle closed before or above with a high or low break, is a bias hint for the week!
Positional Buy Setup: Remain buy-biased till 5627. Positions can be initiated above 5671 (Weekly Long Entry) and strengthened at 5663 (Add Long).
Upside Targets:
Weekly Take Profit Tgt 1: 5698
Weekly Take Profit Tgt 2: 5725
Long Exit: Closing Above 5647 — Consider booking positions near these levels if upward momentum stalls.
Weekly Bearish Plan
Short Setup: If Crude breaches and sustains below 5654, positional shorts can be considered with eyes on 5610 and 5583 for target levels.
Short Exit: Cover or reconsider shorts if price rebounds above 5678.
Tactical Guidance
Weekly/Positional Traders: Use these levels for larger swing moves; wait for clear breakouts confirmed by 1 Hour candle closes for timing entries and exits, on pull back, make positions.
Adapt position sizes and risk management to account for wider weekly swings compared to daily trades.
Approach the week with a clear plan—these levels serve as checkpoints for positional trading rather than intraday scalps. Stay patient and disciplined for potential bigger moves this week.
MCX:CRUDEOIL1!