Q4 2025 Oil Market Outlook: WTI and Brent Crude Analysis**September 27, 2025**
## **Executive Summary**
As the global energy landscape enters the final quarter of 2025, the oil market remains delicately balanced between oversupply pressures and persistent geopolitical risks. West Texas Intermediate (WTI) and Brent Crude—two of the world’s most closely watched benchmarks—are trading in a narrow range, reflecting cautious sentiment among traders and investors. This report provides a comprehensive analysis of current market dynamics, evaluates key drivers, and offers a professional forecast for Q4 2025.
---
## **Current Market Snapshot**
- **WTI Crude (as of September 26, 2025):** $65.37/bbl
- **Brent Crude:** $69.72/bbl
- **YTD Performance:** WTI down ~14.8% from 2022; Brent down ~12.3%
Both benchmarks have shown resilience in recent weeks, supported by seasonal demand and inventory drawdowns, but face headwinds from rising global supply and economic uncertainty.
---
## **Fundamental Drivers**
### **1. Supply-Side Dynamics**
- **OPEC+ Production Increases:** OPEC+ has announced a phased increase of 547,000 barrels per day starting in September , with further adjustments planned for October. This marks the final unwinding of the 2.2 million bpd voluntary cuts initiated in late 2023.
- **Non-OPEC+ Output Growth:** U.S. production remains robust at 13.4 million bpd, with additional supply from Canada and Guyana contributing to a projected global surplus of 1.5% in Q4 .
### **2. Demand Outlook**
- **Global Demand Growth:** Forecasted to slow to ~1.1 million bpd in 2025, down from 1.8 million bpd in 2024.
- **Seasonal Trends:** Winter heating demand may offer temporary support, but overall consumption is expected to contract by 230,000 bpd in Q4.
### **3. Geopolitical Risks**
- **Russia-Ukraine Conflict:** Continued strikes on Russian energy infrastructure and renewed sanctions have injected volatility into the market.
- **Middle East Tensions:** Drone attacks and Red Sea disruptions have added risk premiums to Brent pricing.
- **U.S. Tariff Policy:** Aggressive energy tariffs and diplomatic pressure on European allies to reduce Russian imports have further complicated trade flows.
---
## **Technical Analysis & Market Sentiment**
### **WTI Crude**
- **Support Levels:** $62.90, $61.50
- **Resistance Levels:** $66.00, $68.00
- **Trend:** Neutral to mildly bearish; RSI hovering near 50.
### **Brent Crude**
- **Support Levels:** $67.00, $65.70
- **Resistance Levels:** $70.30, $72.00
- **Trend:** Consolidating in a symmetrical triangle; breakout potential remains.
---
## **Institutional Forecasts for Q4 2025**
Institution | WTI Forecast (Q4 2025) | Brent Forecast (Q4 2025)
------------------------|------------------------|---------------------------
EIA | $55.41 | $59.00
J.P. Morgan | $57.00 | $63.57
Goldman Sachs | $60.30 | $63.57
Trading Economics | $62.43 | $67.65
Reuters Poll | $64.65 | $68.20
---
## **Q4 2025 Price Forecast & Rating**
### **WTI Crude Oil**
- **Forecast Range:** $58.00 – $64.00
- **Base Case:** $60.00
- **Rating:** **Neutral to Bearish**
- **Key Risks:** Inventory builds, slowing demand, U.S. shale resilience
### **Brent Crude Oil**
- **Forecast Range:** $62.00 – $68.00
- **Base Case:** $65.00
- **Rating:** **Neutral**
- **Key Risks:** Geopolitical shocks, OPEC+ policy shifts, European demand softness
---
## **Strategic Implications for Stakeholders**
- **Investors:** Expect continued volatility; hedge positions via options and futures.
- **Producers:** Prepare for margin compression; focus on cost efficiency and capital discipline.
- **Policymakers:** Monitor inflationary impacts and energy security amid geopolitical tensions.
---
## **Conclusion**
The Q4 2025 oil market is poised for a cautious and potentially volatile close to the year. While geopolitical risks offer short-term support, the structural oversupply and weakening demand fundamentals suggest limited upside for both WTI and Brent. Market participants should brace for a range-bound environment with breakout risks tied to geopolitical developments and OPEC+ policy shifts.
---
Risk Disclaimer!
General Risk Warning: Trading on the Financial Markets, Stock Exchange and all its asset derivatives is highly speculative and may not be suitable for all investors. Only invest with money you can afford to lose and ensure that you fully understand the risks involved. It is important that you understand how Trading and Investing on the stock exchange works and that you consider whether you can afford the high risk of loss.
WSV2016 trade ideas

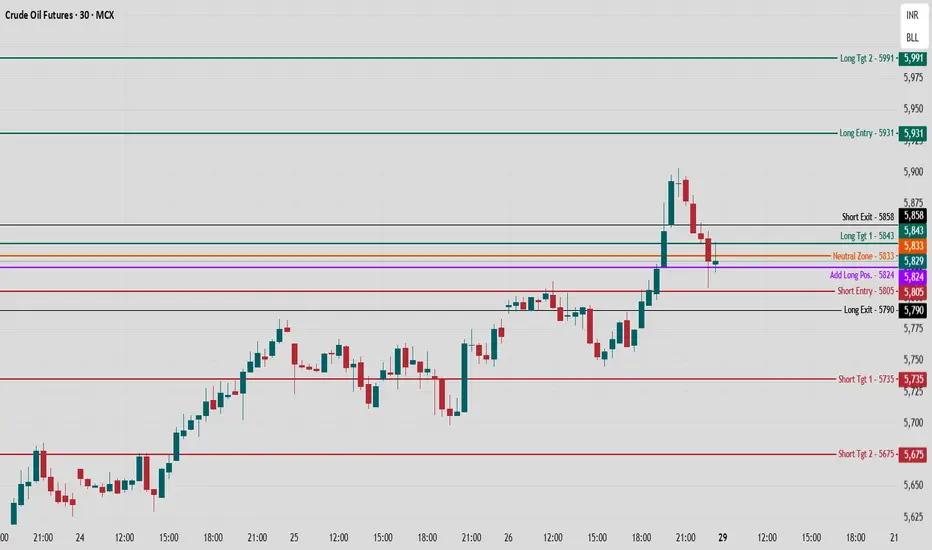
Crude Oil MCX Future - Intraday Technical Analysis - 29 Sept.MCX:CRUDEOIL1! Crude Oil is trading at 5,829, pulling back after a sharp rally and currently consolidating near neutral support-resistance confluence zones.
Bullish (Long) Setup
Long Entry (5,931):
Go long on breakout above 5,931. This confirms trend continuation beyond local resistance after the recent up-move and offers room for intraday expansion.
Additional long setups can be initiated near 5,824 with a tight stop if price finds support above this add-long position on minor dips.
Upside Targets:
5,843 (Target 1): First supply, locally mapped resistance, ideal for partial profit booking.
5,991 (Target 2): Next marked extension, testing session highs and broader range resistance.
Stop Loss:
Use below 5,805 or 5,790 to capture failed breakouts or pullbacks without excessive drawdown.
Bearish (Short) Setup
Short Entry (5,805):
Initiate shorts below 5,805, confirming breakdown of support that would shift control to sellers.
Downside Targets:
5,735 (Target 1): Historical bounce area and first profit zone for shorts.
5,675 (Target 2): Lower mapped support and logical session extension target.
Stop Loss:
Cover shorts if price returns and sustains above 5,824 to avoid sharp reversals.
Neutral/Range Logic
Neutral Zone (5,833):
Acting as a pivot; trading near this level can be choppy. Await breakout above 5,931 or breakdown below 5,805 for directional clarity.
This approach ensures systematic, risk-managed trading for both trending and reversal trades in MCX Crude Oil intraday.
Follow Chart Pathik for more such insights on Crude Oil MCX Future on day to day basis.
Crude oil: Sell around 63.80, target 61.80-60.00.Crude Oil Market Analysis:
Today's strategy for crude oil remains bearish. Sell if it rebounds below the moving average. Crude oil is still fluctuating in the short term. Watch for a break below 60.00. If it does, it could open up new potential for a significant decline, at which point we'll consider selling. Today's strategy is to sell if it rebounds to 63.80.
Trading Suggestions:
Crude oil: Sell around 63.80, target 61.80-60.00.

Crude Oil price breakout.Looking for Crude to break downward trend. Strong demand around the $61 level. Price action confirming. Looking for entry after break and price action confirmation.

MCX Crude Oil Futures – Intraday Analysis 7th Oct., 25MCX:CRUDEOIL1!
Crude Oil is trading at 5,489 after a choppy, range-bound session, with price action coiling near both the long entry (5,494) and neutral zone (5,491) pivots—signaling a breakout or breakdown is due.
Bullish Scenario
Long Entry (5,494):
Initiate fresh longs above 5,494 as intraday swing highs get taken out, backing a push toward higher resistance.
Add more above 5,483 if dips are bought and the trend stays intact, confirming a base.
Upside Targets:
5,549 (Target 1): First mapped resistance and supply for partial profit booking.
5,585 (Target 2): Further extension zone if strong momentum develops.
Stop Loss:
Use just below 5,472 (short entry), or progressively trail as price advances for risk control.
Bearish Scenario
Short Entry (5,472):
Shorts are viable below 5,472, marking breakdown of support and the likelihood of a move back toward recent lows.
Downside Targets:
5,433 (Target 1): Bounce/support area and first logical exit for shorts.
5,397 (Target 2): Next mapped extension if heavy selloff appears.
Stop Loss:
Cover shorts if price retakes 5,494 to avoid whipsaws.
Structure & Neutral Logic
Neutral Zone (5,491):
Choppy, indecisive trading around this level—wait for a decisive move above 5,494 or below 5,472 for directional setups.
As long as price oscillates this band, expect more sideways action.

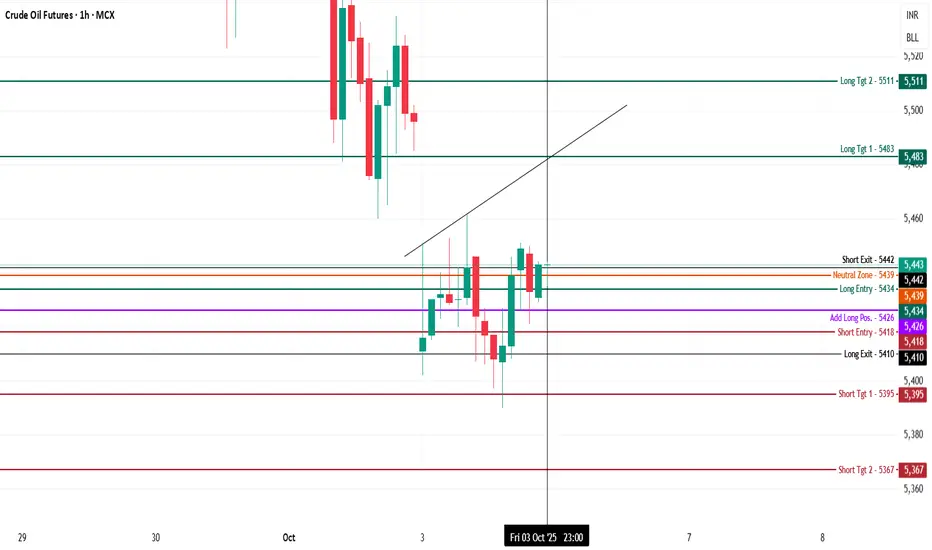
Crude Oil Futures (MCX) – Intraday Analysis - 6th Oct., 2025MCX:CRUDEOIL1!
Crude Oil is trading at 5,443 in a tight consolidation zone, oscillating between short-term support and resistance, with a neutral-to-slightly-bullish bias near the session high.
Bullish (Long) Setup
Long Entry (5,434):
Long positions can be initiated above 5,434 as the price consistently finds support here, creating a higher-low base.
Aggressive adds may be considered on strength above 5,426 (add-long band) if dips are supported with volume.
Upside Targets:
5,483 (Target 1): Key supply band and local swing high, where initial profit-booking is logical.
5,511 (Target 2): Extended target if momentum continues.
Stop Loss:
Keep stops just below 5,418, the immediate short entry zone, to guard against false breakouts.
Bearish (Short) Setup
Short Entry (5,418):
Short below 5,418, confirming breakdown of intraday support and flip toward sellers.
Downside Targets:
5,395 (Target 1): Major historical support and bounce area.
5,367 (Target 2): Deeper extension for continued weakness.
Stop Loss:
Cover shorts if price holds above 5,434, reducing exposure on failed break downs.
Neutral/Range Logic
Neutral Zone (5,439):
Acting as a pivot; price compressing here may result in whipsaw until a clear range breakout.
Wait for price acceptance above 5,443 or below 5,418 for trend alignment.
Lower Highs Signal Weakness: Crude Oil Bears Eye $61 Support
The recent attempt to rally stalled around $65–66, failing to break above the mid-Bollinger band resistance.
Multiple long upper wicks show selling pressure on rallies.
Price is moving closer to the lower band after failing to hold above the middle band.
The market shows weak upside momentum and dominant selling pressure.
As long as price stays below $65.50, bears maintain control.
If $61.00 support breaks, downside targets are $59.00, then $57.00.

61.74This channel is not providing individualized trading or investment advice, nor is it a banking service, brokerage service, trading service, investment service or money management service

WTI(20251002)Today's AnalysisMarket News:
At 8:15 PM Beijing time on Wednesday, U.S. ADP employment figures fell by 32,000 in September, the largest drop since March 2023 and the third decline in four months. This was below market expectations of 50,000 jobs, and the previous reading was revised down from 54,000 to -3,000.
After the data was released, U.S. Treasury yields fell, and spot gold saw little short-term movement. Traders increased their bets on two more Federal Reserve rate cuts this year. Interest rate swaps tied to the date of the upcoming Fed meeting indicate an expected rate cut of 46 basis points by year-end, compared to a 42 basis point estimate before the data was released.
Technical Analysis:
Today's Buy/Sell Levels:
61.81
Support and Resistance Levels:
63.26
62.72
62.36
61.25
60.90
60.36
Trading Strategy:
If the price breaks above 61.81, consider entering a buy position, with the first target price at 62.36.
If the price breaks below 61.25, consider entering a sell position, with the first target price at 60.90

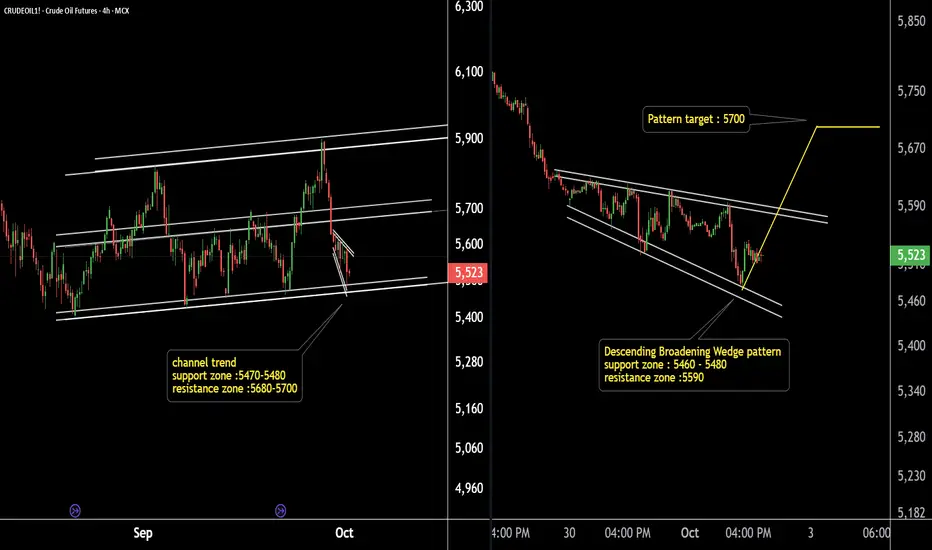
Crude Oil Ready to Explode ? Watch This Key Support Pattern!Crude Oil (4H & 15Min Chart) Analysis:
Crude Oil is moving within a well-defined parallel channel on the 4-hour timeframe, with a strong support zone at 5480–5490.
On the 15-minute chart, a descending broadening wedge is forming, with the pattern support zone also near 5480–5490 and pattern resistance around 5600.
Potential breakout target: 5700.
If the support zone holds, we may see higher prices in Crude Oil.
Summary: Key support at 5480–5490 is critical. Watch for a breakout above 5600 for a potential upside move toward 5700.
Thank you !!
Crude oil: Sell around 64.00, target 62.00-60.00Crude Oil Market Analysis:
We've said this many times before: sell crude oil when it rebounds. Don't be afraid. If it breaks through, we'll lose money, but if it doesn't, we'll make money every time. The daily chart and indicators haven't changed. This is still a correction after a sharp sell-off, encountering resistance. We need to look for rebounds during this correction to continue selling. Sell crude oil if it rebounds today at 64.00.
Fundamental Analysis:
Recent fundamentals revolve around the Federal Reserve's interest rate cuts. This week, we'll focus on two major data points: ADP and non-farm payrolls.
Trading Recommendations:
Crude oil: Sell around 64.00, target 62.00-60.00

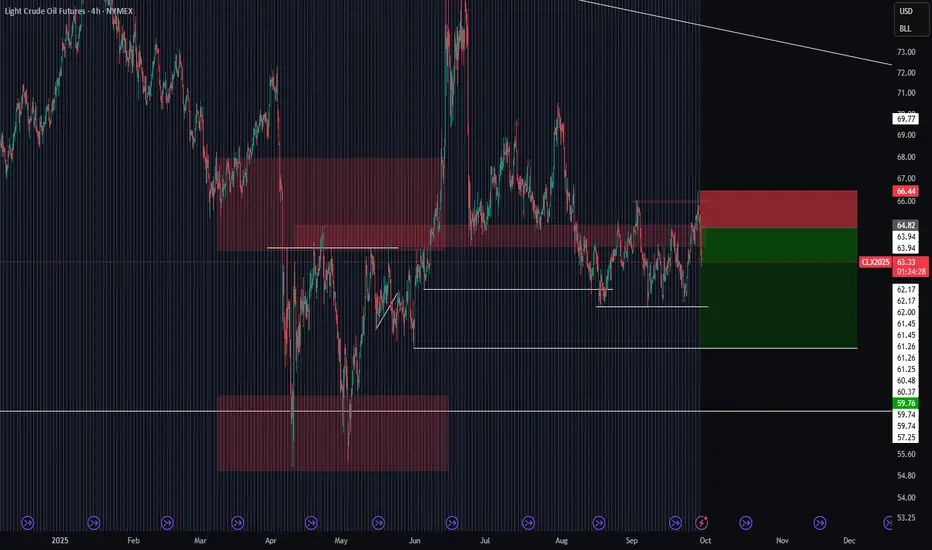
Light Crude Oil (CL) Elliott Wave Outlook Points to Lower PricesThe short-term Elliott Wave structure in crude oil indicates a downward cycle from the June 23, 2025, high, unfolding as a five-wave impulse. Wave 1 concluded at $61.45, and wave 2 rallied to $66.42, as shown on the 1-hour chart. Wave 2 developed as a regular flat structure. From wave 1’s low, wave ((a)) peaked at $64.76. Wave ((b)) fell to $61.85, and wave ((c)) advanced to $66.42, finalizing wave 2.
Oil now declines in wave 3, structured as an impulse. From wave 2’s high, wave (i) reached $64.87, and wave (ii) corrected to $65.40. Wave (iii) dropped to $62.98, followed by wave (iv) at $63.50. Oil should extend lower in wave (v) to complete wave ((i)) of 3. Afterward, a wave ((ii)) rally will likely adjust the decline from the September 26, 2025, high in a 3, 7, or 11-swing pattern before resuming downward. As long as the $66.42 pivot high remains intact, near-term rallies are expected to fail in a 3, 7, or 11-swing sequence, leading to further declines. This structure suggests oil faces continued bearish pressure in the short term, with limited upside potential unless the pivot breaks.

[CL] USOIL Trade ideaI can even see a target much lower but fondamentally for now I am not sure it will be reasonable ... let's adapt to the market conditions.
Great Trade !
crudeoil probable price movements crudeoil is at key levels.
1. if rejected from the levels may test lower levels
2. if crosses above may touch upper levels

Crude oil - Sell around 65.20, target 63.00-61.00Crude Oil Market Analysis:
Crude oil has recently begun to surge higher, reaching around 65.40. Selling crude oil on the spot is recommended. Crude oil has reached the upper limit of the range, a level that has been repeatedly tested in recent trading. The recent range for crude oil is 66.00-60.00. We maintain a bearish outlook for the daily chart.
Fundamental Analysis:
This week's fundamentals have limited impact on the market. The US dollar has also begun to fluctuate. The market awaits new data to drive it. The Federal Reserve's interest rate cuts in October remain a key focus.
Trading Recommendations:
Crude oil - Sell around 65.20, target 63.00-61.00

Crude Oil Target LongStrong Buy until Daily Bearish FVG
With news on Russia cuts fuel exports, Crude Oil is expected to continue Bullish during US AM sessions.
Expected a manipulation during london session.

Crude oil: Sell around 64.90, target 63.00-61.00Crude Oil Market Analysis:
The rise in crude oil prices has left many investors confused. Shouldn't they be selling crude oil? Why is it so strong again? A look at the 4-hour candlestick chart will show that the current rally is still within a range of fluctuations and hasn't broken out. Furthermore, the range-bound resistance level is approaching again. It's a good time to sell immediately. The overall trend for crude oil is bearish, and short-term volatility recovery is expected.
Fundamental Analysis:
Gold surged and then retreated, while the US dollar rebounded sharply after hitting a bottom. No major market data was released, and the Fed's policy has no sustained impact on the market in the short term.
Trading Recommendations:
Crude oil: Sell around 64.90, target 63.00-61.00

57.50This channel is not providing individualized trading or investment advice, nor is it a banking service, brokerage service, trading service, investment service or money management service


Crude oi bullish I've noticed this extended consolidation and a triangle pattern developing, and with all the volume during the pullbacks, I feel like we might see a break in the next few days.

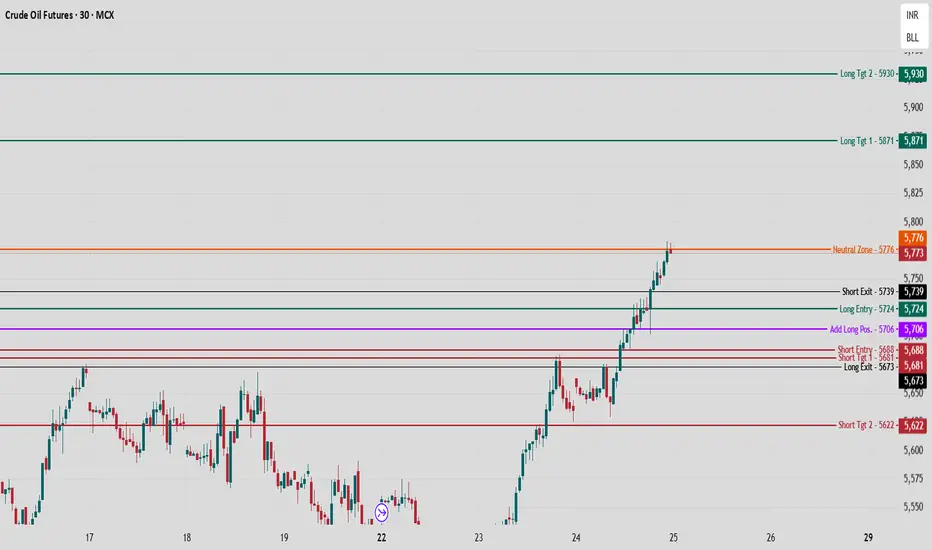
Crude Oil MCX Future - Intraday Technical Analysis - 25 Sept. 25MCX:CRUDEOIL1!
Crude Oil is consolidating at 5,773 after an extended rally, now testing key resistance in the neutral zone.
Bullish Scenario (Long Logic)
Long Entry (5,724):
Enter long above 5,724 as the breakout confirms strength above previous resistance-turned-support and continues the higher low structure seen in recent hours.
Add further positions near 5,706 on pullbacks with rising trend confirmation.
Upside Targets:
5,871 (Target 1): Marks the first major supply area and likely point of profit booking if momentum sustains.
5,930 (Target 2): Final mapped extension, corresponding to recent session highs and an upper channel resistance.
Stop Loss:
Place below 5,706 or tighten to 5,688 to minimize downside on failed break below intraday support.
Bearish Scenario (Short Logic)
Short Entry (5,688):
Enter short under 5,688 as it confirms a breakdown below key support with a lower low setup.
Downside Targets:
5,681 (Target 1): Previous bounce region, often a short-term reversal or covering spot.
5,622 (Target 2): Deeper demand, potential extension if selling pressure accelerates.
Stop Loss:
Cover shorts above 5,724 as that signals failed breakdown and likely reversal.
Neutral/Structure Logic
Neutral Zone (5,776):
Price here indicates indecision; best to avoid fresh positions until a decisive breakout or breakdown.
Sustained close above means bulls remain in control; below 5,724 means a retracement setup is active.
Follow Chart Pathik for more such updates.
Crude oil futures probable price movementsCrude oil futures probable price movements. we can see an up movement in price above the levels

CrudeOil - Long TradeCrudeOil - Long Trade
After this compression, price has break resistence zone and can have a potential final rally
Final 5 wave is on going
