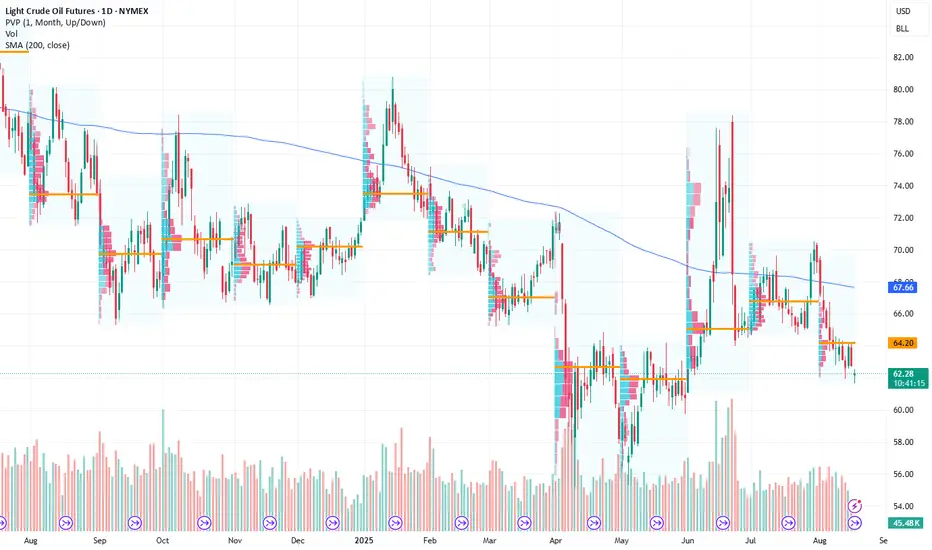
Crude Oil Retesting Key Support: Is a Reversal Imminent? Current Price: $62.8
Direction: LONG
Targets:
- T1 = $65.2
- T2 = $68.5
Stop Levels:
- S1 = $60.5
- S2 = $58.9
**Wisdom of Professional Traders:**
This analysis synthesizes insights from thousands of professional traders and market experts, leveraging collective intelligence to identify high-probability trade setups. Traders with years of experience in commodity markets have noted that Crude Oil often displays predictable price behavior around key technical levels, providing opportunities for well-timed entries. The collective opinion focuses on the importance of geopolitical events, inventory data, and technical demand zones that could shape the next move for Crude Oil.
**Key Insights:**
Recent market action suggests that Crude Oil is testing historical support levels near $62.0-$63.0, widely considered a demand zone by traders familiar with long-term price patterns. These levels have coincided with prior reversals, where bullish momentum emerged after extended corrections. With Brent and WTI futures aligning on a moderate bullish outlook, traders are capitalizing on divergences in the Relative Strength Index (RSI) and oversold conditions.
The market fundamentals remain in focus, with supply constraints from production cuts in major OPEC countries and tightening reserves due to export bans. On the demand side, a pickup in industrial activity in China, combined with steady global aviation fuel consumption, has recently supported crude oil prices. Additionally, the U.S. dollar has shown minor declines, easing pressure on dollar-denominated commodities like oil.
**Recent Performance:**
Crude Oil has witnessed a multi-week correction from highs in the $70 range, reflecting a pullback in anticipation of rising global interest rates. Over the last two weeks, however, prices have stabilized between $62.0 and $64.0 levels, with intraday volatility driven by inventory releases and remarks from OPEC officials. While the downward trajectory has dampened investor sentiment, price consolidation hints at strengthening support capable of generating a rebound.
**Expert Analysis:**
Technical analysis highlights the importance of a bullish crossover observed in the MACD histogram, suggesting growing upward momentum as bearish volumes taper out. Crude Oil also shows signs of a near-perfect Fibonacci retracement to the 61.8% level from its recent uptrend, reinforcing probabilities for a reversal. Experts stress that maintaining above $62.0 is critical, and a breakout above $65.0 could re-establish broader bullish sentiment as near-term resistance weakens.
From fundamental perspectives, analysts underline upcoming geopolitical developments like the Russia-Ukraine conflict, Middle East tensions, and U.S. reserve release strategies as potential catalysts for price movement. A tighter global crude inventory balance supports long positions as energy demand grows in the coming quarter.
**News Impact:**
Recent headlines reporting OPEC's continued adherence to production cuts, combined with rumors of extended strategic petroleum reserve releases from the U.S., create a mixed trading backdrop. However, China's recovery post-pandemic lockdowns fuels strong optimism for Crude Oil as key demand expectations rise in Q4. Any renewed supply disruptions from geopolitical events could inject volatility, emphasizing the importance of strategic stop levels for traders taking new positions.
**Trading Recommendation:**
Based on combined technical, fundamental, and sentiment analysis, initiating a LONG position on Crude Oil at current levels ($62.8) aligns with a high-probability scenario for reversal. Tight stop losses below $60.5 provide controlled risk exposure while targeting resistance at $65.2 and potentially $68.5. Traders should monitor inventory data and OPEC announcements for further clarity. Crude Oil's rebound potential makes this an opportunistic setup for bullish positions in the short-to-medium term.
Do you want to save hours every week?
WS2! trade ideas
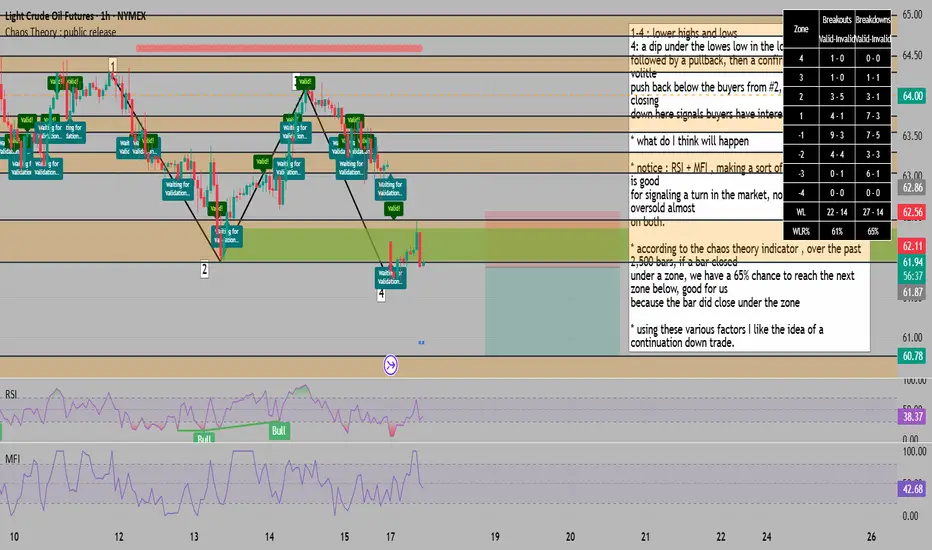
downtrend continuation confirmed on the hourly for the next leg1-4 : lower highs and lows
4: a dip under the lowes low in the local structure ,
followed by a pullback, then a confirmation STRONG volitle
push back below the buyers from #2, for me the candle closing
down here signals buyers have interest
* what do I think will happen
* notice : RSI + MFI , making a sort of triangle shape, this is good
for signaling a turn in the market, not to mention oversold almost
on both.
* according to the chaos theory indicator , over the past 2,500 bars, if a bar closed
under a zone, we have a 65% chance to reach the next zone below, good for us
because the bar did close under the zone
* using these various factors I like the idea of a continuation down trade.
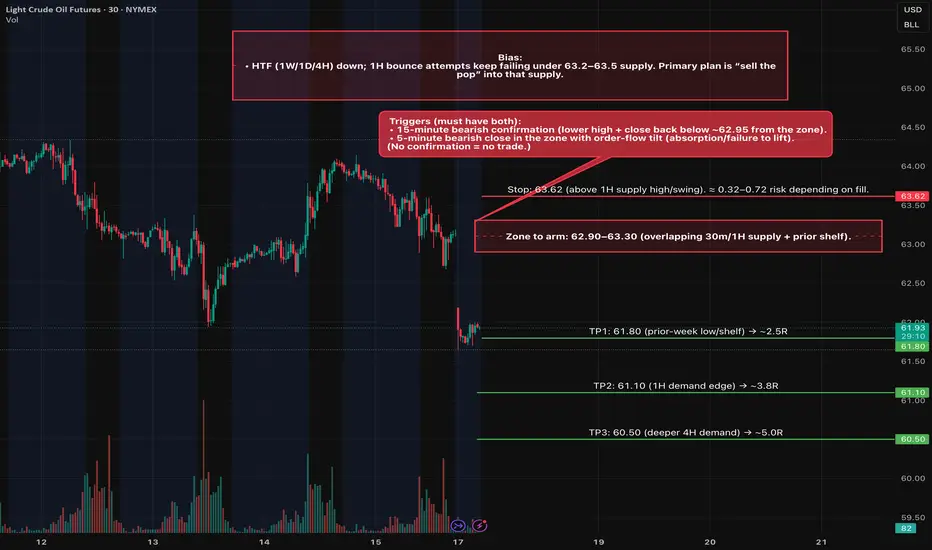
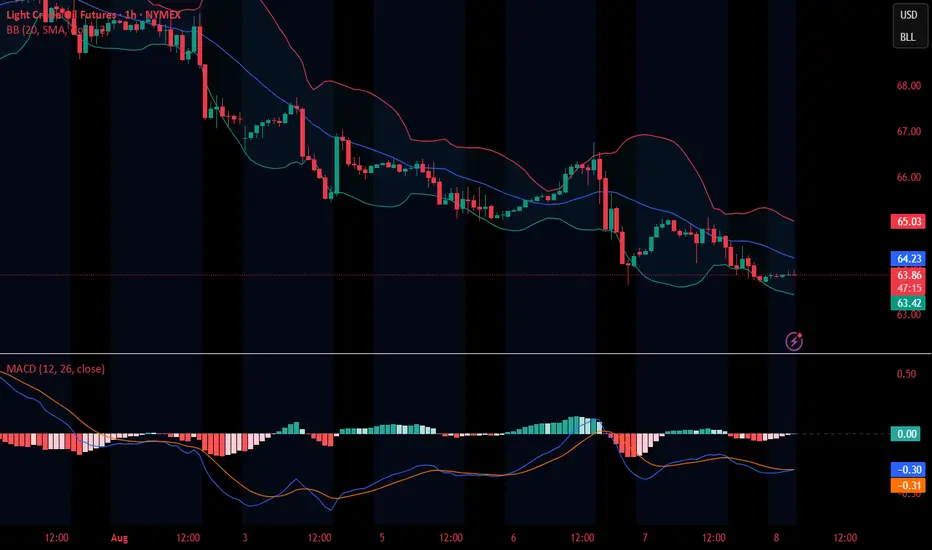
CL (Oil Futures) Short Trade Idea 08/17Setup
• Type: Rejection of 4H/1H supply → continuation lower.
• Zone to arm: 62.90–63.30 (overlapping 30m/1H supply + prior shelf).
• Triggers (must have both):
• 15-minute bearish confirmation (lower high + close back below ~62.95 from the zone).
• 5-minute bearish close in the zone with order-flow tilt (absorption/failure to lift).
(No confirmation = no trade.)
Entry & Risk
• Entry: MOS on the confirming 5m close within 62.90–63.30.
• Stop: 63.62 (above 1H supply high/swing). ≈ 0.32–0.72 risk depending on fill.
• Size: Calibrate so full-stop loss = ≤ 1R of your plan.
Targets (R:R from 63.10 mid-entry, 0.52 stop)
• TP1: 61.80 (prior-week low/shelf) → ~2.5R
• TP2: 61.10 (1H demand edge) → ~3.8R
• TP3: 60.50 (deeper 4H demand) → ~5.0R
Management
• Scale 1/2 at TP1; trail above last 5m swing after a fresh LL or hold for TP2.
• If price tags 63.30–63.50 and closes 15m above 63.50, invalidate the short idea until structure resets.
• Avoid fresh risk within ~10–15 min of EIA Wed 10:30 ET; re-arm after the first post-release 15m bar closes.
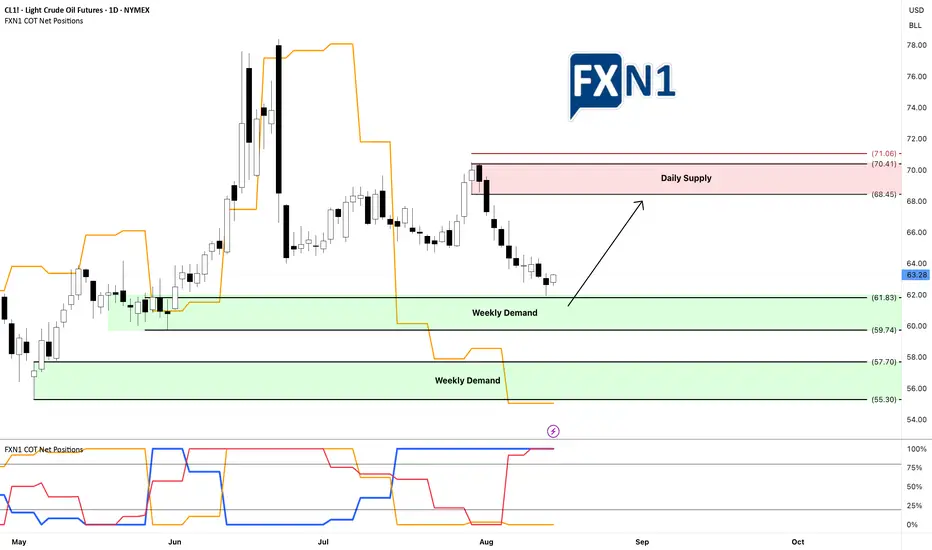
Oil Market Insights: Demand Zones and Future FundamentalsYesterday, CL1! oil tested and rebounded from my weekly demand zone without triggering my entry, resulting in a missed opportunity for several points. This suggests to me that there is buying interest at this level, regardless of the fact that non-commercial traders are short. I am now looking for a retest of this area—if I'm fortunate—to enter a long position. I am also awaiting the new COT data tomorrow to assess any potential shifts in fundamentals. Additionally, I am considering the presence of a stronger demand zone below, which appears even more promising. We'll see how it unfolds.
✅ Please share your thoughts about CL1! in the comments section below and HIT LIKE if you appreciate my analysis. Don't forget to FOLLOW ME; you will help us a lot with this small contribution.
Crude Oil Bearish and Bullish scenarios for the weekCrude Oil can go both directions this week depending on the price we hit in the start of the week.
Patience Patience Patience!!!!

ID: 2025 - 0146.16.2025
Trade #14 of 2025 executed.
Trade entry at 60 DTE (days to expiration).
BULLISH options trade executed on Crude Oil. Once price level of $75.00 gets taken out, this trade will get adjusted to secure a risk-free trade. Targets will be 100% ROI based upon this being a balanced bullish butterfly construct.
Defined risk
Defined reward
Happy Trading!
-kevin

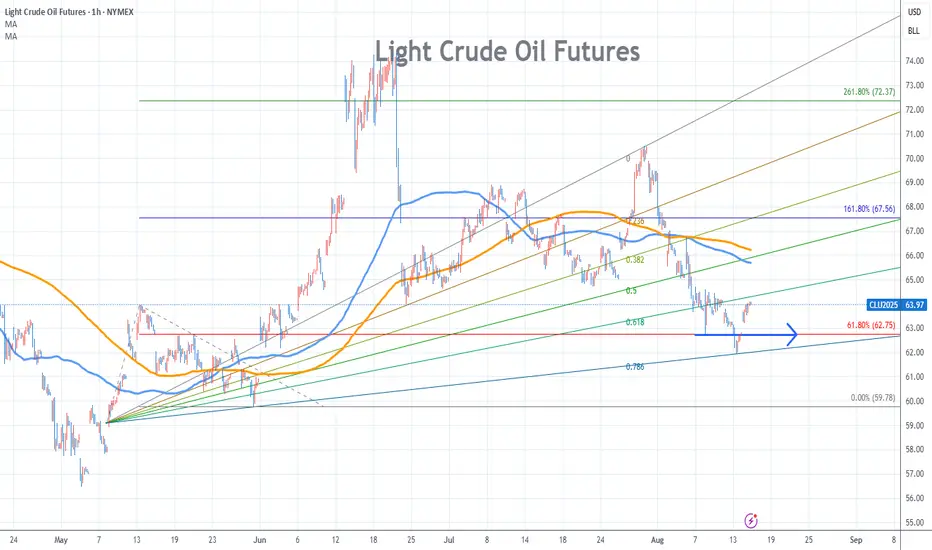
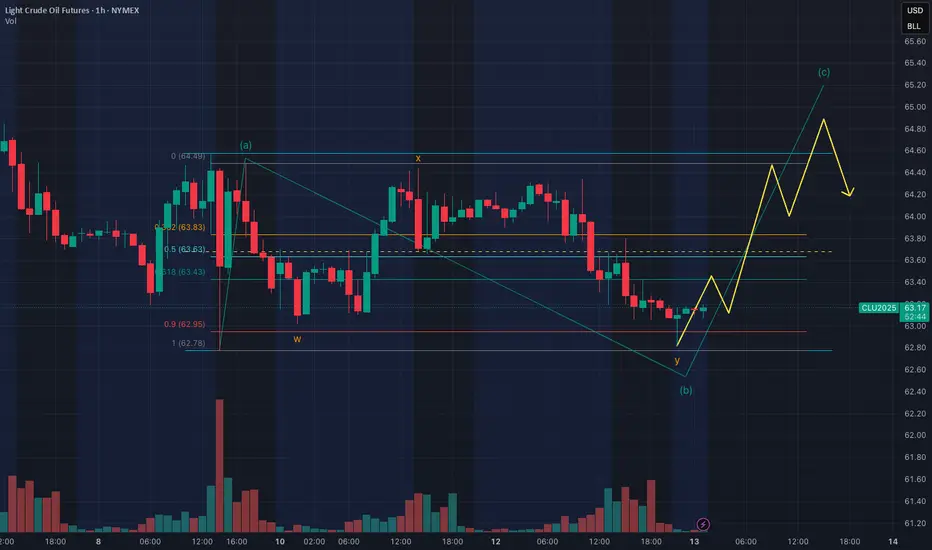
Light Crude Oil Futures Stock Chart Fibonacci Analysis 081425Trading Idea
1) Find a FIBO slingshot
2) Check FIBO 61.80% level
3) Entry Point > 63/61.80%
Chart time frame:B
A) 15 min(1W-3M)
B) 1 hr(3M-6M)
C) 4 hr(6M-1year)
D) 1 day(1-3years)
Stock progress:A
A) Keep rising over 61.80% resistance
B) 61.80% resistance
C) 61.80% support
D) Hit the bottom
E) Hit the top
Stocks rise as they rise from support and fall from resistance. Our goal is to find a low support point and enter. It can be referred to as buying at the pullback point. The pullback point can be found with a Fibonacci extension of 61.80%. This is a step to find entry level. 1) Find a triangle (Fibonacci Speed Fan Line) that connects the high (resistance) and low (support) points of the stock in progress, where it is continuously expressed as a Slingshot, 2) and create a Fibonacci extension level for the first rising wave from the start point of slingshot pattern.
When the current price goes over 61.80% level , that can be a good entry point, especially if the SMA 100 and 200 curves are gathered together at 61.80%, it is a very good entry point.
As a great help, tradingview provides these Fibonacci speed fan lines and extension levels with ease. So if you use the Fibonacci fan line, the extension level, and the SMA 100/200 curve well, you can find an entry point for the stock market. At least you have to enter at this low point to avoid trading failure, and if you are skilled at entering this low point, with fibonacci6180 technique, your reading skill to chart will be greatly improved.
If you want to do day trading, please set the time frame to 5 minutes or 15 minutes, and you will see many of the low point of rising stocks.
If you want to prefer long term range trading, you can set the time frame to 1 hr or 1 day.
Crude Levels (Non-Updated but still reactive)Just wanted to share my crude levels. Drew alot of these months ago and haven't adjusted alot of them...especially the boxes but general areas identified still seem to be reactive.
Will update these eventually, but not sure this will be a living chart once published.
~The Villain
Crude Levels (Non-Updated but still reactive)Just wanted to share my crude levels. Drew alot of these months ago and haven't adjusted alot of them...especially the boxes but general areas identified still seem to be reactive.
~The Villain
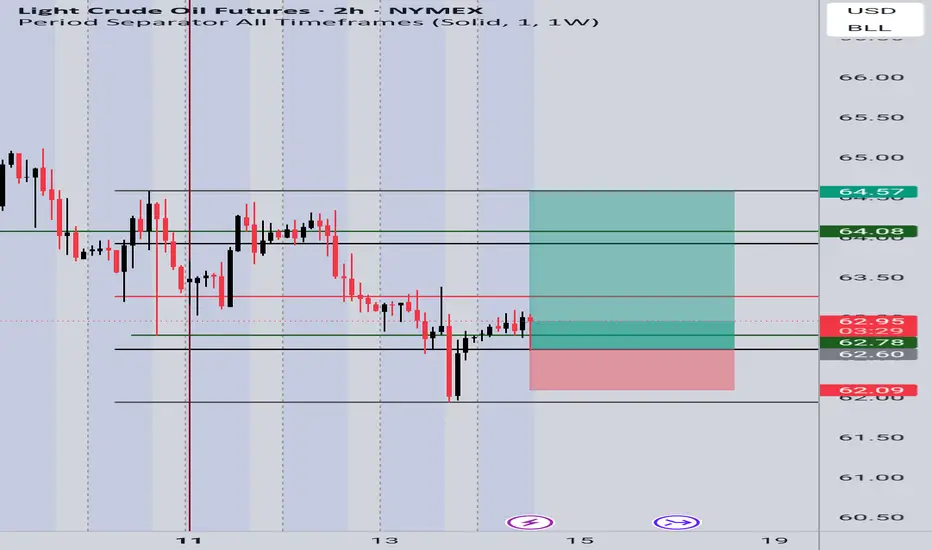
CL1! Long Setup – Recovery BounceBias: Bullish
Reasoning:
Demand zone respected – Price reacted strongly from the 62.00 – 62.20 support zone, forming a bullish rejection wick.
Liquidity sweep – The recent dip below support grabbed liquidity before reversing upward, signaling possible continuation.
Higher timeframe confluence – On the daily, crude oil remains in a broader accumulation phase with buyers stepping in at key support.
Risk-to-Reward setup – Entry near 62.70 – 62.90, targeting higher resistance zones, gives a favorable R:R.
Entry: 62.70 – 62.90
Stop Loss (SL): 62.00 (below liquidity sweep)
Target 1 (TP1): 64.08
Target 2 (TP2): 64.57
📈 Plan: Looking for price to push higher as long as it holds above 62.00 support.
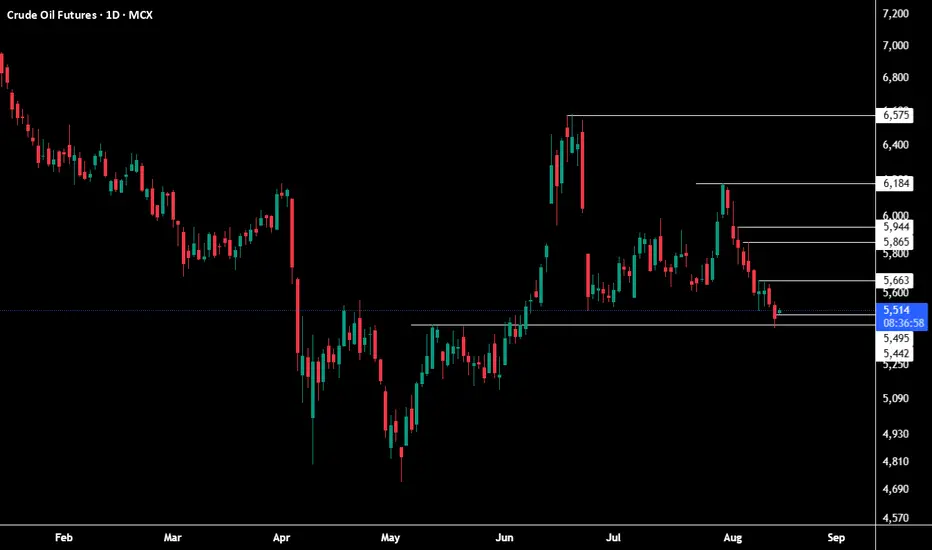
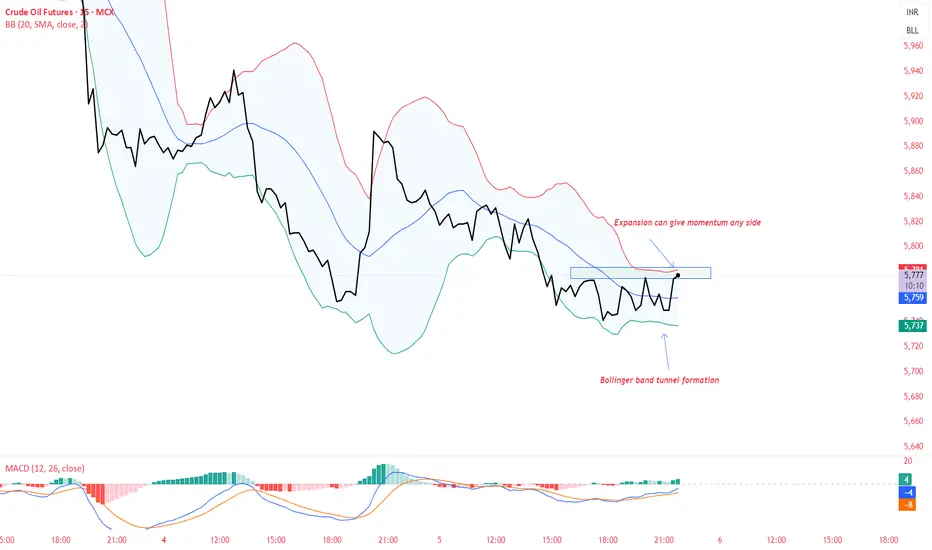
CRUDE OIL FUTURES ## Views on the Crude Oil Futures Chart (MCX)
This chart represents daily price action for *Crude Oil Futures* on MCX as of August 14, 2025. Here are some key observations and insights:
### Price Action & Trend
- The trend since February shows an initial *downward movement, followed by a significant **reversal and uptrend* from late April to June.
- After peaking above 6,500 in June, prices have retraced and entered a *sideways/consolidation phase*.
### Key Technical Levels
- *Support levels*: 5,506 (current), 5,495, and 5,442. Price is currently testing a major horizontal support zone. A breakdown below these could trigger further bearish momentum.
- *Resistance levels*: 5,663, 5,800, 5,865, 5,944, 6,184, 6,575. These are potential areas where price may pause or reverse on an upward move.
### Candlestick Analysis
- The latest candle signifies a bounce off the 5,506 support with slight bullish intent (close is above open), but there’s visible bearish pressure in recent sessions.
### Volume & Sentiment
- Volume for the session stands at 5.04K—slightly increased, indicating active participation around this key support level.
### Summary & Outlook
- If prices sustain above the *5,500 support zone*, a rebound towards 5,663 and higher resistance levels is possible.
- If the 5,500 zone fails, expect a move towards lower supports at 5,495 and 5,442.
- Watch for strong bullish candles or volume spikes to confirm any reversal.
*Note:* This analysis is graphical and technical in nature. Actual trading decisions should account for broader market context and news events, as technical levels can be invalidated quickly in volatile markets.
Crude Oil completing a Regular Flat CorrectionCrude Oil bottomed out from a major down move last Friday and began a slow consolidation process which I believe will turn into a Regular Flat correction with Wave B completed a few hours ago. Wave B fell within the range of 90 to 105% of A giving a Regular term vs an expanded or running flat. Wave C will need to finish above the top of Wave A and will likely be of similar length. I expect the completed of Wave C to be pretty quick relative to the slow consolidation of the previous B Wave. Once Wave C is completed, I expect price to continue downward likely into the 50's.
crude long ideacrudeoil futures india mcx to take a support at 4 th wave base correction , should be a good buy setup , as this levels hold premiums as per price levels are.
to continue upside, always first attempt at major levels respects

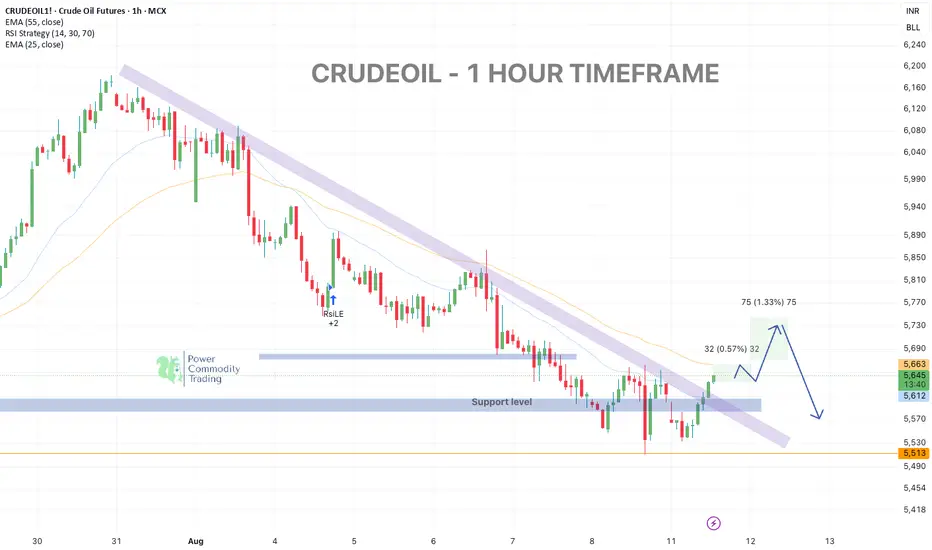
Crude Oil – Retesting Resistance | Possible Pullback Trade Setu
Crude Oil (1H timeframe)
broken out from its short-term downtrend channel and is now retesting key resistance near 5740.
Price is holding above the 5610 support, but upside is likely capped unless bulls sustain momentum.
🔹 Key Levels:
• Resistance: 5740 – 5770
• Support: 5610 → 5513
📊 Technical View & Trade Plan:
• Sell Zone: 5730 – 5770 (near trendline resistance)
• Stop Loss: Above 5800
• Target 1: 5610
• Target 2: 5513
💡 Next Scenario:
• If price breaks & sustains above 5800, bullish momentum could extend toward 5860 – 5900.
• If rejection happens at resistance, expect a pullback toward 5610 and possibly 5513.
Bias: Neutral to Bearish — waiting for price reaction at resistance to confirm the next move.
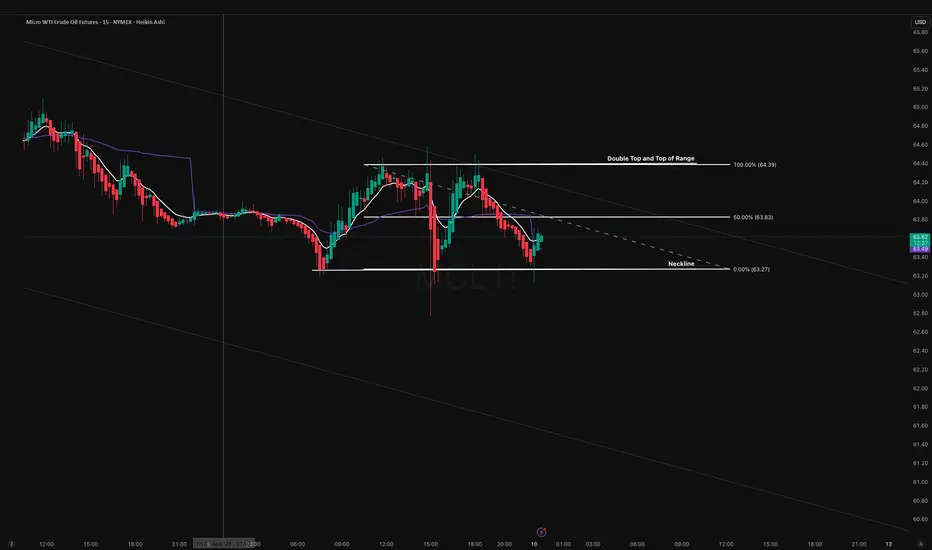
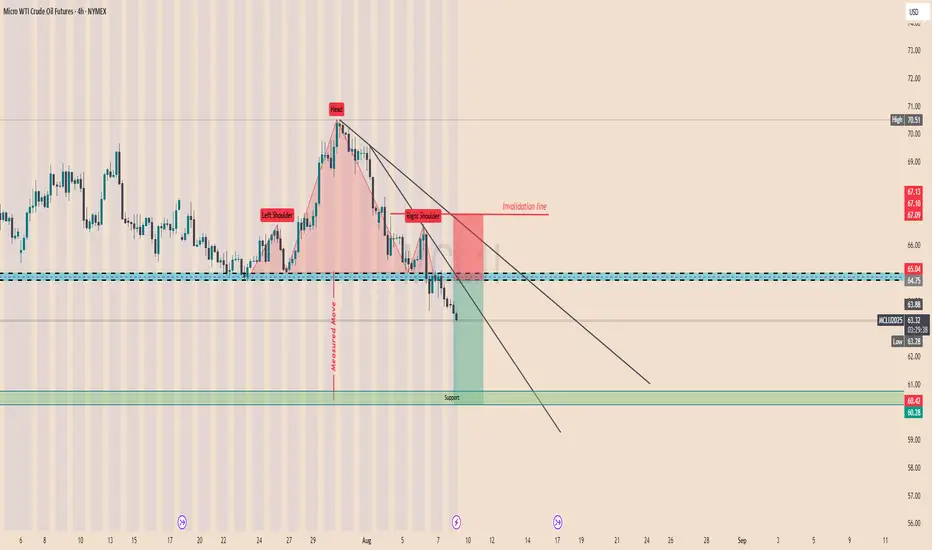
MCL About to Take the Express Elevator DownOn the 15-min chart, MCL has completed a clean double top at 64.50, with neckline support broken at 63.00. This pattern is forming within a broader descending channel, adding higher-timeframe confluence for further downside.
Bearish Scenario (Primary Bias – 70% Probability)
- Entry Zone: 63.80–64.00 retest of broken neckline
- Stop Loss: 64.20 (above retest high)
- Target 1: 62.50 (recent swing low / intraday liquidity pocket)
- Target 2: 61.50 (lower channel boundary)
- Target 3: 60.80 (HTF measured move from double top)
Technical confluence:
Pattern completion, retest rejection, descending channel structure, macro trend alignment.
Bullish Invalidator (30% Probability)
A sustained reclaim of 64.20 with volume would invalidate the breakdown, likely triggering a short squeeze back into 64.50–64.70. This scenario is less likely without a macro catalyst during Tokyo liquidity, but remains a risk consideration.
The Tokyo open often sees thin liquidity in oil futures, meaning stop hunts above retest zones are common. Patience is key wait for rejection confirmation before entering short.
Bearish unless we see a confirmed reclaim and hold above 64.20. Short from 63.80–64.00 offers a high R:R toward the 62.50–60.80 range.
CL Futures update August 2025 All the charts I have done in CL this year has a defined range on higher timeframes and nothing has changed.
Markets prefer selling sharp moves higher for now and think the song remains the same.

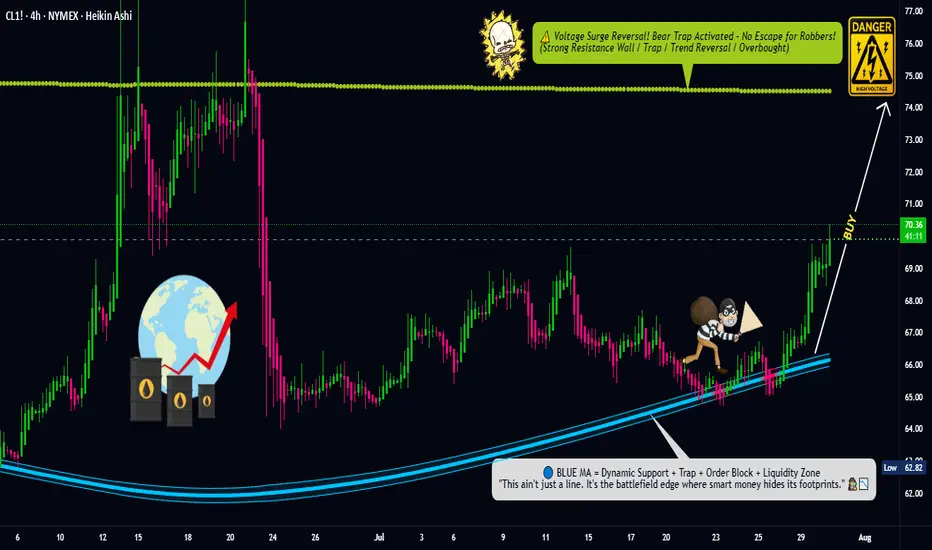
Oil Trap Activated – Limit Orders Set for the Big Score💥🛢️Crude Oil Vault Breach Plan – DCA Heist Begins!🧨💰
🚨Asset: CL1!
📈Bias: BULLISH RAID MODE ON
🎯Target: $74.50
🛡️Stop Loss: $67.50
🔑Entry: ANY LEVEL – Thief stacking limit orders like layers of gold bars 💼⚖️ (DCA Mode Activated)
🕵️♂️Thief Trader is not chasing, we're ambushing 🧠 — scaling in smart with multiple limit traps. The crew never FOMOs, we trap the market 🎯.
💣This is a layered loot plan, not for weak hands. Watch how we load up quietly while market sleeps 😴, then hit hard when the vault cracks open 🔐.
Support this heist by smashing that ❤️LIKE button
💬 Comment your plans below & join the real thief squad
🤝 Together we rob the market — LEGALLY & LOGICALLY
#ThiefTrader #OilHeist #CL1 #BullishTrap #DCA #CrudeOilStrategy #SmartMoneyPlay #MarketRobbery #TeamLoot #NoRetailPanic
Retrospect- bearish head and shoulders pattern on OIL.Bearish price action and trading below the 50 and 200 SMA and the 9 and 20 EMA. Looking for a turnaround.
CRUDEOIL - BOLLINGER BAND TUNNEL FORMATIONCrudeoil seems bullish for 5900-5940-5980-6000
Dip till 5630 strong support
Do your own research before taking any trades
MCL1 Head and Shoulder Pattern! H&S price retested neckline a few times and no closed below it heading to first support at 63.6 then > 60.80 and possible extension to 57.8
Crude oil: Sell around 66.50, targeting 63.00-60.00Crude Oil Market Analysis:
We've stated this dozens of times before: the overall trend of crude oil is bearish. As long as crude oil doesn't break above 70.00, we can maintain our bearish outlook. Today, we maintain our bearish outlook and continue to sell on any rebounds. Crude oil fundamentals don't support buying. The previous easing of tensions in the Middle East has also been suppressing crude oil prices for a long time, and the ever-changing tariff war is also suppressing crude oil. However, crude oil hasn't broken through 63.00 yet. Today, we're focused on selling if it breaks through. If it doesn't, we'll wait for a small rebound to sell. Focus on selling at 66.50.
Fundamental Analysis:
The tariff war has been the most influential fundamental factor affecting gold recently, and in the long term, it supports gold. This surge in gold prices is driven by Trump's renewed turmoil. Furthermore, the Federal Reserve's future monetary policy remains a key focus.
Trading Strategy:
Crude oil: Sell around 66.50, targeting 63.00-60.00.

WTI(20250808)Today's AnalysisMarket News:
① Trump nominated Stephen Milan, Chairman of the White House Council of Economic Advisers, to serve on the Federal Reserve Board, with a term ending January 31, 2026.
② Waller is reportedly a leading candidate for the next Fed Chair.
③ U.S. Treasury Secretary Bensont stated that the interview process for the Fed Chair has begun.
④ Bostic stated that the July jobs report did change the Fed's outlook on its employment goals.
Technical Analysis:
Today's Buy/Sell Levels:
63.55
Support and Resistance Levels:
64.86
64.37
64.06
63.05
62.73
62.24
Trading Strategy:
If the price breaks above 63.55, consider entering a buy position, with the first target price being 64.06.
If the price breaks below 63.05, consider entering a sell position, with the first target price being 62.73.
CRUDE OILPreferably suitable for scalping and accurate as long as you watch carefully the price action with the drawn areas.
With your likes and comments, you give me enough energy to provide the best analysis on an ongoing basis.
And if you needed any analysis that was not on the page, you can ask me with a comment or a personal message.
Enjoy Trading ;)
