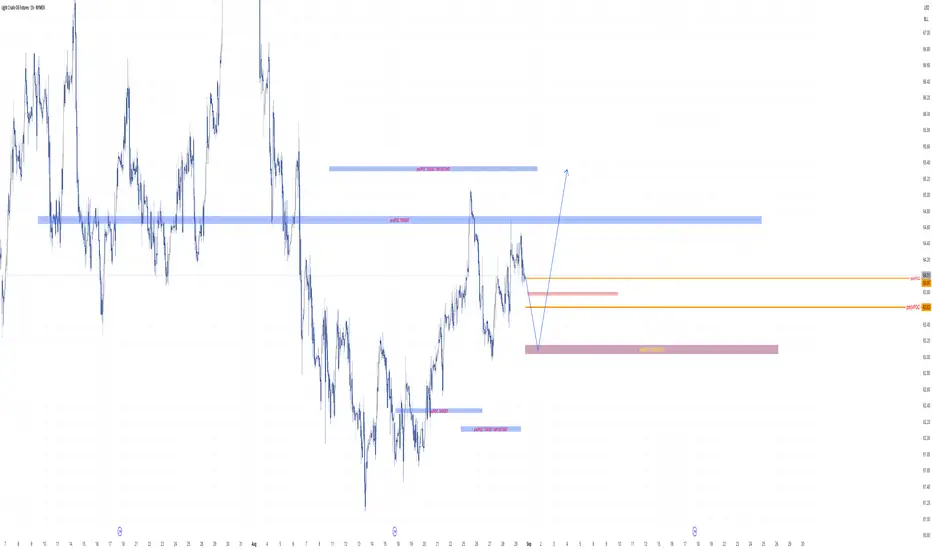
Bullish on Oil week 01-07/09 2025Will wait to see price reach and react from the previous month POC. That should be the play off the week. Bullish setups only. I the week starts going higher we should expect for this to reverse in the middle of the month.
QMN2020 trade ideas
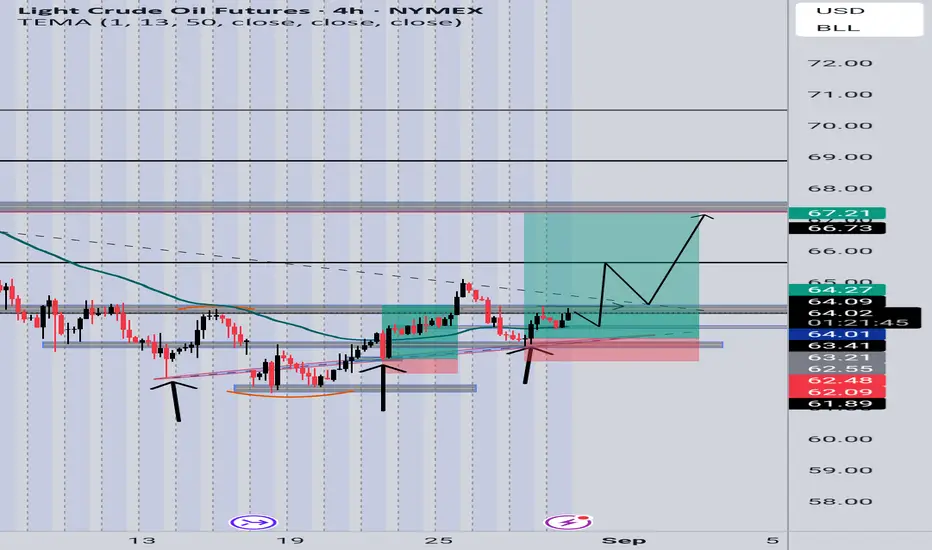
CL1! 4H | Bullish Setup
Price has respected multiple bullish structures and key demand zones. Strong higher lows with clean breaks of internal structure.
If theris pullback before continuation to the upside then can add entries
Entry: 64.03 (re-entry)
SL: 62.55
TP: 67.21
R:R ≈ 2.5
Final target aligns with previous supply and imbalance fill. Monitoring reaction around 66.70 zone for partials
WTI Crude Oil Trading Analysis: 02-September-2025Week Ahead Plan: September 2-6, 2025
Analysis Period : August 26-30, 2025 Review | September 2-6, 2025 Outlook
Market : WTI Crude Oil Futures (CL1!)
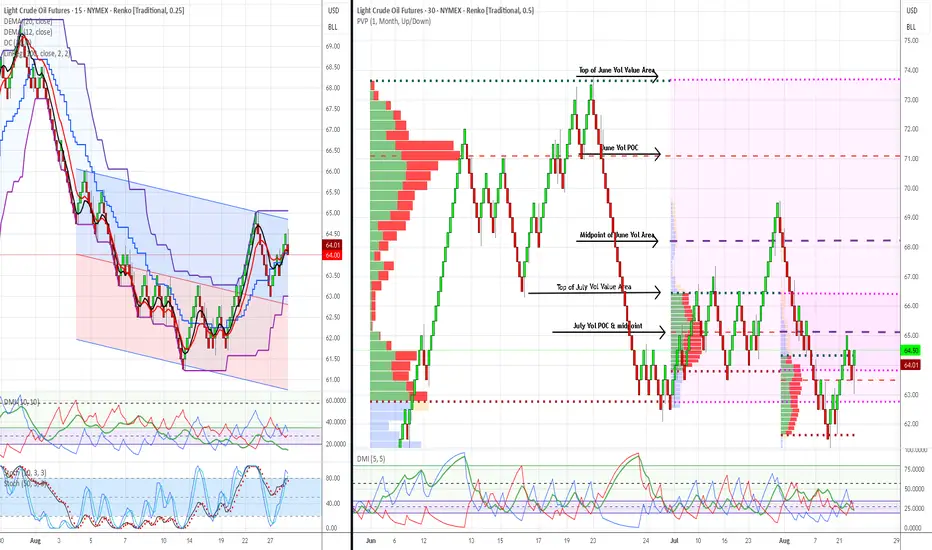
Methodology : Dual Renko Chart System ($0.25/15min + $0.50/30min)
Current Price : $64.00 (August 30, 2025)
________________________________________
Strategic Outlook & Market Setup
Primary Scenario (70% Probability): Pullback First, Then Recovery
What to Expect : Market opens lower Tuesday ($63.00-63.50 range) due to bearish signal on short-term chart. This creates a buying opportunity if support holds.
Trading Plan:
Tuesday Opening : Expect gap down - don't panic, this was anticipated
Buy Zone : Look for entries between $62.00-63.50 (strong institutional support)
Confirmation Needed : Wait for short-term trend to flip bullish again before buying
Target : Still aiming for $66.50 but may take extra 3-5 days to get there
Secondary Scenario (25% Probability): Sideways Consolidation
What to Expect : Market trades in $63.50-64.50 range for several days while technical signals realign.
Trading Plan:
Strategy: Be patient - don't force trades in choppy conditions
Wait For: Clear breakout above $64.50 with volume
Risk: Could waste 1-2 weeks in sideways action
Low Probability Scenario (5% Probability): Immediate Continuation Up
What to Expect : Market gaps up above $64.25 and keeps rising.
Trading Plan:
Verify: Make sure both short-term and long-term signals turn bullish
Caution: Be skeptical without strong volume confirmation
Action: Can buy but use smaller position sizes until confirmed
________________________________________
Market Risk Factors & Monitoring
Critical Support Level : $62.00
Why Important: Massive institutional buying occurred here - if it breaks, the bullish case is dead
Action If Broken: Exit all long positions immediately, wait for new setup
Probability of Break: Low (15%) but must be respected
Key Events This Week :
Tuesday: ISM Services data (economic health indicator)
Wednesday: Weekly oil inventory report (could cause volatility)
Friday: Jobs report (affects overall market sentiment)
Warning Signs to Watch:
Technical: Short-term trend staying bearish for more than 3 days
Volume: Declining volume on any bounce attempts
Support: Any trading below $62.50 for extended periods
Time: No progress toward $66.50 target within 10 total trading days
Positive Signs to Look For :
Technical: Short-term trend flipping back to bullish (key confirmation)
Volume: Above-average volume on any recovery moves
Support: Strong buying interest at $62-63 zone
Momentum: Clean breakout above $64.50 with follow-through
________________________________________
Forward-Looking Adjustments
Modified Risk Management :
Position Size: Use 50% of normal position size until both timeframes align bullish
Stop Loss: Tighter stops at $62.75 (just below support zone)
Entry Patience: Don't chase - wait for pullback to support levels
Profit Taking: Be more aggressive taking profits at first target ($66.50)
Revised Entry Strategy:
Before Buying, Confirm ALL Three:
Price: Trading at or near $62-63 support zone
Technical: Short-term trend signal flips back to bullish
Volume: Above-average buying interest visible
Timeline Expectations :
Days 1-3: Expect pullback/consolidation phase
Days 4-5: Look for bullish confirmation signals
Days 6-10: Resume advance toward $66.50 target if signals align
Beyond Day 10: If no progress, reassess entire strategy
Success Metrics:
Minimum Goal: Protect capital during pullback phase
Primary Target: $66.50 within 2 weeks (revised from 1 week)
Risk Limit: Maximum 2% account loss if support fails
Time Limit: Exit strategy if no directional progress within 10 days total
Simplified Decision Framework :
Green Light to Buy: Price near $62-63 + Short-term trend bullish + Good volume Yellow Light (Wait): Mixed signals, choppy price action, low volume
Red Light (Exit): Price below $62, bearish trend continuing, time limit exceeded
________________________________________
Bottom Line : The bigger picture remains bullish, but short-term signals suggest a pullback first. Use any weakness to $62-63 as a buying opportunity, but only with proper confirmation. Be patient - the setup is still valid but timing may be delayed by a few days.
________________________________________
Document Classification : Trading Analysis
Next Update : September 6, 2025 (Weekly Review)
Risk Level : Moderate (controlled institutional setup)
This analysis represents continued validation of a systematic, institutional-grade trading methodology with demonstrated predictive accuracy and risk control capabilities. This is a view that represents possible scenarios but ultimate responsibility is with each individual trader.
Risk Disclaimer: Past performance does not guarantee future results. All trading involves risk of loss.
return to proven buyers presents trend continuation opportunity 1->3 : higher high , number 2 proven buyers
3->4 : reutrn to buyers
what do I think will happen next ?
* push above vpoc
* hidden bullish divergence
* obv support line predicting buying interest

A return to solid sellers in a downtrend paves the way for =SELL
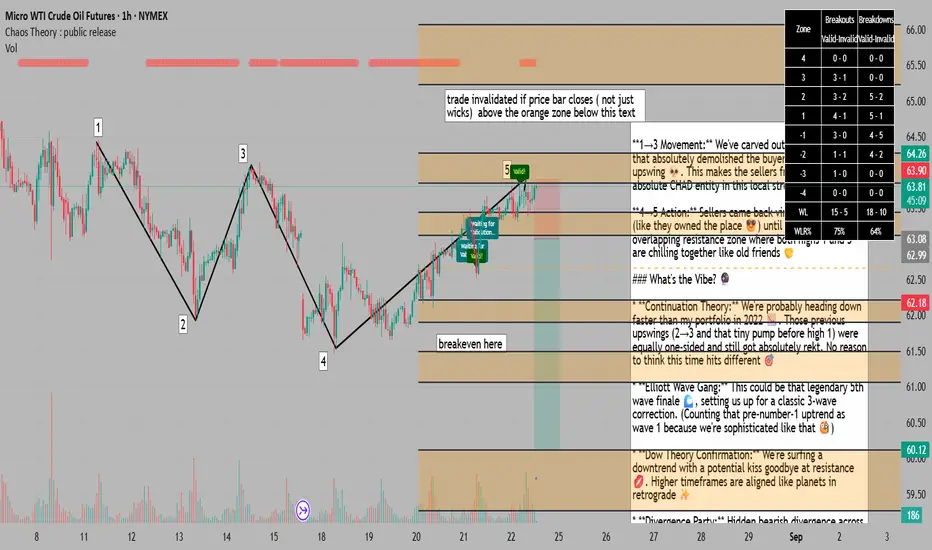
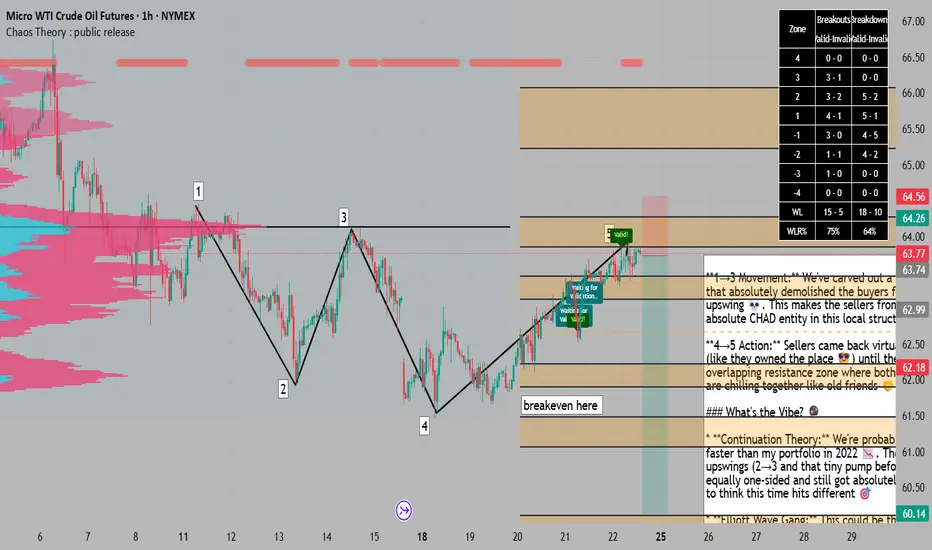
**1→3 Movement:** We've carved out a spicy lower low that absolutely demolished the buyers from that 2→3 upswing 💀. This makes the sellers from numero uno the absolute CHAD entity in this local structure 💪
**4→5 Action:** Sellers came back virtually unchecked (like they owned the place 😎) until they hit that overlapping resistance zone where both highs 1 and 3 are chilling together like old friends 🤝
### What's the Vibe? 🔮
* **Continuation Theory:** We're probably heading down faster than my portfolio in 2022 📉. Those previous upswings (2→3 and that tiny pump before high 1) were equally one-sided and still got absolutely rekt. No reason to think this time hits different 🎯
* **Elliott Wave Gang:** This could be that legendary 5th wave finale 🌊, setting us up for a classic 3-wave correction. (Counting that pre-number-1 uptrend as wave 1 because we're sophisticated like that 🧐)
* **Dow Theory Confirmation:** We're surfing a downtrend with a potential kiss goodbye at resistance 💋. Higher timeframes are aligned like planets in retrograde ✨
* **Divergence Party:** Hidden bearish divergence across RSI, MFI, and A/D indicators 📊 - the triple threat confirmation we love to see 🎪
### Chaos Theory Stats (Because We're Built Different) 🌪️
* **64% Probability:** If price closes below a zone, there's a 64% chance it'll hit the next zone down. That's better than a coinflip, and we'll take those odds all day 🎲
* **Breakeven Placement:** Strategically positioned because if price returns to the zone above after hitting BE, we've got a 75% chance of revisiting entry (and nobody likes giving back profits) 💸
* **Zone Selection:** Next orange zone below is the target because we're methodical like that 🎯
* **Data Backing:** These stats are from the last 2,500 bars - not some random hopium, actual backtested edge 📈
**Trade Invalid:** If price closes above that orange zone lurking below this text ⚠️
---
*Not financial advice, just one trader's vibe check on the markets* 🚀💀
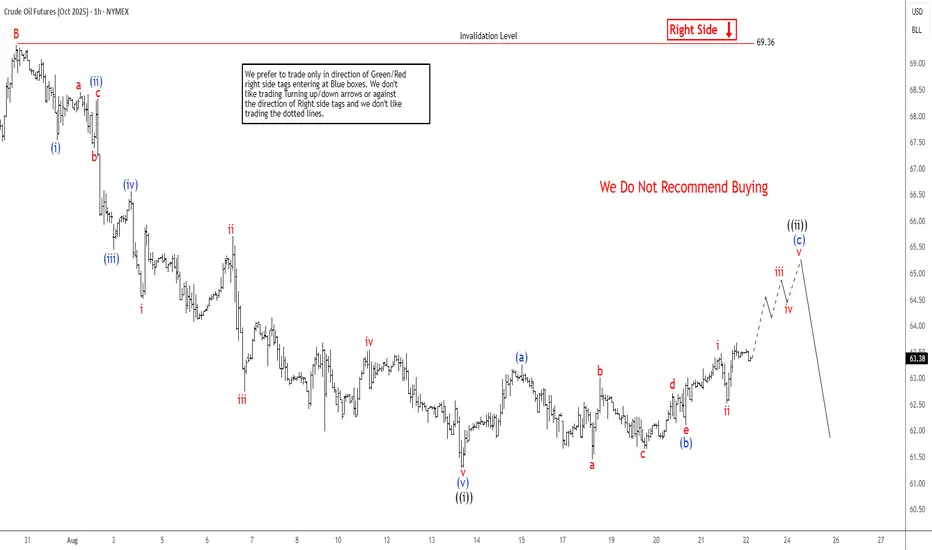
Oil (CL) Anticipating a Decline from $64.7 LevelCrude oil (CL) exhibits a bearish trend following its June 23, 2025, peak, signaling further declines. The ongoing descent forms a zigzag Elliott Wave pattern. From the June high, wave A dropped to $64, while wave B rebounded to $70.58, as depicted in the accompanying one-hour chart. Wave C, now unfolding, breaks into a five-wave impulse structure. From wave B’s peak, wave (i) concluded at $68.56, followed by a wave (ii) rally to $69.58. The commodity then fell in wave (iii) to $66.56, with wave (iv) recovering to $67.74.
Currently, oil continues its decline in wave (v), reaching $61.94, completing wave ((i)) in a higher degree. A corrective rally in wave ((ii)) is underway, structured as a lesser-degree zigzag. From wave ((i)), wave (a) climbed to $64.15, followed by a wave (b) pullback forming a triangle, ending at $62.52. Wave (c) is now advancing toward the $64.68–$66.01 range, corresponding to a 100%–161.8% Fibonacci extension of wave (a), to complete wave ((ii)) before resuming the downtrend. In the near term, as long as the $70.58 pivot holds, expect corrective rallies to falter in a 3, 7, or 11-swing pattern, paving the way for further declines.
This is part two of a monthly reviewThis is the 21st of August.. It's important to go back and look at a previous video since I'm trying to make decisions as to the direction of the market and this will give you a chance to see whether or not price action and patterns can find you good trade location which includes small stops and reasonable Rewards.

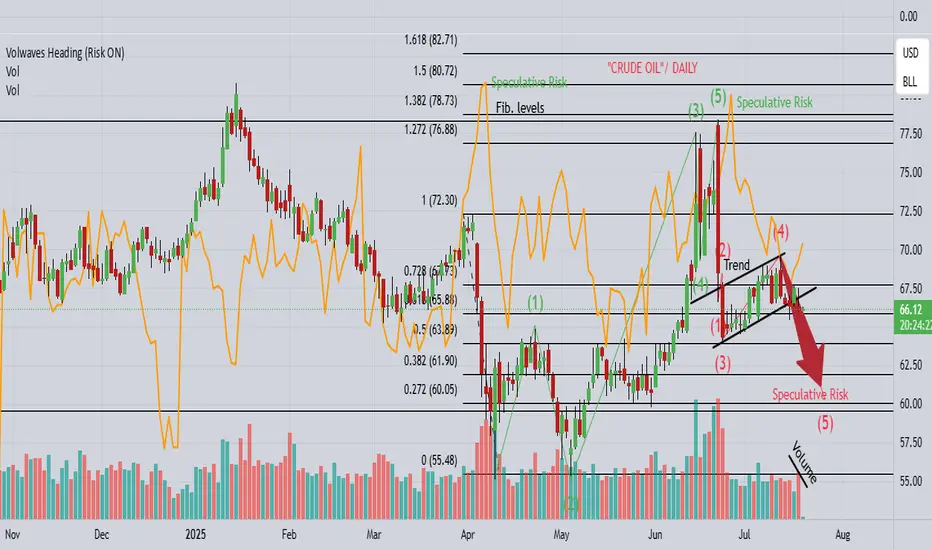
CL "OIL" continues the drop towards $60!1). Wave 5 drop needs a completion lower! 2). Risk is selling off! 3). Volume is falling! 4). Price appears to be heading towards lower market sentiment! 5). Trump is imposing more Tariffs, which is likely causing deeper corrections!
Crude Oil Warning $66.40 Flip Signals $63.86 TargetWTI rolled over after failing near $68.66096 (top red dashed line). The breakdown through $66.40002 turned that level into resistance 🚧. After a sharp selloff, price is now hovering around the $65.54 area (thin entry line labeled 65.54232), just beneath the minor pivot band at 65.54 / 65.52 / 65.21 (green dashed cluster labeled 65.54232 • 65.52347 • 65.20824). The structure is lower-high → lower-low, which keeps momentum bearish while price holds below $66.40. If sellers keep control, the next magnet is the confluence support around $63.86661 (first lower green dashed line), with extension into $63.51000–$63.46746 if momentum accelerates.
You can also see repeated “S” tags on the push down from the high and into the mid-range, while the “B” tags cluster only at pullback lows—classic distribution behavior. Any spikes toward $66.07 (label 66.07275) and especially $66.40 should attract supply unless bulls reclaim and hold above that zone.
Trade setup 🎯 (from the chart):
• Entry: $65.54232 (≈ $65.54)
• Stop-loss: $66.07275 (≈ $66.07), conservative SL above $66.40002 if you prefer more room
• Targets: $63.86661 first take-profit; stretch targets $63.51000 → $63.46746
This offers a solid bearish R:R while price stays capped beneath $66.40. As it moves your way, book small profits 💰 at each objective, trail stops 🔒 (e.g., to $65.52 once under $65.21), and size the position to your own risk tolerance—WTI can spike on headlines.
Invalidation: A sustained reclaim and hold above $66.40 would neutralize the immediate bearish bias and open room back toward $68.66. Until then, the path of least resistance remains down 📉.

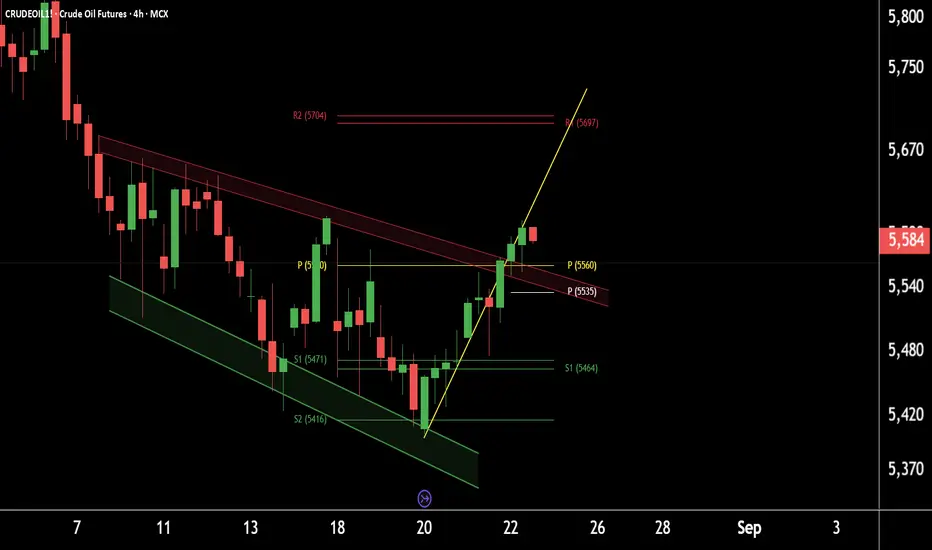
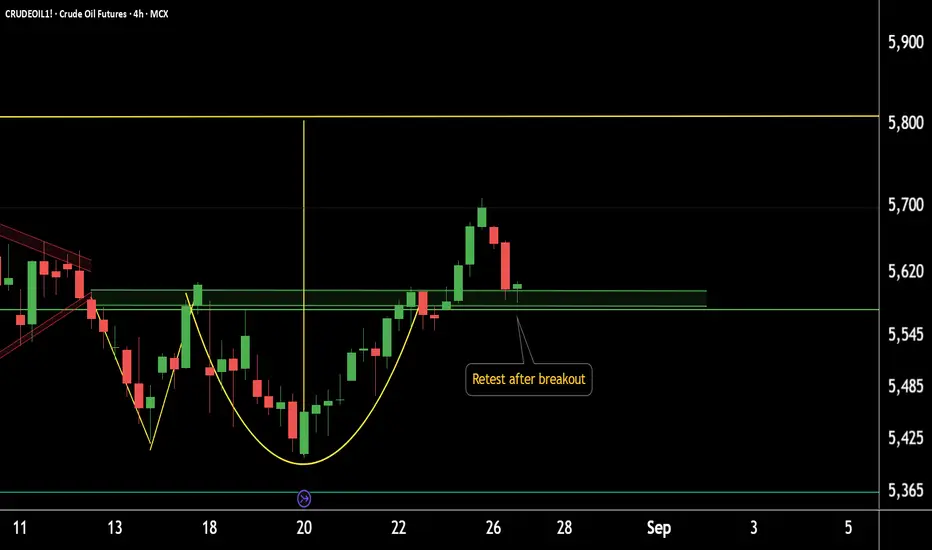
Crude Oil breaks out of falling channel –Watch for higher level.This is the 4-hour timeframe chart of CrudeOil1!.
The price has been moving within a well-defined falling channel and has now given a breakout. A possible retest of the breakout level around 5560 may occur, after which CrudeOil could move towards the falling channel completion target near 5700.
Weekly pivot support is also placed around the 5400–5450 zone and resistance around 5700.
If this level is sustained, we may see higher prices in CrudeOil1!
Thank You !!
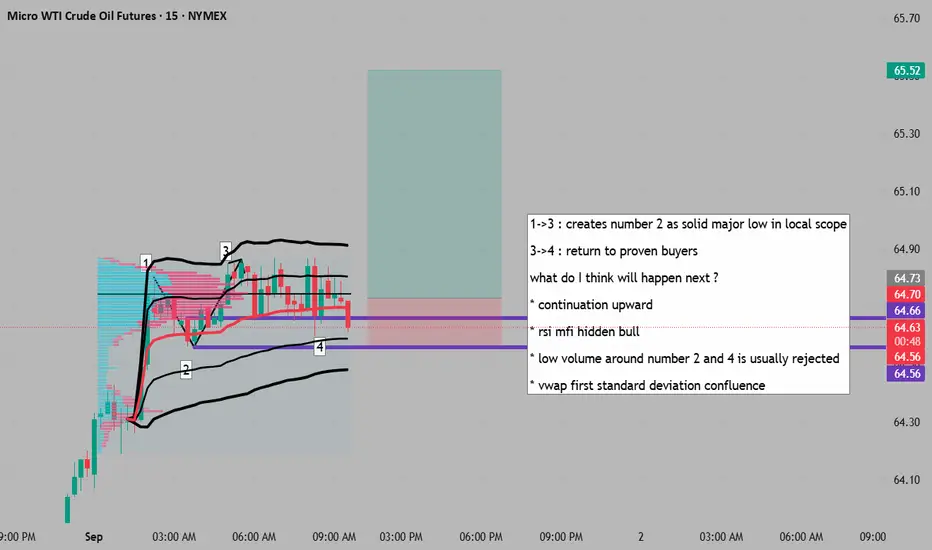
potential continuation of uptrend with return to proven buyers1->3 : creates number 2 as solid major low in local scope
3->4 : return to proven buyers
what do I think will happen next ?
* continuation upward
* rsi mfi hidden bull
* low volume around number 2 and 4 is usually rejected
* vwap first standard deviation confluence
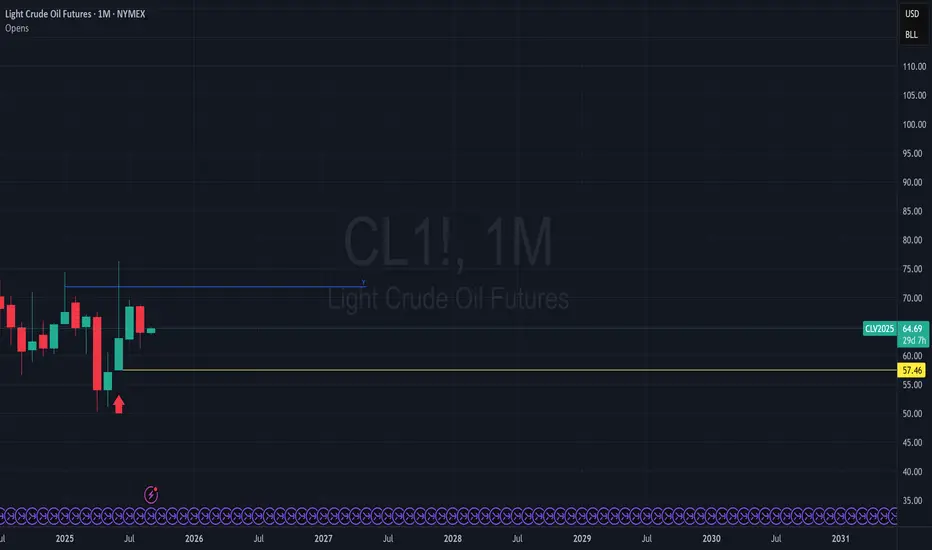
Oil has 2 consecutive months closing below June's pop in priceWill oil futures eventually retest 57.46 now that two months have been unable to press for June's price high?
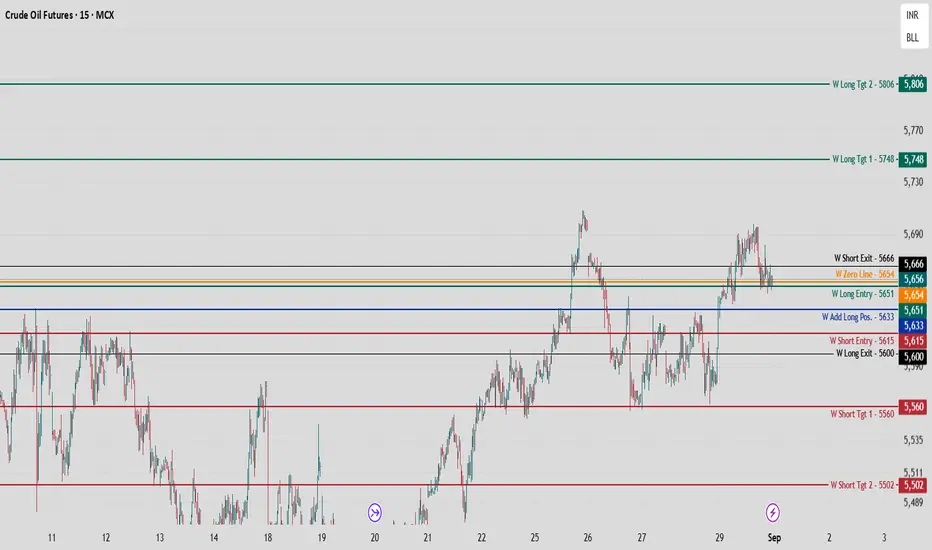
Crude Oil MCX Futures — Weekly Positional Roadmap (1-5 Sep-2025)MCX:CRUDEOIL1! For positional and swing traders in Crude Oil MCX Futures, weekly levels provide a clear directional blueprint for the week ahead.
Weekly Key Levels
Zero Line: 5654 — This is the pivotal level dividing bullish and bearish sentiment for the entire week. Any 1 hour candle closed before or above with a high or low break, is a bias hint for the week!
Positional Buy Setup: Remain buy-biased till 5627. Positions can be initiated above 5671 (Weekly Long Entry) and strengthened at 5663 (Add Long).
Upside Targets:
Weekly Take Profit Tgt 1: 5698
Weekly Take Profit Tgt 2: 5725
Long Exit: Closing Above 5647 — Consider booking positions near these levels if upward momentum stalls.
Weekly Bearish Plan
Short Setup: If Crude breaches and sustains below 5654, positional shorts can be considered with eyes on 5610 and 5583 for target levels.
Short Exit: Cover or reconsider shorts if price rebounds above 5678.
Tactical Guidance
Weekly/Positional Traders: Use these levels for larger swing moves; wait for clear breakouts confirmed by 1 Hour candle closes for timing entries and exits, on pull back, make positions.
Adapt position sizes and risk management to account for wider weekly swings compared to daily trades.
Approach the week with a clear plan—these levels serve as checkpoints for positional trading rather than intraday scalps. Stay patient and disciplined for potential bigger moves this week.
MCX:CRUDEOIL1!
Light Crude Oil Futures (CL) – Trade Setup & Key Levels
🛢️ Light Crude Oil Futures (CL) – Trade Setup & Key Levels 📊
Analyzing Light Crude Oil Futures based on recent market structure and risk management parameters.
📌 **Entry Price:** $61.15
🔑 Key Levels to Watch:
🔹 **Exit Target:** +6.1% above entry → around $64.88
🔹 **Stop Loss:** -4.6% below entry → around $58.34
🔹 **Support Zone:** -7.3% below entry → around $56.66
🔹 **Resistance Zone:** +10.9% above entry → around $67.84
Crude Oil is consolidating in a medium-range channel. With the current entry, the risk-to-reward ratio favors a potential upside, while defined levels help manage downside risks.
**Bullish View:** Price can aim for $64.88 first, and potentially retest the $67.80 resistance zone.
**Bearish View:** If $58.34 fails to hold, we may see extended downside toward $56.66 support.
⚠️ **Note:** If price breaks below $58.34, expect further decline toward support. ⚠️
🔔 **Be sure to follow updated ideas for Crude Oil Futures!** 🔔
⏰ **Analysis Timeframe:** Daily & 4H perspective.
⚖️ **Always use a Stop Loss** for risk management! 🚨
💡 **This is just my market idea — follow your own strategy.**
✅ **Hit the 'Like' button** ✅ 🙏😊 & Share with fellow traders if you find it useful!
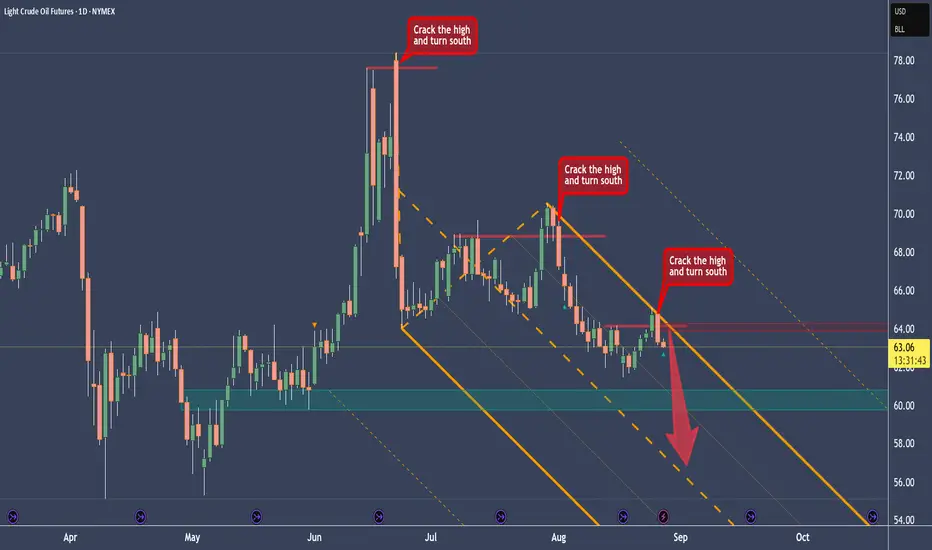
Crude Oil Short After Finding A Recurring BehaviorAfter I cleared the CL chart, I immediately saw a behavior that we can use for a setup right now.
You see that the highs got cracked, and then immediately price turns to the south. And since we are in a downtrend on Crude, we have a legit Short-Trade at hand.
With the modified Shiff-Fork you see how nice CL is reacting at the U-MLH, where it get's rejected. This level also coincides with the crack level.
I personally would love a pullback up to the crack-zone before shorting it. Maybe the trading Gods give us a gift on this Wednesday.
Talking about Wednesday: today we get the Crude Oil EIA numbers, which will probably move the markets.
However you plan is if you trade it, don't have FOMO. There are many more trades to come in your trading career.
Have a happy hump day §8-)
return to solid sellers inspires immediate =SELL market order
**1→3 Movement:** We've carved out a spicy lower low that absolutely demolished the buyers from that 2→3 upswing 💀. This makes the sellers from numero uno the absolute CHAD entity in this local structure 💪
**4→5 Action:** Sellers came back virtually unchecked (like they owned the place 😎) until they hit that overlapping resistance zone where both highs 1 and 3 are chilling together like old friends 🤝
### What's the Vibe? 🔮
* **Continuation Theory:** We're probably heading down faster than my portfolio in 2022 📉. Those previous upswings (2→3 and that tiny pump before high 1) were equally one-sided and still got absolutely rekt. No reason to think this time hits different 🎯
* **Elliott Wave Gang:** This could be that legendary 5th wave finale 🌊, setting us up for a classic 3-wave correction. (Counting that pre-number-1 uptrend as wave 1 because we're sophisticated like that 🧐)
* **Dow Theory Confirmation:** We're surfing a downtrend with a potential kiss goodbye at resistance 💋. Higher timeframes are aligned like planets in retrograde ✨
* **Divergence Party:** Hidden bearish divergence across RSI, MFI, and A/D indicators 📊 - the triple threat confirmation we love to see 🎪
### Chaos Theory Stats (Because We're Built Different) 🌪️
* **64% Probability:** If price closes below a zone, there's a 64% chance it'll hit the next zone down. That's better than a coinflip, and we'll take those odds all day 🎲
* **Breakeven Placement:** Strategically positioned because if price returns to the zone above after hitting BE, we've got a 75% chance of revisiting entry (and nobody likes giving back profits) 💸
* **Zone Selection:** Next orange zone below is the target because we're methodical like that 🎯
* **Data Backing:** These stats are from the last 2,500 bars - not some random hopium, actual backtested edge 📈
**Trade Invalid:** If price closes above that orange zone lurking below this text ⚠️
---
*Not financial advice, just one trader's vibe check on the markets* 🚀💀
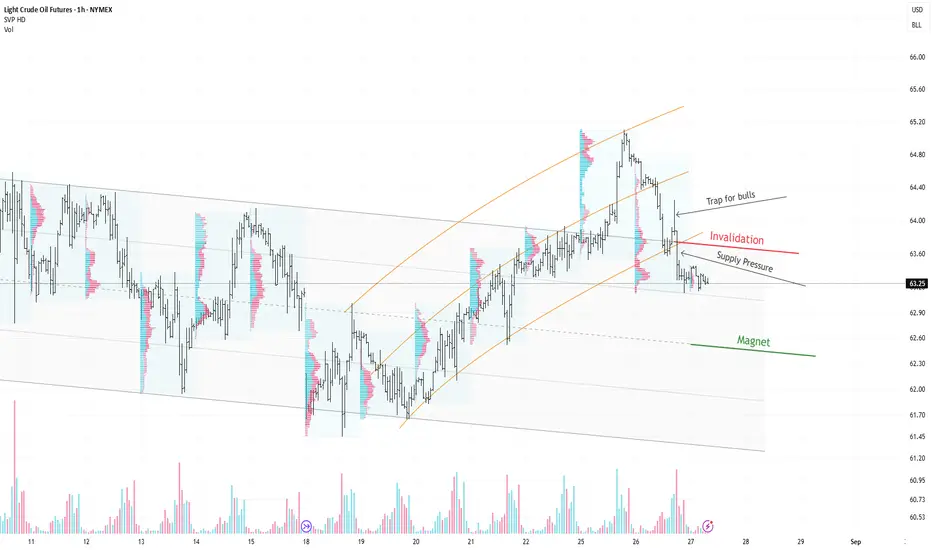
CL1! — Bearish: back inside the descending channel, watching theThesis (1h):
Price had been sliding within a broad descending channel (grey). The counter-trend recovery shaped a rising channel (orange). Yesterday’s attempt to resume the advance from the lower orange boundary failed and turned into a bull trap; sellers pushed price back inside the grey channel. Bears confirmed control at the red line (resistance/retest).
Map:
Clear supply pressure after the failed bounce.
While price stays below the red line, the base case is a drift toward the channel median (the “magnet”).
A momentum extension could target the lower band later; not the main case yet.
Invalidation:
Sustained acceptance back above the red line and into the orange channel would neutralize the bearish read.
Educational only. Not financial advice.
Lower Highs Signal Weakness: Crude Oil Bears Eye $61 Support
The recent attempt to rally stalled around $65–66, failing to break above the mid-Bollinger band resistance.
Multiple long upper wicks show selling pressure on rallies.
Price is moving closer to the lower band after failing to hold above the middle band.
The market shows weak upside momentum and dominant selling pressure.
As long as price stays below $65.50, bears maintain control.
If $61.00 support breaks, downside targets are $59.00, then $57.00.

WTI Crude Oil Price Weekly Forecast: Recovery Above $63 SupporteTrend: Upward correction within long-term channel
Current Price: 63.53
⸻
Bullish Scenario
• Entry: BUY STOP 65.70
• Targets: 69.80
• Stop-Loss: 64.00
Bearish Scenario
• Entry: SELL STOP 63.00
• Targets: 57.80
• Stop-Loss: 65.00
⸻
Key Levels
• Resistance: 65.70, 69.80
• Support: 63.00, 57.80
⸻
Indicators
• Alligator: fast EMAs below signal line, sell signal weakens
• AO Histogram: corrective growth, still negative zone
• Trend: testing support of ascending channel (82.00–66.00), recovery potential above $63
⸻
📌 Holding above $63 keeps bullish momentum alive toward $65.70–69.80. A break below $63 opens deeper correction to $57.80.

CRUDEOIL1! breakout + support confirmation=potential upside move4-Hour Chart Update: CRUDEOIL1!
CRUDEOIL1! has retested the breakout zone at 5580–5600.
If this level sustains, we may see higher prices ahead in CRUDEOIL1!.
Thank you!
Oil bearish below 70.00Oil is bearish below 70.00; it trades below its falling trendline, 200, 50, and 20 SMA.
The price recently recovered from the 61.50 low but ran into resistance at 64.50, the 20 SMA.
Sellers will look to take out support at 61.50 and 60.00 to extend losses towards 55.50, the 2025 low.
Should bulls break above the 20 SMA and 65.00 round number, this opens the door to 67.50 the 200 SMA. A rise above 70.00 creates a higher high.
FC

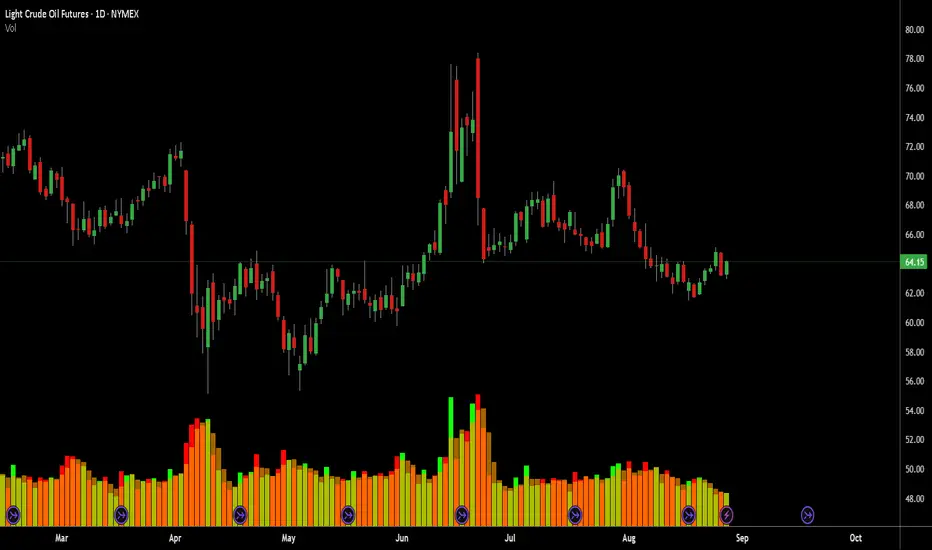
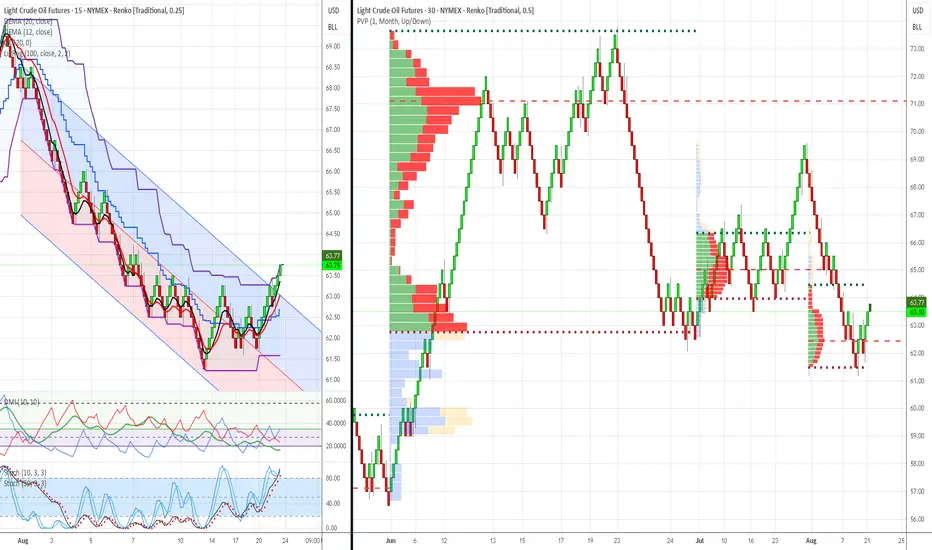
WTI Crude Oil Trading Analysis: June-August 2025 - 25-AugustWTI Crude Oil Trading Analysis: June-August 2025 Review & Week of August 25th Recommendations
Analysis Date : August 23, 2025
Market : WTI Crude Oil Futures (CL1!)
Methodology : Dual Renko Chart System ($0.25/15min + $0.50/30min)
Volume Profile : 3-Month Monthly Analysis (June-August 2025)
Executive Summary
Market Regime: Oil has completed a major corrective phase from $72 highs to $61 lows, establishing a clear bottoming pattern with strong institutional accumulation. Current setup presents high-probability bullish swing opportunity with excellent risk/reward characteristics.
Current Status : Bullish reversal confirmed with multiple technical confluences at critical support zone. Recommended positioning for upside targets with systematic risk management protocols.
3-Month Market Structure Analysis (June-August 2025)
Phase 1: Distribution & Breakdown (June-July)
Price Action: $72 → $61 (-15% decline)
June Peak: Heavy red volume distribution at $71-72 level indicated institutional selling
July Decline: Clean Renko downtrend with sustained selling pressure
Volume Profile: Minimal volume during decline, suggesting limited buying interest until $63-64 zone
Phase 2: Accumulation & Reversal Setup (Late July-August)
Price Action: $61 → $63.50 (+4% recovery)
Institutional Buying: Massive green volume accumulation at $63-65 level
Support Establishment: $62-63 zone showing strong buying interest
Technical Reversal: DEMA crossover confirmed bullish momentum shift
Volume Profile Key Levels (3-Month Analysis)
Major Support Zones :
$62-63: Primary institutional accumulation (heaviest green volume)
$60-61: Secondary support with moderate green volume
$58-59: Ultimate support level (limited historical volume)
Resistance Zones:
$66-67: First institutional resistance (mixed volume)
$69-70: Major distribution zone (heavy red volume from June)
$71-72: Ultimate resistance (peak selling pressure)
Current Technical Analysis (August 23, 2025)
Dual Chart Assessment
$0.50 Chart (Structure Analysis):
Trend: Clear bottoming pattern completed at $61 low
Current Position: Testing above major institutional accumulation zone
Volume Confirmation: Trading within heaviest 3-month green volume cluster
Structure: Higher lows pattern emerging since $61 bottom
$0.25 Chart (Execution Analysis):
DEMA Status: Bullish crossover confirmed (Black above Red at $63.00)
DMI/ADX: +DI gaining momentum, ADX rising through 25 level
Donchian Position: Price above basis, testing toward upper band
Recent Action: 3 consecutive green bricks confirming upward momentum
Technical Confluences Supporting Bull Case
Volume Profile: Massive institutional support at current levels
DEMA Crossover: Clear trend reversal signal confirmed
Momentum: DMI showing bullish shift with strengthening ADX
Structure: Higher low pattern vs. $61 bottom
Risk/Reward: Excellent positioning near major support zone
Market Context & Macro Considerations
Current Oil Market Dynamics
Supply: OPEC+ spare capacity at 5.9 million b/d (bearish)
Demand: China slowdown offset by US resilience (neutral)
Inventories: Below 5-year average (bullish)
Refining: Margins supporting crude demand (bullish)
Federal Reserve Impact
Policy Stance: Potential September rate cut (bullish for commodities)
Dollar Weakness: Could support oil prices
Inflation Expectations: Rising energy costs could influence policy
Seasonal Factors
Driving Season: Peak summer demand ending (bearish)
Hurricane Season: Atlantic activity potential (bullish)
Refinery Maintenance: September turnaround season (mixed)
Conclusion & Strategic Outlook
Near-Term Assessment (1-2 weeks): The current setup represents a high-probability swing trading opportunity with exceptional risk/reward characteristics. The combination of institutional volume support, technical reversal signals, and favorable market structure creates optimal conditions for bullish positioning.
Medium-Term Outlook (1-3 months): Successful navigation through the $66-68 resistance zone could establish a broader recovery toward $70-72 levels. However, macroeconomic headwinds and seasonal factors require careful position management and profit-taking discipline.
Risk Assessment: While the setup is compelling, traders must respect the institutional accumulation levels as ultimate support. Any violation of the $62 zone would invalidate the bullish thesis and require immediate position liquidation.
Strategic Advantage: The dual Renko chart system provides both structural clarity and tactical precision, enabling confident position sizing and systematic risk management. The monthly volume profile offers institutional-level insight typically unavailable to retail traders.
Document Classification: Trading Analysis & Recommendations
Risk Disclaimer: Past performance does not guarantee future results. All trading involves risk of loss.
WTI Crude Oil – India Keeps Buying Russian Oil Despite U.S. SancSymbol: USCRUDE
Timeframe: Weekly
Current price: 63.53
⸻
Bearish scenario
• Entry: SELL STOP 62.50
• Targets: 59.38, 56.25, 53.12
• Stop: 64.50
Alternative bearish scenario
• Entry: SELL LIMIT 65.62
• Targets: 59.38, 56.25, 53.12
• Stop: 68.00
⸻
Key levels
Resistance: 65.62, 68.75, 71.88
Support: 62.50, 59.38, 56.25, 53.12
Indicators
• Bollinger Bands → pointing down, resistance at 65.62.
• MACD → negative zone, trend still bearish.
• Stochastic → overbought, risk of reversal.
⸻
📌 WTI is testing 62.50 support. Break lower → downside to 59.38–53.12. If price rebounds near 65.62, sellers could re-enter with tight stops.
