Energy, the Uncrossable Barrier for AIBy Ion Jauregui – Analyst at ActivTrades
The artificial intelligence (AI) revolution may face its most unexpected limit: energy. According to Apollo Global Management Inc. (NYSE: APO), the current global energy system will not be able to sustain the growth pace of AI, not even within a generation.
In a recent interview, Dave Stangis, Chief Sustainability Officer at Apollo, warned that “the energy demand required by AI far exceeds the generation and transmission capacity of the global grid.” Far from being alarmist, this statement highlights a reality that markets are beginning to factor in: the digital future could depend more on oil prices and electrical infrastructure than on Nvidia chips.
Fundamental Analysis: The New Energy Imbalance
Data centers powering AI currently consume an estimated 4% of the world’s electricity, a figure that could double by 2030, according to the International Energy Agency (IEA). Meanwhile, investment in power generation and transmission is not keeping pace, creating a structural supply deficit.
On the stock market, major tech companies—Nvidia, Microsoft, Alphabet, and Amazon—remain the Nasdaq's driving engines, but their energy-intensive growth could pressure margins if electricity costs continue rising.
Conversely, energy companies are emerging as potential indirect winners of this revolution. Firms like ExxonMobil (NYSE: XOM) and Chevron (NYSE: CVX) have strong balance sheets, stable cash flows, and attractive dividend policies, trading at P/E ratios around 12x, well below those of the tech sector. Brent crude remains near $88 per barrel, supported by global demand and OPEC+ production cuts, while energy companies benefit from firm prices and potential expansion of traditional and renewable power capacity.
Technical Analysis: A Quiet Rotation Toward Energy
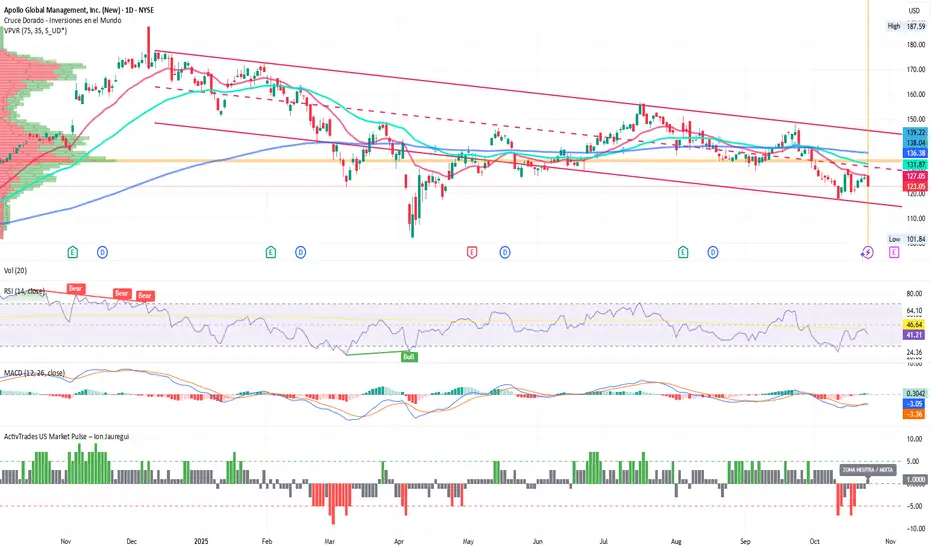
On the daily chart, Apollo Global Management shows a long-term bearish trend. After consistently resisting the $120 price zone, the stock closed yesterday with a correction at $123.05. The price has stayed below the 50-day moving average since a new bearish trend consolidated on October 2.
If the current price breaks the $125 zone, we could see a recovery trend toward the control point around $132, a level where it has fluctuated since March. The RSI indicates oversold conditions at 41.21%, accompanied by a bearish MACD with a histogram entering positive territory, suggesting either consolidation or increasing buying pressure.
Meanwhile, the ActivTrades US Market Pulse shows a neutral risk environment after several days in Risk Off territory, which had driven significant selling ahead of the quarter’s close. This suggests the stock is seeking to recover lost value and find equilibrium. Notably, the Nasdaq’s correction has dragged many tech companies into a consolidation phase after a period of euphoria, while the energy sector gains traction, supported by solid fundamentals and stable crude prices.
AI Redefines the Energy Map
Apollo’s analysis highlights a reality markets are beginning to internalize: AI not only redefines productivity but also the global energy landscape. The challenge will not be creating smarter models, but generating enough energy to sustain them. In this equation, capital appears to be shifting from silicon toward oil and electrical grids.
*******************************************************************************************
The information provided does not constitute investment research. The material has not been prepared in accordance with the legal requirements designed to promote the independence of investment research and such should be considered a marketing communication.
All information has been prepared by ActivTrades ("AT"). The information does not contain a record of AT's prices, or an offer of or solicitation for a transaction in any financial instrument. No representation or warranty is given as to the accuracy or completeness of this information.
Any material provided does not have regard to the specific investment objective and financial situation of any person who may receive it. Past performance and forecasting are not a synonym of a reliable indicator of future performance. AT provides an execution-only service. Consequently, any person acting on the information provided does so at their own risk. Political risk is unpredictable. Central bank actions can vary. Platform tools do not guarantee success.
Apollo Global Management, Inc. 7.625% Fixed-Rate Resettable Junior Subordinated Notes due 2053
No trades
Trade ideas
After-Hours Update: APO Break & Retest Continuation Passed 50FibOverview
Looking for an incoming buy-in opportunity on APO - Apollo around the $158-$160 range by mid-February. This setup aligns with a potential longer-term hold and a continuation back to its previous all-time highs (ATHs). If it follows an incremental climb higher, this could yield a 19-20%+ gain, with even more potential if it surpasses those ATHs. The technical and fundamental setup is looking highly favorable.
Technical Analysis:
Trend and Breakout Potential:
APO is currently attempting to break out of a descending trendline (red line) following its recent pullback. The price action suggests the $158–$160 zone will act as strong support, which also aligns with the broader upward green trendline visible in the chart.
Moving Averages as Support:
The price action is converging near key moving averages, which could act as dynamic support zones. A potential bounce from this region is supported by historical performance around these levels.
Volume Analysis:
Recent volume spikes around critical price zones indicate heightened institutional interest, reinforcing the potential for a reversal or sustained breakout.
Fibonacci Levels:
The $158-$160 range also aligns with the 61.8% Fibonacci retracement level, a critical zone watched by institutional traders. This provides an added layer of confidence in the identified support.
Risk/Reward Setup
With a potential entry around $158, targeting the ATH of $193 provides a compelling risk-to-reward ratio. A stop-loss placed around $150 ensures the risk is well-managed, with an estimated R:R exceeding 2:1.
Fundamental Analysis
Apollo Global Management’s solid fundamentals further support the case for a long-term hold:
Fundamental Analysis
Apollo Global Management’s strong fundamentals reinforce the case for a long-term hold:
Earnings Per Share (EPS): $8.28 (trailing twelve months), reflecting a YoY growth of 141.45%, showcasing the company’s robust profitability rebound.
Dividends Per Share: $1.72 (TTM), with a YoY growth of 6.98%, indicating steady shareholder returns and dividend stability.
Strong Historical Growth: Apollo has demonstrated significant earnings resilience, recovering from a loss in 2022 (-$3.43) to positive EPS in 2023 ($8.28).
Sector Outlook: As a leading asset management firm, Apollo is well-positioned to benefit from market trends favoring alternative investments, which are expected to grow substantially over the coming years.
Upcoming Catalysts
Keep an eye on any earnings reports or significant corporate announcements that could act as catalysts for the next leg higher. These events may also validate the technical setup and the expected rebound.
Conclusion
APO is setting up for a strong rebound from the $158–$160 level, with technical, volume, and fundamental indicators all pointing towards a bullish continuation. The upside potential back to the ATH of $193 represents a significant gain, making this a great opportunity for a longer-term hold. The setup is looking excellent for patient investors.

The Bull Market in Private EquityThe other day I was scanning for stocks hitting 52-week highs (or in other words, their highest price in 12 months' time) and noticed that several private equity stocks appeared on this custom scan that I was performing. The stocks were KKR, Blackstone, and Apollo Global. I found a few things interesting about this that are worth discussing and looking into more detail:
The Trend is Your Friend?
Foremost, the question is whether or not these are a trend play and a way to play a rising trend. Oftentimes, trend followers love nothing more than getting behind a tidal wave in a new thriving industry or market or process. It’s shown quite a bit to be an effective strategy. However, always do your own research. But that’s the first question - will this trend last another 5+ years? Private equity firms have been making headlines with their strategic acquisitions and impressive returns. But can they maintain this momentum?
Private Equity Bull Market, Possibly Explained
Private Equity firms like KKR, Blackstone, and Apollo Global operate by raising funds from investors, which they then use to acquire, manage, and eventually sell companies at a profit. They focus on improving the operational efficiencies and financial performance of these companies. Some notable examples include:
KKR: Known for its leverage buyouts and investments in various sectors such as technology, healthcare, and energy.
Blackstone: A diversified investment firm with holdings in real estate, private equity, hedge fund solutions, and credit.
Apollo Global: Specializes in private equity, credit, and real estate investing, with a strong focus on distressed assets and value investing.
They Are Flush With Cash & Assets
As of the latest data, Blackstone manages over $900 billion in assets, making it the largest private equity firm globally.
KKR has approximately $500 billion in assets under management.
Apollo Global oversees around $550 billion in assets.
Cash Reserves and Interest Earnings
Private Equity currently has quite a bit of cash and investments under management. They are earning interest on this cash on Treasuries up to 5%. For instance, with the Federal Reserve's interest rate hikes, these firms are leveraging their cash reserves to earn substantial returns on relatively risk-free investments like U.S. Treasuries. This provides a steady income stream and enhances their financial stability, enabling them to pursue larger and more lucrative deals.
Cautionary Note on Illiquid Assets
Lastly, I do want to share a cautionary note as these firms also hold a lot of illiquid assets. What would happen if those assets got marked lower? For example, some of them own quite a bit of real estate. What's the plan here? Have they marked them down accordingly?
The real estate market is one area of concern. If property values decline significantly, these firms could face substantial write-downs on their balance sheets, affecting their overall financial health. It's crucial to monitor how these firms manage their illiquid assets and whether they have adequately adjusted their valuations in line with current market conditions.
So What Are My Final Thoughts?
This is a fascinating story to be unfolding in markets and I am watching closely. I think there are two ways to watch this:
A - They are in a trend. Uptrend. Bull market.
B - They may offer an intriguing short position at a later stage!
More on this later and read my idea below to better understand what I am looking at.

NYSE> short *APO*Based on my graphic analysis I observe a bearish projection reaching minus 6,2% in the price of this corporation, that is; from $107 it will drop to $100. With a buy exit emerging at $113, it is worth remembering that the exact time the decline will take is unpredictable, the market will simply do its job. We can mention that it will happen within the next 20-30 days from this post!
REFERENCES:
* Green line: emergency exit price: $113 -6%
* Red line: selling price (position) $107
* White line: profit $100 +6,2%
However, it is important to remember that these marked lines must be respected. If the price goes up 2 to 4% after you execute the position, don't try to improvise and change everything. The movement could return to the initial direction and you will be left frustrated!
"Sitting quietly and waiting for the operation to develop most of the time will allow you to earn much more money. That is, sit in the stands and enjoy the spectacle that the bull will present to you, control your emotions, since the biggest enemy of "The time to invest is yourself"
As for capital management, I leave it to my personal discretion knowing that we must always have money flowing and remain firm in the market.
Greetings and I hope you take advantage of this good negotiation opportunity!
> Josias Baltazar.n

APO ( Apollo Global Management ) breaking bullish flag patternStock : PYPL ( Apollo Global Management Inc )
Date : 27 Mar 2024
Trend : Up
preferred Transaction : Buy ( 113.50 $ )
Reasons : The stock has broken up the bullish flag pattern
Technical Analysis success at level : Target 1 :( 128 $ ) - Target 2 :( 136.60 $ )
Technical Analysis fail at level : 107.60 $

APO broke out of consolidation phaseBroke-out of consolidation and crossed over resistance of 114.92. There is no target as the stock is hitting ATH. Manage the trade by having stop losses. We can go long with stock and set stop loss slightly below 114.77. There is currently no good option flows.

APOLLO Stock Chart Fibonacci Analysis 043023Trading Idea
1) Find a FIBO slingshot
2) Check FIBO 61.80% level
3) Entry Point > 63/61.80%

APO - Megaphone Up An up megaphone structure
Expect bullish continuation as price rebounds of the lower band of the megaphone
BULLISH
$APO - Short opp? look at that recent percentage gain CC:$KKR $APO - Short opp? look at that recent percentage gain CC:$KKR

$APO with a Bearish outlook following its earnings #Stocks The PEAD projected a Bearish outlook for $APO after a Positive over reaction following its earnings release placing the stock in drift B with an expected accuracy of 100%.
Apollo Global Managmentlove the name of this company and they are into the business of diamonds- but they are mostly synthetic --- I like synthetic black diamonds --- so I will invest in the companies that I admire- or hope succeed

APO - Apollo Global ManagementNYSE:APO
Idea is simple:
Long position when the price breaks out of flag ($75.85)
Stop - close lower than $74.91 (-1.23% risk)
Take - $81 (6.88% upside)
Profit/Risk - 5.6
Feel free to comment / add a feedback


$APO Long Trade SetupStock been trading sideways in a very tight range after right under ATHs after a 28% rally. Clear sign of lack of selling. Seems all ready to run this week.
Apollo Global Mgmt Inc (APO)- INVESTS IN AND MANAGES FUNDS RELATED TO VALUE-ORIENTED PRIVATE EQUITY, AND CREDIT-ORIENTED CAPITAL MARKETS

APOLLO GLOBAL MANAGEMENT Post DailyHey guys, APOLLO GLOBAL MANAGEMENT is in a bullish movement with a kind of hammer candle and with a fake return of sell volume made. In the TIMEFRAME M1 we see a short leg hammer candle with a low purchase return issued. She is breaking out of the top of her bollinger to get to the top of the consolidation zone. Strong potential to break out the price with the return of momentum in both the area to reach the new one and go to the next high.
With a resistance to yield (on the TIMEFRAME H1) before being able to breakout a zone of consolidation. Not enough buying power to test the intermediate median of ANDREWS PITCHFORK.
Please LIKE & FOLLOW, thank you!

APOMID-TERM: Right angled descending broadening wedge with 4hr hidden bullish divergence . I actually called this one much before now, but this is a shorter term trade. (Not financial advice)


BUY To APOLLO GLOBAL MANAGEMENTHey traders, APOLLO GLOBAL MANAGEMENT is in a compression zone, its can break it then make a breakout of the stabilization zone for high rise and fall.
Please LIKE & FOLLOW, thank you!

Smart & Final Agrees to be Acquired by Funds Managed by AffiliatAPO,SFS: Smart & Final Stores, Inc.
2019-04-16 17:21:00
Smart & Final Agrees to be Acquired by Funds Managed by Affiliates of Apollo Global Management - PR Newswire

$APO - Apollo Global Mgmt Ascending Triangle$APO - Apollo Global Mgmt forming a bullish ascending triangle pattern on the daily chart. Monitor for a break through $36.50 resistance level.
Long term target - $44.00 by year-end
Note: Informational analysis, not investment advice.

APO: Weekly Chart-huge hammer sitting atop the 50 ma.A nice looking 1-2, 1-2 at the start of wave 5.

APO: Incorporating EW with Pivot Points-Most EW Chartistsare using Fibonacci ratios to determine their price targets and supports. By incorporating Pivots, I hope to inculcate a greater sense of discipline in entering and exiting positions.

