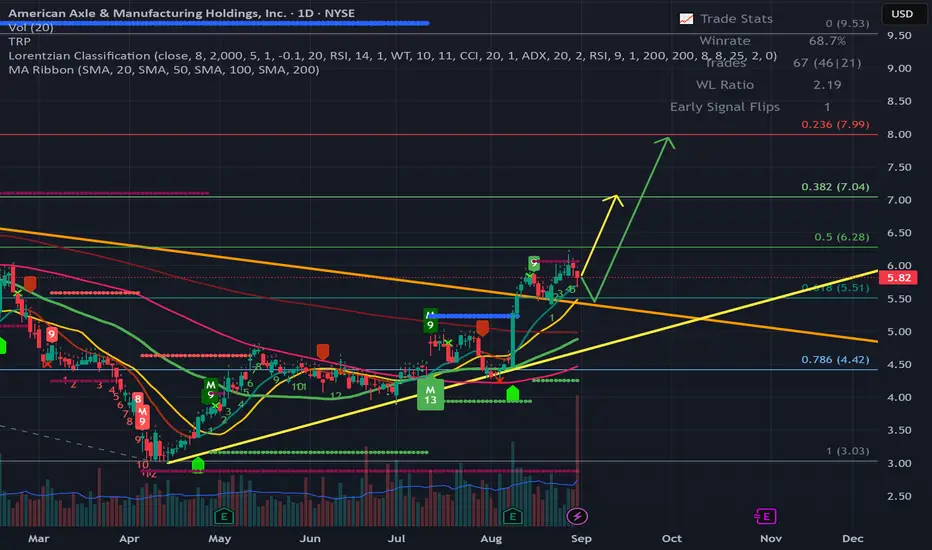
AXL - American Axle & Manufacturing Holding - Breaks Up TrendHello Everyone,
Happy Sunny Sunday to all.
Today i would like to share some stocks to follow up next week and that i beleive we can make good profits and trend is up.
First one AXL.
What they do?
Founded in 1994, American Axle & Manufacturing offers higher-performing next-generation metal forming and driveline technologies and products. Operating internationally, the company has headquarters in Detroit, Michigan.
Financial Details:
Market Cap : 690.62 M
Revenue : 5.83 B
EPS : 0.3442
P/E : 16.91
Technical Details:
It breaks the long down Trend which continues from December 24.
After broke, it re-tests and now continue to go Up. It can try to re-test again which is approx 5.50 - 5.55 and if it makes so, then this Price level could be good entry point for me.
Second options, it continue to go up till 7.00 - 7.05 which is my first Target price, and approx %20-22 up from today's price level.
If it breaks the 5.50 and stay under this level next week then it will go off from my list.
My personal opinion, trend is now Up and short term there is a good opportunity to make a good profits. As i mentioned Target price is 7.00 - 7.05.
This is just my thinking and it is not invesment suggestion , please do not make any decision with my anaylsis.
Happy Sunday to all.
AXL trade ideas
AXL: 3 Falling Peaks Aiming to Initiate A Type 2 Return to $1.00AXL, after giving us a decent type 1 reaction of the 0.886 PCZ, has now begun to slow down and has developed a 3 Falling Peaks pattern with a 4th lower peak for good measure, and it now looks to make a type 2 return to the HOP level, which would take it just below $1.00 if it plays out.

$AXLHidden bullish divergence nearly confirmed on 1D with a bounce off 0.618 fib level. EMAs squeezing, looks ready for next leg up.

$AXLBreakout of a falling wedge& above support.
Triple classic bullish divergence on the daily MACD and classic bullish divergence on the daily RSI.
Stop = Under resistance
1st Target = 200 Day MA
2nd Target = Resistance / Mental resistance @ $10.

fundamental analysis (AXL)Limit buy - 8,60$
Target - 11,50
Risk/Reward Ratio - 7,25
Stop-loss - 8,20

AXL - ReversalAXL looks to be oversold with an RSI of 40. The .5 fibonacci level (10.25) appears to be a reasonable support level since it was tested 3 times in the last 8 trading days.
Looking for it to hold 10.25. First target 11.05, 11.61


AXL Breakout WatchWould prefer AXL to bounce off the support line one more time before entering for the sake of a close stop loss. Maybe there will be a dip at the open

S/R flipLooks like a clean S/R flip, also good uptrend, breakout with above avg volume, and nice consolidation back to the 20ema.
It looks like a nice spot to get in
Target is arguable :D

Possible Another J-Hook Or Cup and Handle Or Roll OverPossible Another J-Hook Or Cup and Handle Or Roll Over

Price action & Psychology - First pullback after breakoutHello !
Key points :
Breakaway gap
Breakout on high volume
First pullback
Volume sinks
The stock consolidates within an ascending triangle, it gets rejected from that significant confluence zone (circled on the left). It makes higher lows but not higher highs, buying pressure slowly builds up, people gain in confidence and are willing to pay higher prices to get on board.
Finally, the stock breaks out - psychological shift in people's mind, they expect the price to go higher, therefore they are willing to pay higher prices. The pullback is caused by profit-taking. In fact, we see a decrease in volume that might keep on going today.
The Fibonacci Retracement is only a reference point, other people are monitoring these levels, which make them significant.
We will monitor the circled zone and wait for a "confirmation" that tells us that buyers are stepping in and that sellers are losing control.
Thanks for reading and if you have suggestions or want to discuss the idea, just leave a comment, I'll be happy to answer.
***Disclaimer : This is not an advice to buy the stock. Please, be aware that trading is a matter of probabilities and that it only takes ONE trader to deny your trade.***


Bullish trade idea $AXLProbably not the most popular ticker in the world but I am watching for a bullish continuation tomorrow with a lean towards the Open And Go, but possibly buying the dip if she tests the 100-15m-EMA which has been recently a common theme on her chart.

AXL HOT [bto] JAN $19 CBreakout mode, jan puts sold and calls bought, EMAs crossing, BREAKOUT SRRRRRRRRRRRRRRRRRRRRRKT


AXLThis is what I see for AXL....Notice every 50DMA break the stock runs for ~4mo. We are 2mo deep in the most recent 50DMA break. Plus just broke this wedge upwards.
