Historical Bank of America Quarterly Log Chart-sneeky breakdown
-back test
Bank of America has confirmed momentum slowdown.
Watch that final breakdown line.
Yikes!
#Bankcollapse #BankingCrisis #BankRuns #BankOfAmerica
Bank of America Corporation Depositary Shares (Each representing a 1/1200th interest in a Share of Floating Rate Non-Cumulative Pref
No trades
Trade ideas

Bank of America Priced in GoldAwful looking chart for Bank of America priced in gold.
Are you paying attention?
#Gold #XAUUSD #Bankcollapse #BankingCrisis #BankCrash #Fintwit

Bank of America TimeFibsChances of pullback according to classic TA is high due to main drop has shifted bulls out of market balance. But lets see FED's decision first. I see tensions there because Jerome said FED is more likely to raise interest rates before collapse of SVB . Now tightening policy might cause a chain reaction with debt pressure to other banks.
In the other hand they must intervene to beat inflation now, so it's not a problem in the nearest future because elections are closing up. Stakes are actually very high, because increasing interest rates might cause drop in world oil prices to punish some oil exporting countries which went completely off the rails and norms of international order.
Markets are nervous right now waiting for FED's decision, so do I. Especially when it comes to dealing with a such ticker during current venerable condition of banking sector.
Upcoming CPI report figures will make FED's next move a little more predictable.
Golden proportions:
Derived angle:

Watchlist 2023-03-13 $BAC $GOLD $RF $SOFISPY - Gapping down with the same velocity and volume seen at the June low. VIX rising to 30, the advanced minus declining vol opening at -2900… This is a fire sale. However, SPY has fallen to the key 382 level in PM, if this level firms for the morning, we could see a bounce 385. With two major banks failing this last week, the predicted FED funds terminal rate is now split between a 25 bps hike to no hike at all.
With the FED backstopping SBV depositors, the fears of contagion may prevent further runs on other banks but it did not seem to prevent equity investors from running to the doors as other banks like FRC dropped another 60% in PM. Looking for higher lows in other weak banks the sell. BAC, SOFI
GOLD - obviously precious metals showing strength this morning with equities falling off a cliff. If GOLD can stay above 16.50, there is room for possibly another move to 17 (which is another ATR move). Don’t expect much more than that. Trying to time it with a lower high on the SPY.
RF - gapping down 3 ATRs to the key 15 pivot. An analyst upgraded RF to a strong buy after the 25% decline from Thursday. RF is dropping to the key pivot on low vol this morning. If it does flush below the pivot and reclaim, this could be a swing failure patter set. Up. If we see the flush then a pullback on sequential declining vol, that is a buy signal. Target to roughly 18.20

SIVB BAC3.12.23 I think this event with regard to SIVB Portends some blowback and more downside to the markets. This doesn't mean that the market isn't going to correct a little bit higher first. I talked about a video by wealthion that you should listen to because they tell you how you can protect yourself with your money in a brokerage firm and how much Safer it is than having it in the bank. I can tell you that I had a brokerage account some years ago.... I forgot that I had the account when the news came out it's at brokerage was going out of business for fraud. It was about a month or so later that I realized I actually had 25,000 in that Brokerage firm. I opened up that account as a backup for my main account, But I forgot I ever had it until I was sent information after the Firm went into receivership, I believe it took almost 10 years to get 50% of the losses back on that account and I never traded it. So brokerage accounts can lose your money too when they miss manage the accounts. Even so, you should listen to the video.... especially if you are planning to trade for a long. Of time because you're young and enthusiastic and you know you're going to trade one way or the other.....listen to what this Fund manager is telling you.

💾 Bank of America Corporation Worst Since 2008 | Major CrashNumber two is Bank of America, this one looks even worst than JP Morgan Chase.
No introduction needed as I already did it with JPM but if you missed the other article let me just say that we are likely entering a "Bank Holiday" period.
Bank Holiday refers to the process of the bankers celebrating as the wealth of 20-40% of the worlds population vanishes.
Ok, the chart:
✔️ Bank of America peaked February 2022 and last month produced a year long lower high.
✔️ This week BAC produced the highest selling volume since June 2020.
✔️ BAC closed Friday below MA200 and EMA300 in a single candle.
✔️ It was already trading below EMA50, EMA100, etc.
✔️ The MACD did a bearish cross while moving below zero... Double whammy.
✔️ The RSI is already weak and gaining bearish momentum.
While everything burns, the executives will pay themselves millions and millions and millions of dollars in bonuses... People will lose everything.
We will see if Crypto will save the day or if it will also go down together with the whale banks.
Or maybe they will decide to print 5 Trillion USD to bailout the banks out and everything...
Namaste.


BANK OF AMERICA Stock Chart Fibonacci Analysis 031123
1) Find a FIBO Slingshot
2) Check FIBO 61.80% level
3) Entry Point > 29/61.80%


$BAC taking sell side into 1hr and daily FVG's $XLFWatching BAC here as it triggers these sell orders into FVG's on longer time frames. I'd be aiming to go long if it digs into those grey boxes.

BAC: Sell idea: Bearish ChannelOn BAC we have a sell idea because we have the breakout of the support line.Thanks!

Sorry Mr Buffett but BAC is going down Sorry Mr Buffett but BAC is going down with all the other financials that I looked up.
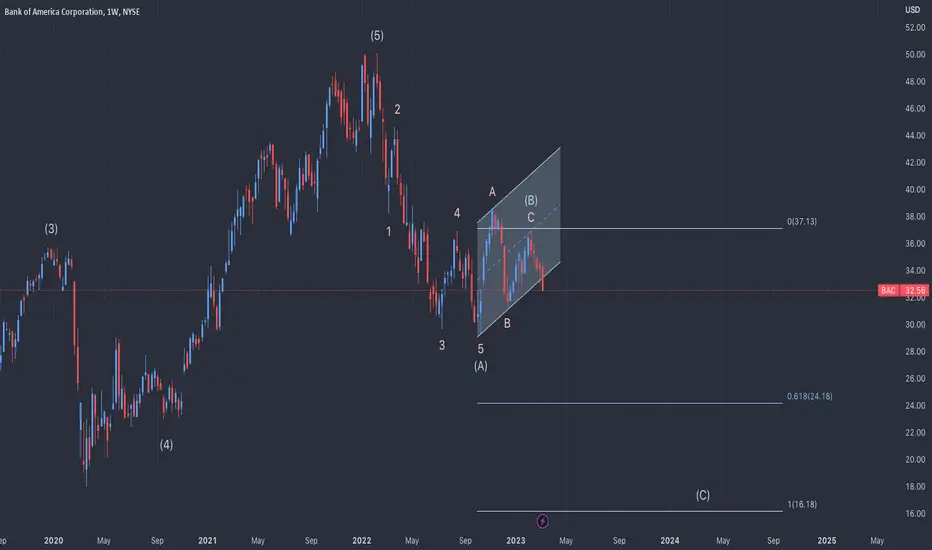
On February 11th, 2022, Bank of America ( BAC ) completed an impulse wave up that began in December 2011, specifically Intermediate Wave (5) on the graph in light blue.
According to the guideline of corrective waves, whenever a five-wave move is complete, a correction occurs that typically ends near the terminus of the prior 4th wave. As such, we have observed 5 waves down that completed Intermediate Wave (A) and an ABC correction for Wave (B). While there is no confirmation that this correction (B) is finished, it may have ended.
An essential clue to note is that if the correction is finished, it suggests that the minor Waves C of this Intermediate (B) correction have truncated and failed to reach the minor Wave A extreme. This truncation is an indication of strong underlying selling pressure in BAC .
If this correction is a zigzag correction, the most common Fibonacci ratio in a zigzag is equality between Waves A and C. A = C at approximately $17, which is the exact target from the Depth of corrective wave guideline. This point represents the terminus for the Intermediate Wave (4) in the previous impulse wave.
The second target could also be a 0.618 ratio of $24. Based on this technical analysis , it appears that BAC is going down with all the other financials.
From a technical analysis perspective, it is worth noting that the assessment made in the statement is also valid from a macroeconomic standpoint. Increases in the Fed's fund rate have a direct impact on the housing market, leading to a decrease in mortgage demand, and ultimately causing mortgage rates to fall. This, in turn, could adversely impact financial institutions, as it could lead to a decline in revenues. Therefore, it is crucial to consider the macroeconomic factors that influence the stock market and financial institutions, such as changes in the Federal Reserve's policies, as they can have significant consequences on the performance of individual stocks and the market as a whole.
Please note that the analysis is my personal opinion and should not be considered as financial advice. It is important to conduct your own research and seek advice from a financial professional before making any investment decisions.

Bank stocks possibly set to fall.. BAC 2020 lows inboundUsing a few different technical targets here we reach roughly the same outcome... Head and shoulders target on the daily(if the neckline is broken) will take us back down to 2020 low. A bear flag on the daily would also see us down near that low, trade safe trade smart folks.. this is just what I see and not financial advice*

61.8% & 50% retracement while respecting the arc.Firstly, I look for a good retracement level, either 50% or 61.8%, then I draw the arc to see if price respects it, then I look for pins or double bottoms, triple bottoms or head and shoulders.


BAC Bullish Call
Total revenue for 2022 was $92.41 billion. From 2013 to 2022, the revenue increased by 10.08%

Bank of America Long-TermAll long-term psychological targets and Support/Resistance levels are at fib intersections.
Here are some short/mid term targets:
Forecasts by institutions
Goldman Sachs: 54
Societe Generale: 46
Morgan Stanley: 51
JPMorgan Chase: 52
Citi: 57
Deuche Bank: 51
Atlantic Equities: 55
Oppenheimer & Co: 54

BACBAC and GS are the most oversold financial stocks . I see that BAC finds some support on moving averages and 3 MAs are crossed at the same price. this could be a buy signal for the long term and bac will test its December high or even go up. if not I think it will consolidate at moving averages.

BAC: Sell ideaAs you see on the chart we have a sell idea because we have the breakout with force the support line and the vwap by the sellers.Thanks!

BAC: Sell ideaOn BAC as you see on the chart we have a sell idea after the breakout with force the vwap.Thanks!


BAC: Sell ideaSell idea because as you see on the chart we have the breakout with force the vwap by a big red candle ! Thanks!
