CDLR — Institutional Gap & 8EMA Support Test🏢 Company & Catalyst
Snapshot: Cadeler A/S is a leading offshore wind turbine installation and maintenance firm, operating a specialized fleet of high-tech jack-up vessels primarily in the North Sea and Asia-Pacific.
Why Now: Following a powerful "Institutional Gap" and breakout in late January 202
Cadeler A/S Sponsored ADR
No trades
Next report date
—
Report period
—
EPS estimate
—
Revenue estimate
—
3.48 USD
70.38 M USD
269.06 M USD
87.59 M
About Cadeler A/S
Sector
CEO
Mikkel Gleerup
Website
Headquarters
Copenhagen
Founded
2008
IPO date
Nov 27, 2020
Identifiers
3
ISIN US12738K1097
Cadeler A/S engages in the supplier within the offshore wind industry for installation services and operations and maintenance works. It owns Windfarm Installation Vessels, Pacific Orca, and Pacific Osprey. In addition, it also offers construction and decommissioning tasks. The company was founded in 2008 and is headquartered in Copenhagen, Denmark.
Related stocks

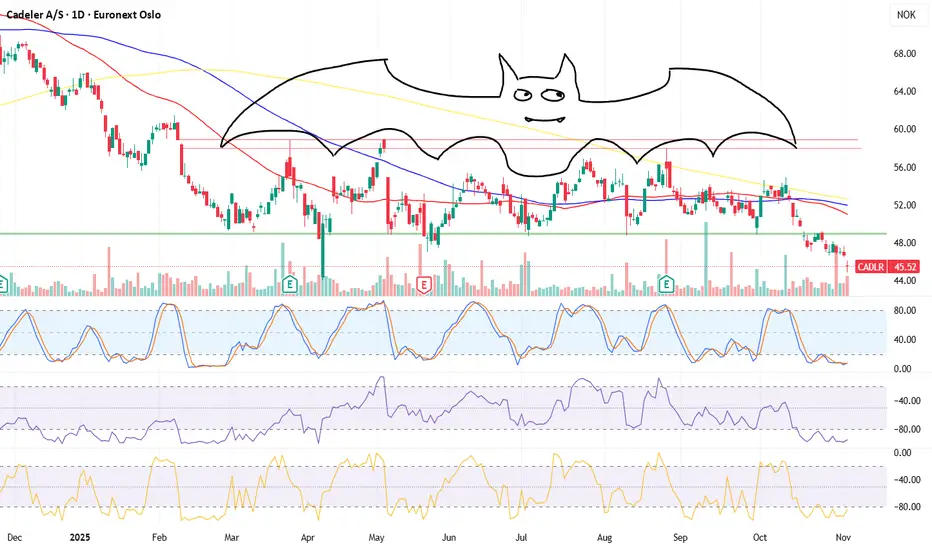
the bat aftermathread the picture... Once upon a chart, in a quiet market valley, the candlesticks gathered every day to whisper secrets about price.

Phoenix incoming...My previous idea on Sep 9:
The veterans on the forum whispered, “That’s a bat pattern… the market’s telling us something.”
They spoke of it almost like folklore — a secret signal only revealed to those patient enough to wait for symmetry, for numbers to align just right. Some called it superstition,
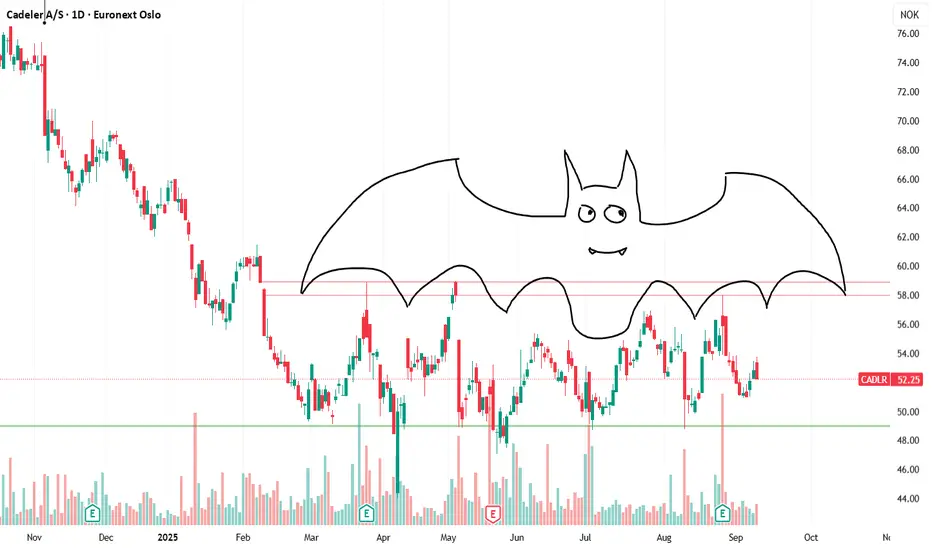
The Bat Pattern The veterans on the forum whispered, “That’s a bat pattern… the market’s telling us something.”
They spoke of it almost like folklore — a secret signal only revealed to those patient enough to wait for symmetry, for numbers to align just right. Some called it superstition, others called it science.
Cadeler’s Wind-Powered Surge - €2.5B Backlog to Fuel Growth Cadeler A/S (OB): Riding the Offshore Wind Wave
In a nutshell, what I see is a stock whose price declined by 33% from October 2024 to September 2025, despite the fact that the company is now in a much better position, with better ratios, much better revenue, and great value.
Company Overview
C

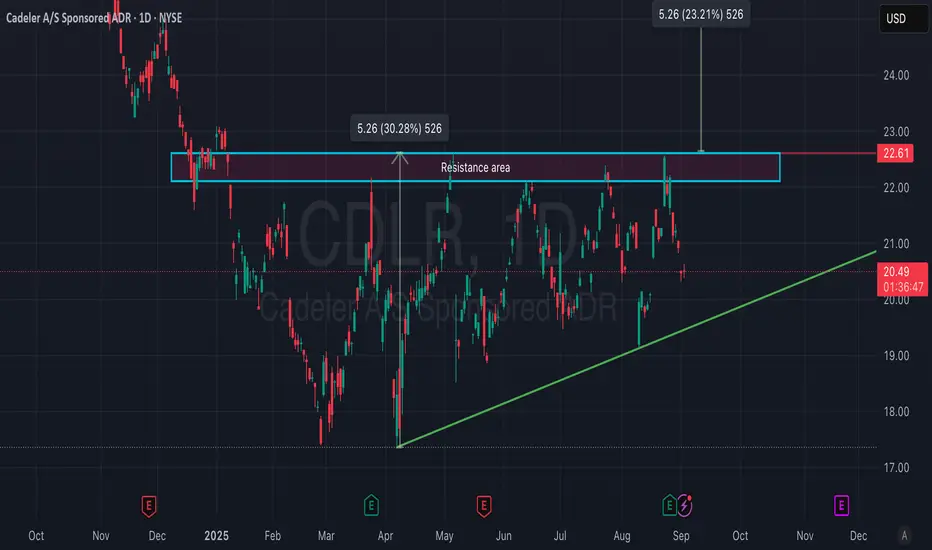
Cadeler A/S (CDLR) – Ascending Triangle Breakout WatchCadeler A/S ( NYSE:CDLR ) is testing the $22.60 resistance area within an ascending triangle pattern. A breakout above this zone could trigger a continuation move to the upside.
Entry trigger: Breakout and close above $22.60 resistance.
Profit target: Around $28.75 (previous major high), ~23% pote
Moving up sideway channel retrace fib zone or volume boxThe sideway movement could continue unless it breaks out of resistance, which could start a new trend with a bullish sentiment.

Careful with Cadeler, Possible fadeCareful with trading cadeler. May be taken right back to where it came from.


if you own cadeler AS: runif you own cadeler AS: run. They don't even deserve a capital letter on their name anymore.

See all ideas
Summarizing what the indicators are suggesting.
Neutral
SellBuy
Strong sellStrong buy
Strong sellSellNeutralBuyStrong buy
Neutral
SellBuy
Strong sellStrong buy
Strong sellSellNeutralBuyStrong buy
Neutral
SellBuy
Strong sellStrong buy
Strong sellSellNeutralBuyStrong buy
An aggregate view of professional's ratings.
Neutral
SellBuy
Strong sellStrong buy
Strong sellSellNeutralBuyStrong buy
Neutral
SellBuy
Strong sellStrong buy
Strong sellSellNeutralBuyStrong buy
Neutral
SellBuy
Strong sellStrong buy
Strong sellSellNeutralBuyStrong buy
Displays a symbol's price movements over previous years to identify recurring trends.