DHT - Precision Swing Long TradingView Idea: DHT (DHT Holdings) - Precision Swing Long (Perfect Technical Alignment + Value)
🎯 Ticker: DHT (NYSE)
📈 Type: Swing Long
⏰ Timeframe: Daily & 4H
📊 Technical Analysis:
Multi-Timeframe Trend: BULLISH Across All Timeframes (Daily, 4H, 1H) ✅
Technical Consensus: RARE "Triple Buy" Signal (Daily, 4H, 1H Recommendations)
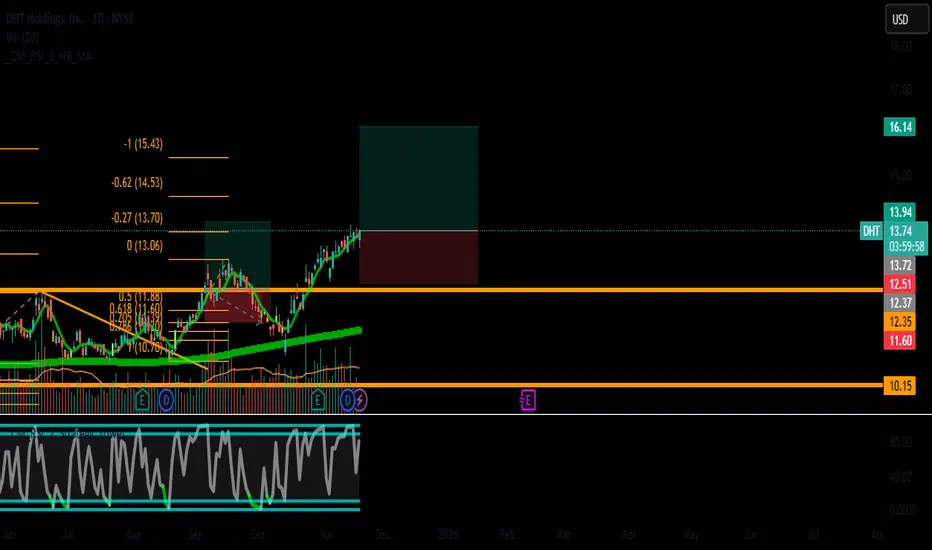
Momentum: RSI (67.6) shows strong bullish momentum without being overbought
Pattern: Trading in a tight consolidation range, poised for a breakout above $13.70
💡 Trading Thesis:
DHT presents an exceptional technical setup combined with attractive valuation:
PERFECT TECHNICAL ALIGNMENT:
Uncommon "Triple Buy" signal across all major timeframes indicates unified bullish pressure.
Price is above all key moving averages, confirming the uptrend.
Consolidation near highs suggests accumulation before a potential breakout.
STRONG FUNDAMENTAL SUPPORT:
Undervalued: P/E ratio of ~11 is attractive for the sector.
Healthy Balance Sheet: Perfect 10/10 Debt Health Score with manageable leverage.
Stable Operations: Moderate earnings growth provides a solid foundation.
SECTOR TAILWINDS:
Tanker shipping rates showing resilience, providing a favorable backdrop.
⚡ Trading Plan:
🎯 Entry: $13.72 (Breakout above consolidation resistance)
🛑 Stop Loss: $12.50 (Below key support and the 50-day SMA)
💰 Profit Target: $16.14 (Measured move from consolidation pattern)
📊 Risk/Reward Ratio: 1:3.1 (Exceptional for a swing trade)
📉 Risk Management Notes:
Stop Loss is placed to protect against a false breakout and a shift in the daily trend.
Consider taking partial profits near $15.00 if momentum slows.
The excellent R/R ratio allows for a smaller position size to maintain strict risk control.
Only enter if the breakout above $13.70 is confirmed with volume.
Conclusion: DHT offers a high-probability, high-reward setup driven by a rare perfect technical alignment and supported by a value-oriented fundamental case. The 1:3.1 risk/reward ratio makes this a compelling swing trade opportunity.
Trade with discipline!
Disclaimer: This is not investment advice. Conduct your own research and manage risk according to your personal tolerance and strategy.
#DHT #SwingTrading #Long #Shipping #TechnicalAnalysis #Breakout #ValueInvesting
Trade ideas
DHT (DHT Holdings, Inc.) - RSI2 Momentum Swing Trade🎯 Trade: Long (Buy)
📊 Timeframe: Daily (D1) / Swing Trade (5-10 days)
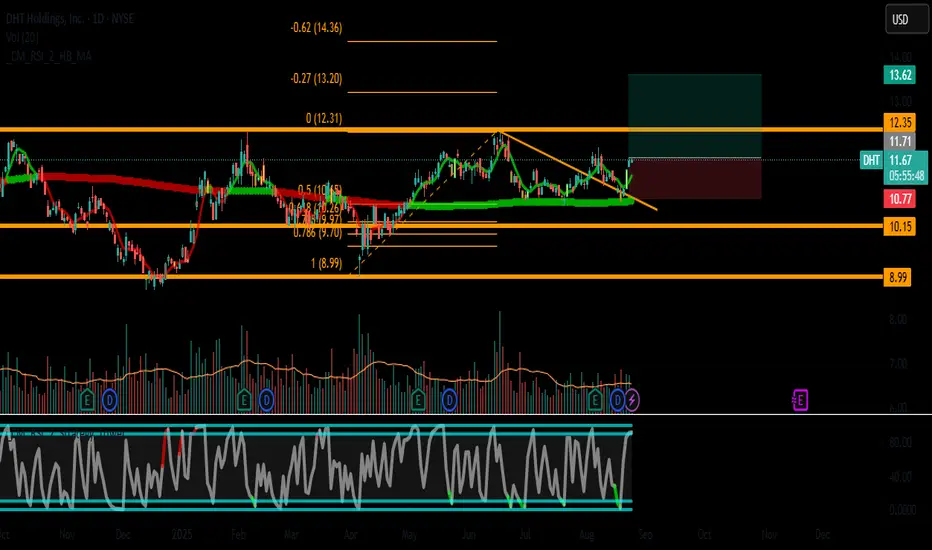
💰 Entry: $11.65 (Current level + RSI2 confirmation)
🛑 Stop Loss: $10.77 (Below key support & SMA 20)
🎯 Take Profit: $13.62 (Resistance zone + R:R 1:2)
📉 Risk/Reward Ratio: 1 : 2.0
🔍 Technical Analysis
✅ RSI2 Momentum Signal:
RSI2 Connors Strategy triggered a "Buy signal" on Aug 18-19, indicating short-term oversold conditions have reversed.
This signal often precedes short-term bullish momentum swings.
✅ Trend & Price Action:
Primary Trend: Daily trend is Alcista (Bullish).
Price is trading above SMA20 ($11.29), confirming short-term strength.
Immediate resistance break could accelerate momentum toward $13.
✅ Volume & Momentum:
Volume is supportive of the move.
RSI (normal) is at ~57, showing healthy momentum without overbought conditions.
📈 Fundamental Context
Moderate Growth: Net Income showed moderate growth YoY.
Low Debt: Strong balance sheet with manageable debt (Debt Score: 8/10).
Valuation: Fairly valued on P/B but slightly overvalued on P/S. This is a technical-driven trade, not a long-term fundamental hold.
🎯 Why These Levels?
Entry ($11.65): Optimizes risk-reward near current levels with RSI2 confirmation.
Stop Loss ($10.77): Below SMA20 and recent swing low. Protects against failed momentum.
Take Profit ($13.62): Targets the next resistance zone + aligns with a clean 1:2 R:R.
⚠️ Risk Considerations
Swing Trade Only: This is a short-term momentum play based on RSI2.
Market Sentiment: Shipping stocks are sensitive to oil volatility and global trade sentiment.
Always use a stop loss. Do not risk more than 1-2% of your portfolio.
📢 Conclusion
DHT offers a clean swing trade setup:
✅ RSI2 Connors Buy Signal active.
✅ Bullish daily trend with price above SMA20.
✅ Strong risk-reward (1:2).
I am long DHT at $11.65 for a swing toward $13.62.
🔔 What do you think? Will the RSI2 momentum continue?
#Trading #Stocks #DHT #Shipping #RSI2 #Connors #SwingTrading #Momentum
Disclaimer: This is not financial advice. This is a short-term technical trade based on RSI2 signals. Fundamental outlook is neutral. Manage your risk and do your own research.
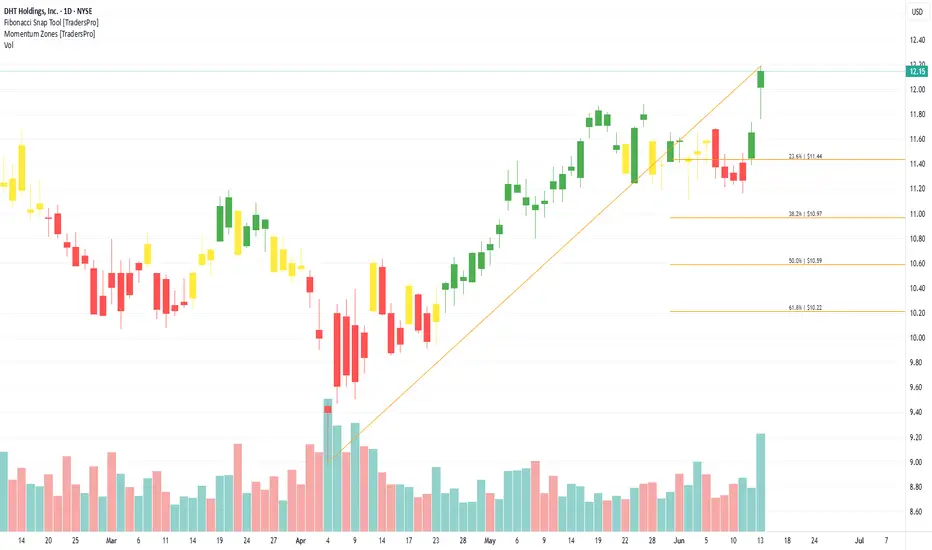
DHT Holdings, Inc. (DHT) Grows With Oil Shipping DemandDHT Holdings, Inc. (DHT) operates a fleet of crude oil tankers, primarily VLCCs (Very Large Crude Carriers), transporting oil across major global shipping routes. Known for its modern fleet and strong charter contracts, DHT benefits from steady demand for oil transportation and global energy trade. The company’s growth is driven by oil consumption, fluctuating shipping rates, and tight vessel supply, which helps support strong day rates and earnings when demand spikes.
On the chart, we see a confirmation bar with rising volume, signaling bullish momentum. The price has entered the momentum zone after breaking above the .236 Fibonacci level. Using the Fibonacci snap tool, traders can set a trailing stop just below the .236 level to protect gains while staying in the trade.
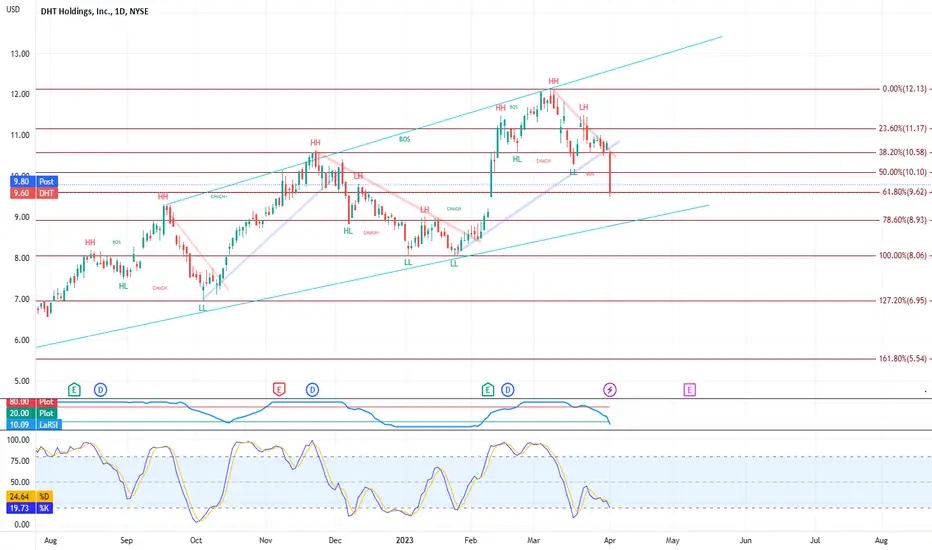
DHT Long Trend continuation trade
just for learning purposes.
Keep an eye out for volume, RSI and MACD gap

Still appears bullish and still has momentum...DHT Holdings, Inc. engages in the operation of a fleet of crude oil tankers. It operates through its integrated management companies in Monaco, Singapore, and Oslo, Norway. The company was founded in 2005 and is headquartered in Hamilton, Bermuda. @threads NYSE:DHT #DHT #stocks #stockmarket #investing #trading #money #forex #investment #finance #invest #bitcoin #business #investor #entrepreneur #cryptocurrency #trader #financialfreedom #crypto #wallstreet #wealth #daytrader #motivation #forextrader #success #daytrading

$DHT Marine cargoNYSE:DHT good volume spike on a up day on this dry bulk marine transportation, the uptrend is a good one and possible target are 11.50/12.00 for a base then 15 - 16

Buy the dip long idea DHTOpen 1/4 size here and if it dips below then buy with rest of the 3/4 size.
DHT Holdings Inc (Long)DHT Holdings Inc
Long
Entry at 8.72
Take Profit at 9.67 (10.89% profit from entry)
Stop loss at 8.25

Short DHT to around 5.5 before continuing uptrend to 30$+Trendline support, strong resistance on DHT.. short short-term.. But bullish longterm! Trend upwards should resume in Decemeber 2021

DHT: Breakout Confirmed, 20.13% Potential Profit!Description: DHT is trending higher and in an uptrend meaning that highs are getting higher and lows are getting higher. The uptrend line on the chart and the Trending Band Indicator (which measures trend) supports the Long Position.
Stats:
1. Ideal buy range: $6 - $6.2
2. Take profit: $7.28
3. Stop Loss: $5.82
4. Risk To Reward: 1 / 5
5. Accuracy Rating: 93%

$DHT making a good run channeling upA dip in momentum this last week but still held easily at its support line. This has headroom so I bought more today with a price target of $6.40 in a 5-7 week time frame. Solid channel up means this is a textbook swing trade. Goodluck! Not financial advice, just my find!


DHT LongWedge breakout
One Swing crossed SMA50 (1st) and SMA200 (2nd)
Entry 6
Stop 5
Target 8.5
I am not a PRO trader. I trade option to test my trading plan with small cost.
The max Risk of each plan is less than 1% of my account.
If you like this idea, please use SIM/Demo account to try it.


$DHT - broken down trendIve held DHT for years for the dividends.
May be adding some here. It's historically volatile and has major resistance at $6.14
It may be one to watch to pick up under $5 for a swing trade to make a few thousand dollars if you can buy enough shares.
It does have a golden cross on the horizon, but its not that convincing at this time.

DHT Buying & Take profit LevelLoad up more at 5.06$ , 4.40$ , 3.95$
Take profit... 6.45$, 8.65$
Using Support & resistance levels

DHT Analysis - NeutralDear Investor,
A short analysis on DHT its chart, this should be enough information to give you a good snapshot of the current scenario's that could unfold. Currently Neutral.
I was screaning stocks to buy - currently not holding any positions.
Kr,

DHT short term scalp opportunityDHt coming up on a lower trend; buy short term long; look to buy at trend support 4.96; stop loss 4.77; target profit 5.33


Reversal Coming Soon?DHT has shown bullish diverging RSI on the weekly time frame since February 2020. The chart also looks like an inverse head and shoulders with the current price forming the shoulder. If oil remains elevated and RSI breaks upwards DHT may move up as well. I think I'm going to buy a few shares to speculate.

DHT Holdings is offering a 37% Dividend!I know my dividend plays may seem boring - but please read on!
Who said that value is dead? If you want risk exposure to energy - this is the place to have at it.
Incredible Value here - P/E 3.49
Dividend 37.43%!
P/FCF 3.8 (Great cash flow)
Debt/Eq 0.69 (Moderate & largely LT debt)
Sales PAst 5Y +28%
Sales Q/Q +131%
ROA +15%
ROE +29%

crazy over sold HUGE Div stockThey May cut dividend at some point but the price is rock bottom with limited risk. im gonna try and get this at 5 bucks and sit on it forever.
