PulteGroup, Inc. - Swing Trade SetupNYSE:PHM - PulteGroup, Inc. - Swing Trade Setup
High-probability breakout play in homebuilding sector
🎯 TRADE PARAMETERS:
Direction: LONG
Entry: $137.57 (on pullback or breakout confirmation)
Stop Loss: $127.57 (-7.3%)
Take Profit: $158.27 (+15.1%)
Risk/Reward Ratio: 1:2.1
📊 TECHNICAL ANALYSIS:
Chart Pattern: Bullish consolidation above key support
Momentum: RSI showing strength without overbought conditions
Volume: Increasing volume on upward moves
Key Levels:
Support: $127-$130 zone
Resistance: $150 psychological level
🏠 FUNDAMENTAL CATALYSTS:
Strong housing market fundamentals
Favorable demographic trends (millennial home buying)
Solid earnings growth trajectory
Reasonable valuation within sector
⚖️ RISK MANAGEMENT:
Position size: 1-2% of portfolio risk
SL below recent swing low
TP at next major resistance zone
🔄 TRADE MANAGEMENT:
Move SL to breakeven at +5-7% profit
Consider partial profits at +10%
Trail stop on strength
Chart: Daily timeframe
Disclaimer: This is educational content, not financial advice. Trade at your own risk. Past performance doesn't guarantee future results.
#PHM #Homebuilding #SwingTrading #TechnicalAnalysis #PulteGroup
Trade ideas
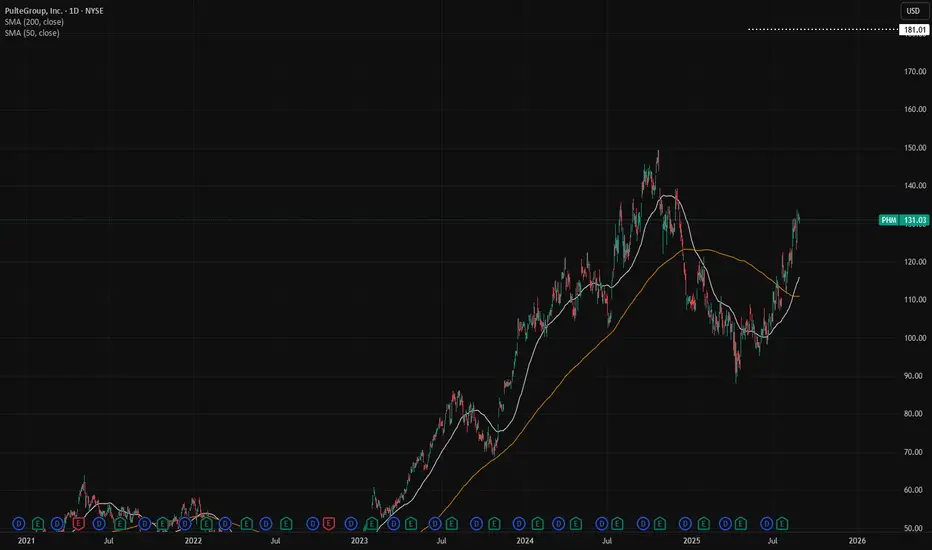
PHM: Fundamental Analysis +45%With 2024 revenue of $17.95 billions, PulteGroup is an american homebuilding company. EverStock identifies a fundamental revaluation potential of +45 %.
Valuation at 8.4 x net earnings :
Currently valued at $25.88 millions in market capitalization, PulteGroup posted a profit of $3.08 billions in its latest fiscal year (2024).
Balance sheet and debt :
In the company annual report, tangible net asset value stood at $12.00 billions, giving a market capitalization / tangible net asset value ratio of 2.16.
The gearing ratio is good, at 0.18. (Total financial debt / net tangible assets valuation).
Current share price: $130.70
Target price: $181.01
Upside potential: +39 % (including dividende income)
Dividend: $0.44 ($0.22 per quarter)
Yield: 0.34 %
Buy of breakoutUptrend
As you can see, the chart is in an uptrend. It has reached a resistance trend line and has reacted to it. I have found that trading based on price levels has been very effective for me. I am now waiting for a strong confirmation above this level, around 122. My estimate is that the price could reach 140 after a successful breakout of this key resistance level. If I get a buying position, my stop-loss will be placed just below the broken price level.

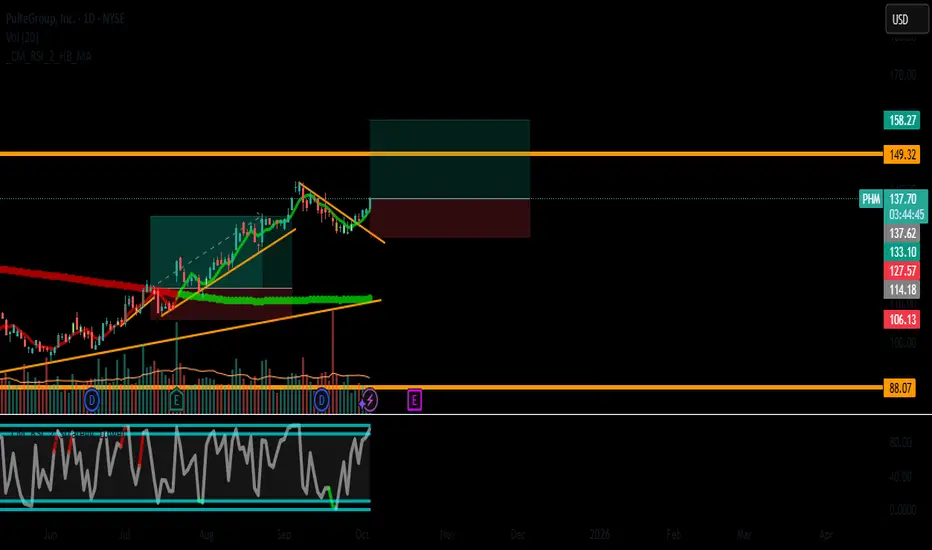
PHM (PulteGroup) – High-Probability Swing Trade Setup📈 Symbol: PHM (PulteGroup)
⏳ Timeframe: Daily Chart
⚡ Strategy: Swing Trade (2-4 Weeks)
🎯 Trade Setup
Entry Zone: $114.00 (Daily SMA 20 + Psychological Support)
Stop-Loss (SL): $104.80 (8% below entry, below SMA 50)
Take-Profit (TP): $133.10 (+16.7% upside, Historical Resistance)
Risk-Reward Ratio: 1:2.4 (Controlled Risk, High Reward)
📊 Technical Analysis
✅ Trend:
Strong Uptrend across all timeframes (Daily, 4H, 1H).
Higher highs & higher lows confirmed.
✅ Key Support Levels:
$114: Confluence of Daily SMA 20 + 38.2% Fibonacci retracement.
$110: Daily SMA 50 (Institutional accumulation zone).
✅ Indicators:
RSI (14): 69.51 (Neutral, no extreme overbought signal).
MACD: Bullish crossover + Positive histogram expansion.
Volume: Rising on bullish candles (Confirms buying interest).
Key Levels:
Resistance: $120 (Recent High), $133.10 (Final Target).
Strong Support: $104.80 (Technical SL level).
💰 Fundamental Backing
Strong Growth:
+Strong Growth in Net Income (+18.5% YoY).
Stable revenue in a resilient housing market.
Healthy Balance Sheet:
Minimal Debt (Score 10/10, Debt/Equity: 0.17).
Fair Valuation (P/E 8.13 – Undervalued vs. sector).
Catalyst: U.S. Housing Demand + Pro-Housing Policies.
⚡ Trade Execution Plan
1️⃣ Entry: $114.00 (Confirmed Technical Support Zone).
2️⃣ Stop-Loss: $104.80 (Protects against trend reversal).
3️⃣ Take-Profit: Scaled Exit –
TP1: $120.00 (Sell 50% to lock in profits).
TP2: $133.10 (Trailing stop to capture momentum).
4️⃣ Dynamic Management:
Move SL to $110 after reaching $120 (Secures gains).
📌 Why PHM?
Strong Sector: Housing market recovery with sustained demand.
High Liquidity: Avg. Volume ~2.5M shares (No slippage risk).
Technical + Fundamental Alignment:
Uptrend + Strong Fundamentals = High Probability Trade.
⚠️ Risk Management
Max Risk per Trade: 1-2% of capital.
Avoid Key Events: Interest rate reports (Check economic calendar).
🎯 Final Call: BUY PHM at $114, SL $104.80, TP $133.10.
🔔 Follow for More Swing Trade Setups!
👍 Like if You Find This Helpful!
#TradingView #Stocks #PHM #SwingTrading #RealEstate #TechnicalAnalysis
(Disclaimer: Not financial advice. Do your own research.)

PHM CHART UPDATE PHM top rejection trend in red.
Bottom support in Green.
Mid term support and rejection show in light green and red.
All price targets labeled.
Trends extended.
Ghost feed is a guideline.
Careful above 180.
Careful into earnings it looks like a drop to stable levels around 94 to mid 80's which these levels can take us back upwards to the 120 mark, which can then climb upwards to around 145 and then 180.

$PHM with a bearish outlook following its earnings #StocksThe PEAD projected a bearish outlook for NYSE:PHM after a negative under reaction following its earnings release placing the stock in drift D with an expected accuracy of 44.44%.

PHM UPDATED CHART - What's NEXT?What's next?
I'm not certain, but it looks like price can hold this key zone and use the rejection trends to bounce upwards to the 184 target (which is adjusted upward from 170).
RSI on the weekly is somewhat gapped, but bullish.
RSI on the daily is bullish.
RSI on the 4, 2 and 1 are near bottoms, so it's not a bad guess to say, maybe with all these indicators resetting and as we are nearing a strong support trend and strong horizontal support line, we might see a bounce.
good luck phm dudes.
also, bbbyq, gme and a whole bunch of other fun coming up.

PULTE GROUP (PHM), THIS DUDE GIVES AWAY LOTS OF MONEYYou can follow the ceo on twitter.
He often has live streams where he obviously talks about his company among other things.
He also gives away a lot of money. It seems he genuinely cares and enjoys giving away money. It seems partly for his image, but imo, he created a win/win. With the amount of money he has given away, he's earned some good publicity.
(I've never received money as a disclaimer, I mention this because a lot of his twitter feed is about giving)
He talks about GME and BBBY often.
Flys a chopper.
Won't give me a ride.
For his stock.
Honestly, he seems awesome, but his stock is getting to the scary zone.
Now, I say this because even though it is a scary zone, there is a lot of potential upside momentum can carry the price to.
So, earnings on the 23th is important to note.
It will likely have an effect on price. I assume from the looks of things, price might see a decent upside movement to 125-145 range and then see a significant downside before recovery.
I think I labeled most of the important things on the chart.

PHM is going to see some massive support jump in2 massive trend lines on the bottom side of price, one of which is likely to spring the price to at least 95, and possibly even 130. Even if we drop past 63, there is still price support and a likely chance you'll see price jump from these levels. This stock is massively bullish.
These trend lines are BIG. There is potential to see the price move quickly, and there is even more potential to see it reject that top trendline.
It's close for sure, I think these next few moves likely occur over the next few days to weeks. So you could see some up and down getting ready for a bigger move to the upside.
There is so much support layered on this chart, it's hard to be a bear in the long term.
Buy zone is somewhere between like 65-54.
I draw snakes on charts.
thank you for looking.

PHM PARABOLIC MOVEI mean, if you can't see that something major is happening with this stock, you're high...
HOWEVER, Holy Gaps batman.
Topside pump takes us to around 125, with a max of like 136. There is support but watch out for a retracement from whatever "good" sounding news is coming. This stock is being setup to drop over 50%.
Personally, I like the dog coin next, you can see my chart below.
WHY real-estate when you can buy data? PHM needs to figure out how to monetize whatever data they can collect.

I HATE the new notifications @ Tradingview My feedback, as this is a terrible design. I'm missing a ton of notifications.
Please at least give us the option to move it back.
Sincerely,
a somewhat loyal customer.
Also, I wrote my feedback on my very bullish stock pick, Pulte Group.
Thank you for your time.

PHM Providing macro outlook return PHM Has shown an incredible, consistent return over the last few decades. Channel support and resistance show a great return ahead for the macro portfolio. Center dotted line may act at resistance, but ultimately top channel will be revisited.

PULTE GROUP Stock Chart Fibonacci Analysis 052423Trading Idea
1) Find a FIBO slingshot
2) Check FIBO 61.80% level
3) Entry Point > 66/61.80%

$DHI on the rise?The Alligator indicator is a popular technical analysis tool that is used to identify trends and potential trend reversals in the market. It consists of three lines, which are the jaw, teeth, and lips. These lines are created by moving averages of different periods, with the jaw representing the longest period, the teeth representing the middle period, and the lips representing the shortest period.
When the Alligator lines are converged, it indicates that the market is in a period of consolidation, and there is no clear trend. However, when the lines diverge, it can indicate that a trend is developing. This is where the "alligator mouth" comes into play, with the lips opening up in the opposite direction to the teeth and jaws.
In the case of NYSE:PHM , if the Alligator mouth is open and the lips are moving upwards, it may suggest that a bullish trend is emerging. The trader may be looking for a breakout above the $66.07 level, which could confirm the upward momentum and potentially trigger a price rally.

PHM - Minor Low in Sideways TrendITB has been a strong sector that has pullback with Macro (interest rate) uncertainty.
Prices consolidated after the earnings spike and have made a two leg pullback.
Pro's - fresh (Y/Y) after G/G. RAF at extreme. Vscore @ support. Darvas and L2 support. Prices are within 34ema trend. Prices have volume support.
Con's - Trend has weakened. No propulsion momentum.
Entry - $54.25
Breakeven Target - Due to Darvas/volume resistance and y/y trend. $55.20
Profit - $56.70
21APR23 55 Calls

PulteGroup Has Entered Short ZoneI'm scaling into a short on PulteGroup with excellent risk/reward. Staggering to me that home builders across the industry are seeing their stocks soar today, despite an absolute routing of their revenues. There is a lag in revenue reporting and the distress they are experiencing will be reflected in their earnings soon. From a technical standpoint, this trade makes sense with the stop as pictured.

PMH SELL +++Homebuilder stocks are soaring on short term profit from last year, lol. Interest rates for a 30 year mortgage are approaching 7%, we haven't had the fallout from a recession yet with millions of job losses, foreclosures, defaults, repossessions then and ONLY then would I say we have hit a bottom and it's time to buy. This stock is likely up on short covering, which they should just be adding not covering the horizon looks bleak for the American economy built on debt and money printing

Clear explanation of how to find a pattern in a chart.Clear explanation of how to find a pattern in a chart. Today we look at the bullish flag and bullish pennant

WATCH $PHMBearish
Price lost momentum
Double top
Head and shoulders
Retesting key level S/R
Lowers heads / lower lows
“Success is the sum of small efforts, repeated day in and day out.”

PHM - Long after wedge breakoutAfter a 5 wave rally, the stock has corrected in a three-wave pattern. The correction has retraced 78.6% of the 35.03-47.19 rally and prices are rising again, breaking outside the wedge that has been forming since end of July. My take profit comes in at which the rally from the lows will be equal to the previous rally around 50.5 My stop is below the recent lows at 36.50

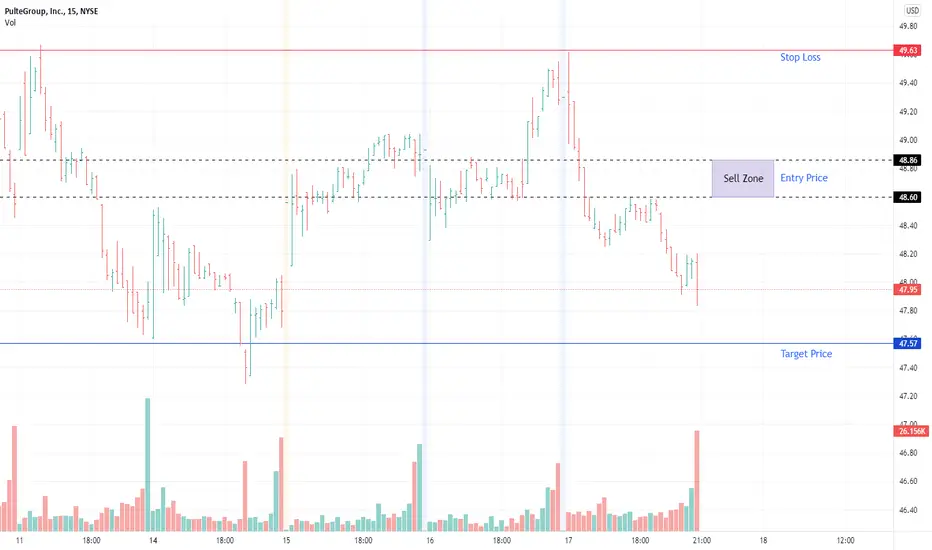
18/2/2022 NYSE (PHM)Short (Entry Price) within the sell zone area and exit (Stop Loss) above the red line. Can take profit at the suggested Target Price.
Long AgainI am referring on my stopped out deal opened at 18:48 today. Now that it seems to me that the downward correction is over and the momentum still in favour of the stock I am buying it back at a lower price.

MomentumWe have taken out the November high and spiked up with good momentum. Suppose the market will test the value of this spike ant try whether the August tops can reached again.
