ABC Bullish Earnings 7-27Possibly has reached C but would be nice to have confirmation. If this is at C then stop would go under C. Tucking it away where Mr. Market does not find it on a simple pull back can be a smart move if you plan to hang.
Today's candle pattern is a Harami cross which may represent indecision, but can also represent a reversal but needs a third day for confirmation. Haramis are not always opposite in color. Candles should be interpreted by where they appear in the trend and some do not have much if any significance. For instance a shooting star candle at the top is known to be an ominous signal, but at the bottom it is an inverted hammer. A hanging man candle at the top can mean the current uptrend trend may be in trouble, but at the bottom it is a hammer.
This one really needs more confirmation that C is C as yesterday was a new monthly low.
No recommendation and earnings are on 7-27, so volatility could occur. Folks get nervous and may sell before earnings day. Just depends.
Trade ideas

Perfect falling wedge on $PHM #PHM .Perfect falling wedge on $PHM #PHM .
Follow me to be alerted when it break the wedge .
#SwingTrading
#NASDAQ
#SP500
#stockstowatch
#StocksToTrade
#trading
#qqq #spy #SPX

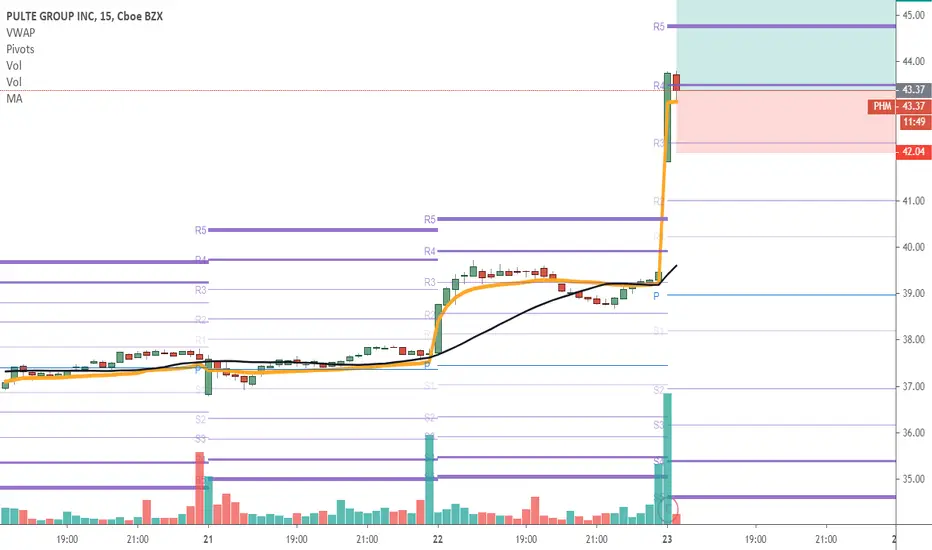
PHM at 50%Took a small position to play the 50% of PHM that I've been watching at the level for the last week.

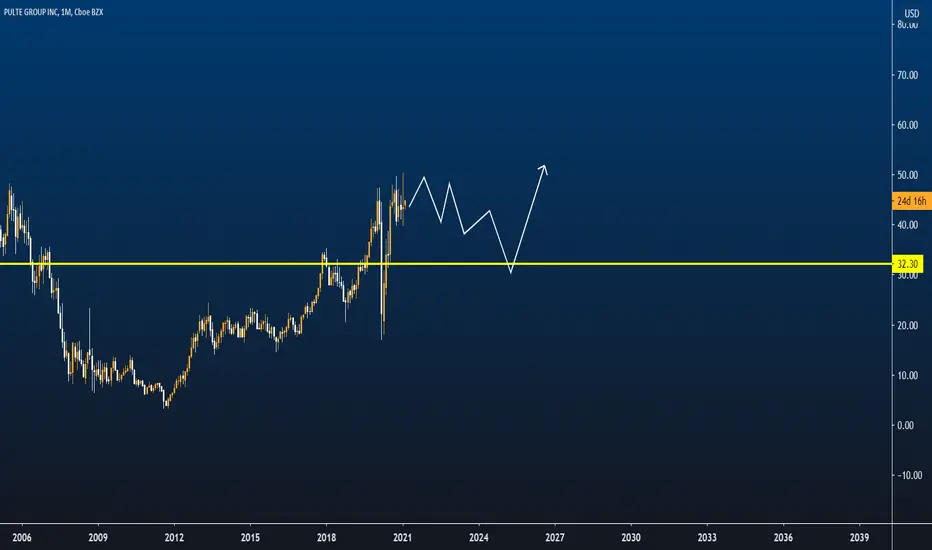
PulteGroupThe price is at a crucial support area which is also backed up by the 50MA, the 38 Fibonacci retracement and a multimonth trendline. The trade can be entered when the reversal candle at 57,01$ is confirmed. The stop should be placed at 53$. If the support area does not hold an entry at around 50$ can be considered as it has provided a significant support area in the recent past.

PHM gap upLower than expected earnings + shooting star pattern on average volume + gap up = short 3:1


PHM Fundamental good and best Entry for Long term HoldingPHM Fundamental good and best Entry for Long term Holding

Pulte Group Poised for New HeightsNice break out of a short term downward resistance line in what is an overall bullish channel backed by supporting home and building data out of the US. If we can settle above $47 I think we see $55 area.

Rising WedgesI have noted tons of rising narrowing wedges in the market since the craziness started..
I have also noticed they can win over an ascending triangle just about everytime!
Too much buying sent almost every stock in the home building sector in to a down spin..
I am sure it will recover and this is just one example..DHI, LEN, MTH etc all suffered the consequences of the bearish rising and narrowing rising wedge..
2 trendlines that both slope up and converge at the apex without healthy pull backs..
I have noted a RW can make a C&H pattern fail in a heartbeat..
These stocks are not bad stocks, they are victims of too much buying or irrational exuberance..in the end supply and demand are out of kilter and there is no one left to buy..
This is just an example..CRM is trying to recover from this lion of a pattern..
Just be on the look out...
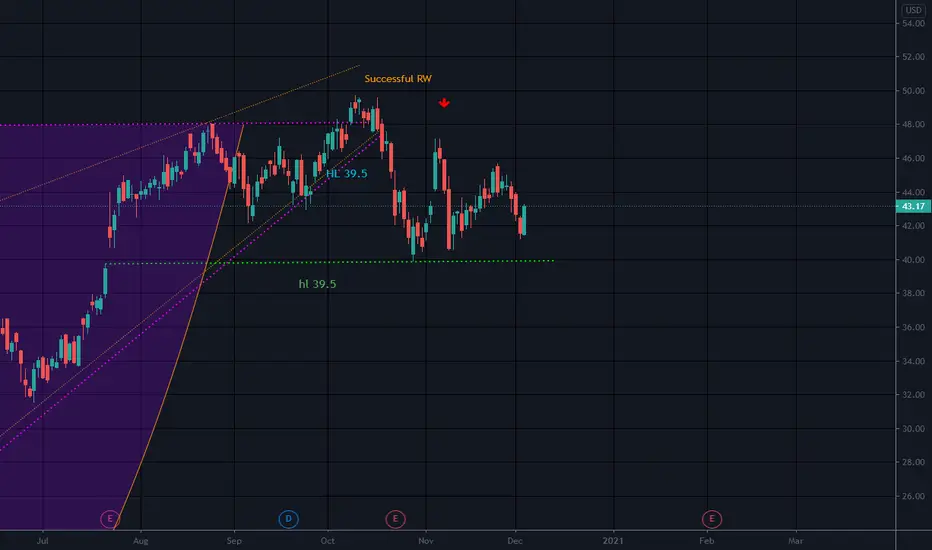

Rising WedgeI have posted PHM earlier but a rising wedge has taken form
Rising wedges are usually bearish
PHM has fallen from the bottom trendline of the RW, and hopefully the handle low will catch it
Not a recommendation
Neutral until fall complete
MDC and KBH, LEN, DHI and MTH all have their own RWs they are falling from
(I hate RWs) LOL
There for a while it seemed home builders were gonna keep on keeping on
Only thing that never changes...is change
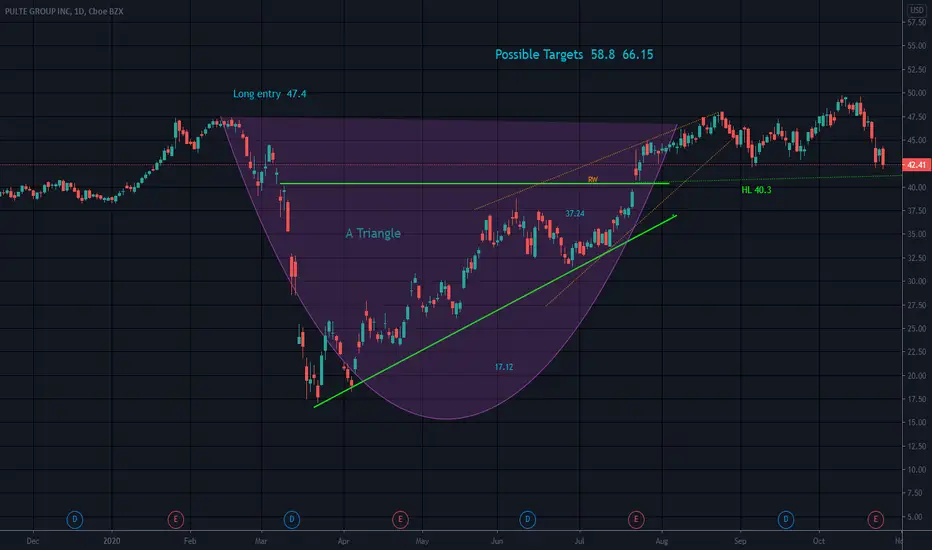
Cup and HandleHome Builders arestill on the move
Possible T2 77.6
PHM broke from an A Triangle at 48.35. After a break up from an A triangle, the top trendline can serve as support.
The handle low as well as mid cup are also support levels
There is also a small gap up at the handle low that makes the handle low a strong support level for PHM
No rising wedges noted
NV is high and short is low
PHM has surpassed the prior high from many years ago (2004) which is a hurdle for sure
Not a whole lot of R overhead
Not a recommendation
Happy Trading


PHM BUY OR LONG , TARGET UP TO $60PHM confirm the "Symmetrical triangle" pattern, the price of this bull cycle target is $60 .
PHM buy : $48
PHM target : $60
Stop loss : 6%
Wish you a good deal!


Ascending Triangle Cup and HandleNo rising wedges noted
Strong S from upper trendline of A triangle at 40ish
Correction/Old high is at 48.23 to chart Old R at 48.23 not at 52ish
Not a recommendation

PULTE GROUP Recommendation DailyHey guys, PULTE GROUP is in a bullish push, small buying volume hammer candle great potential to go on the last previous high and may even go above if the buyers are still there.
Please LIKE & FOLLOW, thank you!