RCL Royal Caribbean Cruises Options Ahead of EarningsI you haven`t bought RCL before the rally:
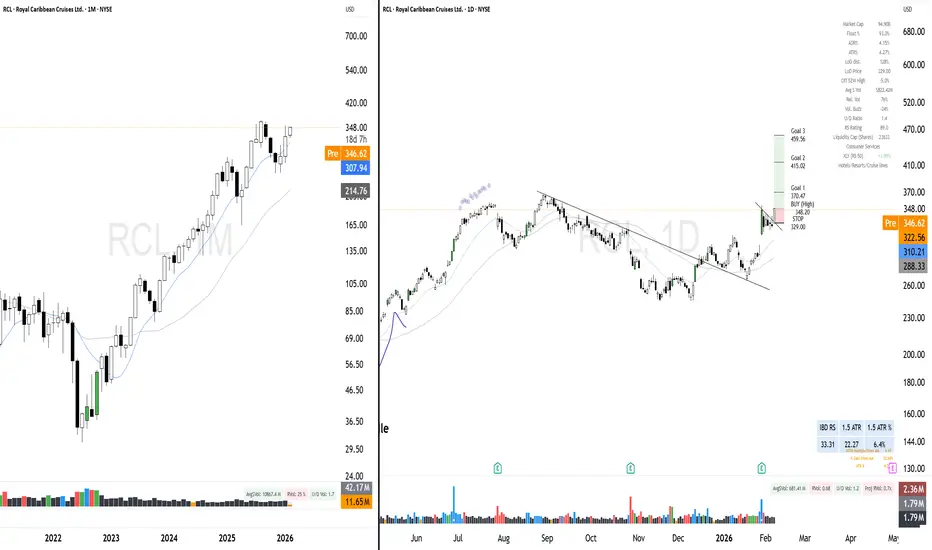
Now analyzing the options chain and the chart patterns of RCL Royal Caribbean Cruises prior to the earnings report this week,
I would consider purchasing the 310usd strike price Calls with
an expiration date of 2026-3-20,
for a premium of approximately $13.40.
If these options prove to be profitable prior to the earnings release, I would sell at least half of them.
What traders are saying

RCL Long term tradeContext: The consumer is still spending on experiences. RCL is seeing record bookings.
The Setup: "Mid Cheat" entry after a strong earnings gap up.
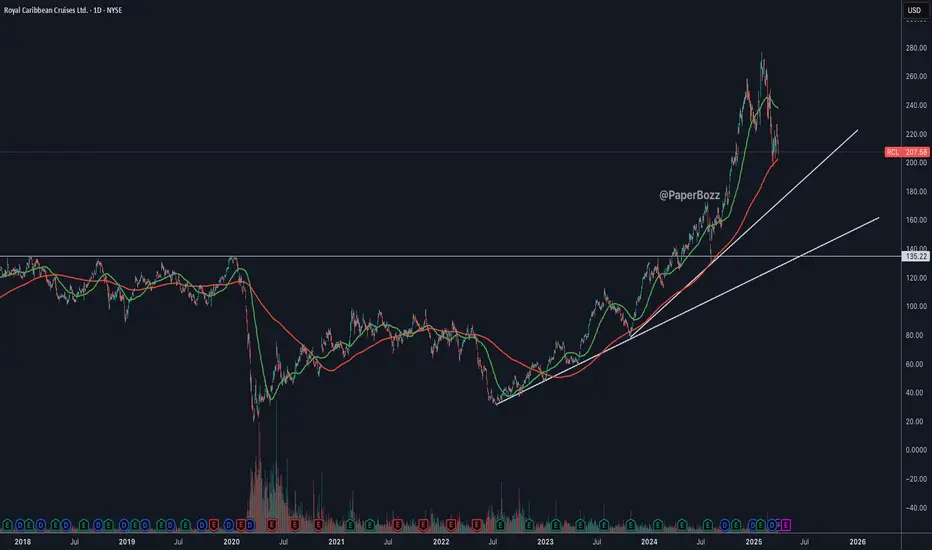
RCL: Stop Guessing. The Path to $300 ExplainedRCL: Stop Guessing. The Path to $300 Explained
Most traders try to catch a falling knife. They see a price drop, they think it’s cheap, and they buy. Then it drops again. They get cut.
But professionals don't guess . We wait for the floor to become solid. We wait for the market to TELL us it is ready to move.
Look at the chart of NYSE:RCL I have shared. The market just screamed a clear message, and you need to hear it.
The Psychology of the "W"
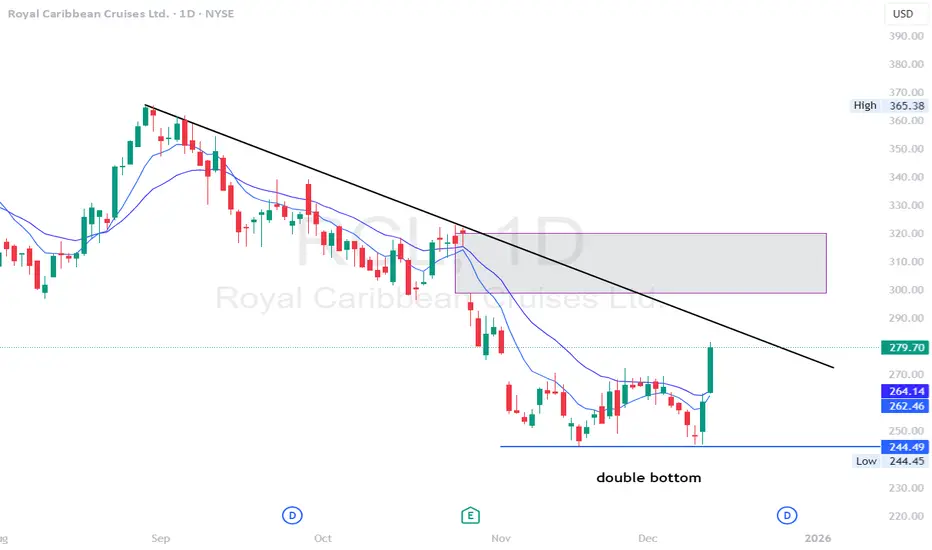
Do not just look at the lines, look at the story. We have a textbook Double Bottom . This "W" shape is powerful for one reason: Exhaustion .
First V: Sellers pushed the price down. Buyers stepped in.
Second V: Sellers tried one last time to break the low. They FAILED.
That failure is your signal. It means the sellers are gone, and the buyers are taking control.
Statistically, this setup has a 78% success rate . Those are odds I like to play.
The Truth Serum: Volume
A pattern without volume is just a drawing. A pattern with volume is a breakout.
Look at the bottom of the chart. When the price broke the yellow neckline at $272.82 , it didn't just drift over the line. It EXPLODED through it with a massive spike in volume.
That green volume bar tells you that Institutional Money has entered the room. They aren't testing the waters, they are committing .
The Consequence: The Road to $300
Now that the trap has sprung, where does the price go?
When we analyze the measured move (the height of the W projected upwards) and look at the Volume Profile on the right, the resistance disappears. The heavy traffic is behind us.
The path of least resistance is now UP. The first psychological magnet is $300 .
My Battle Plan for RCL
Now you see the pattern. You see the target. But seeing is not executing.
Executing a good entry is easy, but the exit strategy is 80% of the game .
Knowing exactly where to place your Stop Loss to survive the volatility, and where your Take Profits maximize returns, that is the art.
I also apply a specific Risk-Free Trade management strategy. While I can't explain the full mechanic in this post, this technique drastically reduces even more the stress and pushes the probability of a successful outcome to over 90% .
Here are the levels I would use to set-and-forget for a Zen Trading experience:
🎯 Take Profit: White lines ($290-300) | > 6% Potential
🛡️ Stop Loss: $265 Zone (Below the breakout) | ~ 3% Risk
⚖️ Risk/Reward: 2:1 Ratio (Winners pay double the cost of losers)
🎁 Let’s make a simple deal.
I will handle the heavy lifting to find the top 1% of setups like this, and you just HIT the 🚀 Rocket and Follow.
If you scroll past now, the algorithm might ensure we never meet again.
Secure the connection and I promise to keep these high-probability setups coming. Sounds like a fair trade, right?
🤝 Deal?

RCL - double bottom bounce hereRCL - Stock moving higher after forming a double bottom bounce on the daily, Stock moving with other travel stocks. Stock has trendline resistance at $286. looking for $300 plus if that level breaks. Stock is decent at indicator levels.
Royal Caribbean approaching rough seas?The consensus view strongly indicates that Royal Caribbean presents an unfavorable risk-reward profile at current valuation levels. Despite impressive operational recovery metrics including 69.5% net income growth and 73.4% diluted EPS growth in FY2024, the stock's valuation appears disconnected from underlying fundamentals. The premium multiples (P/E 20.9x, EV/EBITDA 13.2x) are difficult to justify given the company's high financial leverage (debt-to-equity 2.75x) and negative working capital position of -$8.1 billion.
Technical analysis reveals concerning momentum patterns, with the stock having recently experienced a sharp correction from severely overbought conditions. While some indicators now show oversold readings, this reflects deteriorating investor sentiment rather than a buying opportunity. The cyclical nature of the cruise industry, combined with high capital intensity and ongoing financial stress, creates substantial downside risk that current valuations fail to adequately price.
While the company's post pandemic recovery trajectory is commendable, the market appears to have overextended its optimism. The combination of stretched valuation metrics, high leverage, and technical deterioration suggests limited upside potential with significant correction risk. Investors should consider reducing exposure or waiting for more attractive entry points that better reflect the company's fundamental risk profile.
All things considered, short term recovery is possible, but long term views remain bearish for the time being.

A cyclical long idea for a travel cruiseThe main long cyclical idea came after I remembered what happened to cruise companies in the pandemic era that generated a bear market for them, but now I have to say the market has been regaining their up cyclical trend.

Royal Caribbean Cruises BUYRoyal Caribbean is a top beneficiary of the post-pandemic travel boom. Record bookings in cruises and leisure travel have driven exceptional earnings results and bullish sentiment.

Royal Caribbean Cruises — Double Top Signals Rough Seas AheadPrice action in Alliant Energy has developed a clear double-top reversal pattern , with the neckline now broken on strong momentum. This structure signals exhaustion of the prior uptrend and the possibility of a bearish leg unfolding.
Adding further conviction, the MACD indicator has printed a bearish crossover (MACD line crossing below the signal line), showing that momentum has shifted in favor of sellers. This dual confirmation — pattern + momentum — strengthens the short-side outlook.
Trade Plan :
Entry : immediately
Stop-loss : Just above the recent top / right shoulder (adjust as per risk tolerance).
Target : 342

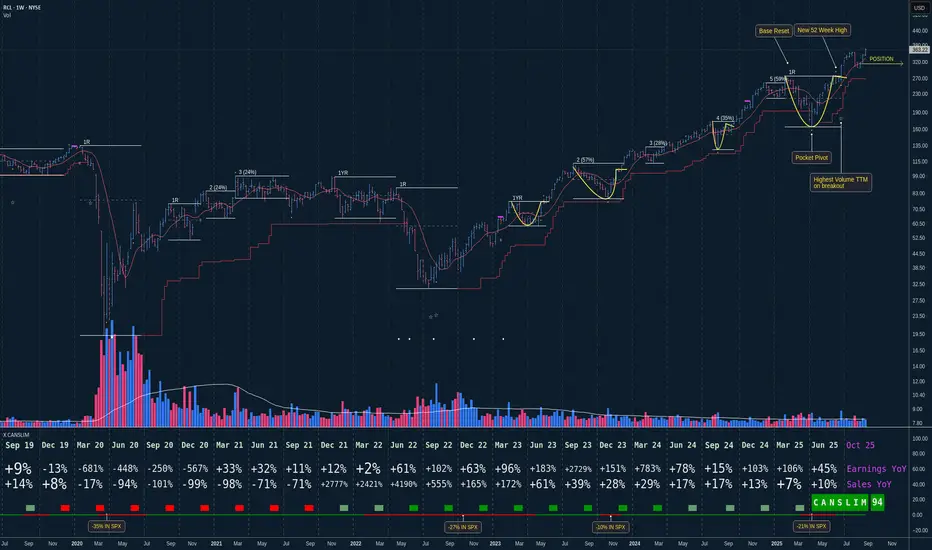
RCL clearing a Cup with HandleWe maybe are at the start of the next leg up in RCL !
Key points:
1. Fundamentals are good with a strong RS Rating of 94 right now.
2. We are at a new Market cycle since June 25.
3. We are at an early Base 1 just after a reset.
4. Pocket Pivot at the base low.
5. Last base draw a Cup with Handle patterm that was broke with highest volume TTM.
6. Fresh 52 Week high observed during the handle.
4 & 5 are the footprints of institutional accumulation.
Even with the small correction after the breakout I entered late on this one but I still entered a small position in it.
The ATR x 10 (red line) seems quite good at guarding the trend so I'm using it as a trailing Stop.
RCL Starting a BreakoutNYSE:RCL starting to do what it does, break out.... starting a new uptrend...
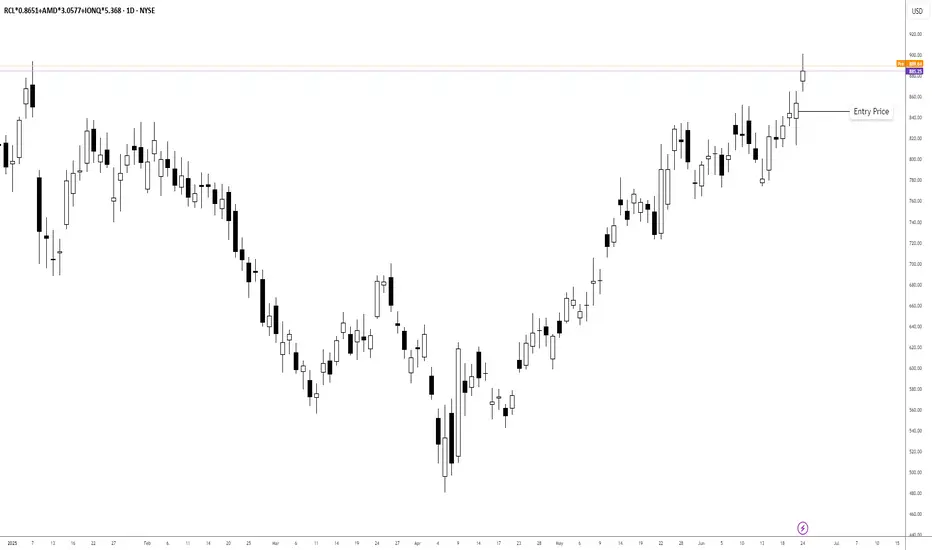
2025/06/24 Portfolio BalanceAdvanced Micro Devices, Inc. (XNAS:AMD):
Current Value: $423.28
Current Price: $138.43 (6.39% daily change)
Quantity: 3.0577
Purchase Date: April 23, 2025
Purchase Price: $129.51
Purchase Value: $396.00
Total Change: 6.89%
Royal Caribbean Cruises Ltd. (XNYS:RCL):
Current Value: $242.63
Current Price: $280.47 (2.42% daily change)
Quantity: 0.8651
Purchase Date: June 3, 2025
Purchase Price: $273.71
Purchase Value: $236.79
Total Change: 2.47%
IonQ, Inc. (XNYS:IONQ):
Current Value: $219.15
Current Price: $40.86 (-0.69% daily change)
Quantity: 5.3634
Purchase Date: June 3, 2025
Purchase Price: $39.90
Purchase Value: $214.00
Total Change: 2.41%
Past Trades
2025/06/03 Bought Hims & Hers Health Inc 1.8192 @ 5,497.00
2025/06/03 Bought Hims & Hers Health Inc 1.8202 @ 5,494.00
2025/06/03 Bought Hims & Hers Health Inc 1.8185 @ 5,499.00
2025/06/03 Bought Hims & Hers Health Inc 1.8205 @ 5,493.00
2025/06/03 Bought Hims & Hers Health Inc 1.8252 @ 5,479.00
2025/06/03 Bought Hims & Hers Health Inc 1.8165 @ 5,505.00
2025/06/20 Sold Hims & Hers Health Inc 3.1685 @ 6,303.00
2025/06/20 Sold Hims & Hers Health Inc 1.5822 @ 6,308.00
2025/06/20 Sold Hims & Hers Health Inc 2.1804 @ 6,328.00
2025/06/23 Sold Hims & Hers Health Inc 3.9889 @ 4,510.00
SHORT $RCL | Recession UnderwayRoyal Caribbean bailout cash drying up.
This chart is a good indication of current economic weakness.
I am looking for NYSE:RCL to drop 60% - 80% from the all time high.
I will continue to monitor and provide updates.
God bless!

RCL Eiffel Tower CAUTION! UPDATERCL is in a very capital-heavy industry that is very economically sensitive.
I first published this Idea back on February 11, 2025. Since then, it has dropped over -40%.
Normally, I would say that from erections come corrections. However, this has the Eiffel Tower structure in place for a full-on reversal.
I am reposting this chart since TV forced me to post a "target reached."
Here is the original post.

RCL Eiffel Tower CAUTION!RCL is in a very capital-heavy industry that is very economically sensitive.
Normally I would say from erections some corrections. However this has the Eiffel Tower structure in place for a full-on reversal. That remains to be seen. For now, we look for at least a correction and go from there.
Caution is in order if you are long.

$RCL - Possible trendline retestNYSE:RCL I don’t think the 200-day moving average (DMA) will hold this time. It will have to fall back to the trendline. The question is, will it stop at the first trendline?
Royal Caribbean Hovers Near GapRoyal Caribbean hit an all-time high four weeks ago, but it’s been sliding since.
The first pattern on today’s chart is the series of lower highs since January 31. Notice how each followed a tepid uptrend that failed to hold. The last may be viewed as a bearish flag within the context of a new short-term downtrend.
Speaking of short-term downtrends, the 8-day exponential moving average (EMA) is below the 21-day EMA. MACD is also falling. Those patterns may reflect a bearish direction.
Third, prices tried and failed to hold the rising 50-day simple moving average. That may suggest its intermediate-term trend is negative.
Next, earnings lifted RCL on January 28 but the rally didn't hold. Are investors abandoning ship on the fundamental story?
Finally, the cruise ship operator jumped above $220 on November 6 after the election. That could make traders look for prices to test that gap.
TradeStation has, for decades, advanced the trading industry, providing access to stocks, options and futures. If you're born to trade, we could be for you. See our Overview for more.
Past performance, whether actual or indicated by historical tests of strategies, is no guarantee of future performance or success. There is a possibility that you may sustain a loss equal to or greater than your entire investment regardless of which asset class you trade (equities, options or futures); therefore, you should not invest or risk money that you cannot afford to lose. Online trading is not suitable for all investors. View the document titled Characteristics and Risks of Standardized Options at www.TradeStation.com . Before trading any asset class, customers must read the relevant risk disclosure statements on www.TradeStation.com . System access and trade placement and execution may be delayed or fail due to market volatility and volume, quote delays, system and software errors, Internet traffic, outages and other factors.
Securities and futures trading is offered to self-directed customers by TradeStation Securities, Inc., a broker-dealer registered with the Securities and Exchange Commission and a futures commission merchant licensed with the Commodity Futures Trading Commission). TradeStation Securities is a member of the Financial Industry Regulatory Authority, the National Futures Association, and a number of exchanges.
TradeStation Securities, Inc. and TradeStation Technologies, Inc. are each wholly owned subsidiaries of TradeStation Group, Inc., both operating, and providing products and services, under the TradeStation brand and trademark. When applying for, or purchasing, accounts, subscriptions, products and services, it is important that you know which company you will be dealing with. Visit www.TradeStation.com for further important information explaining what this means.

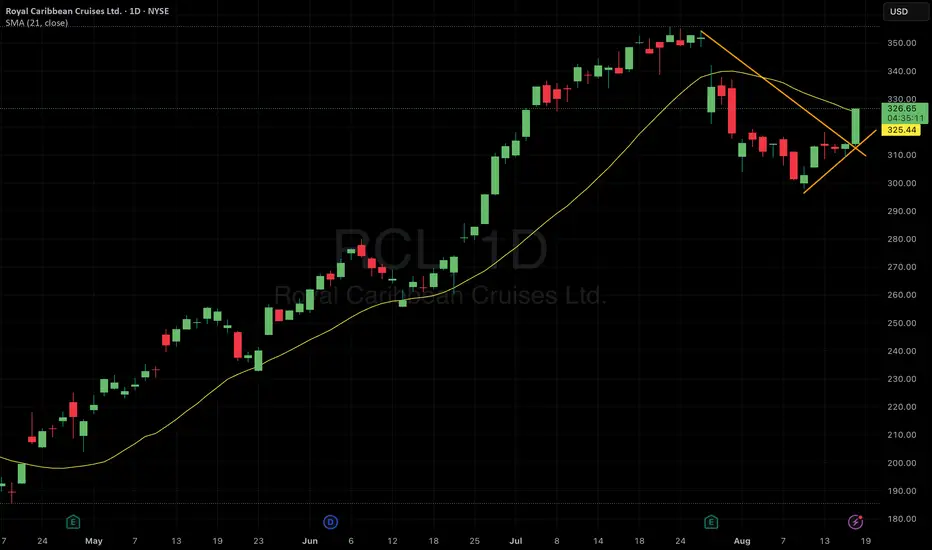
$RCL - A Bounce off the Rising Trend LineRCL is exhibiting a bounce off a rising trend line on the daily chart, suggesting a continuation of an uptrend. A rising trend line typically connects higher lows, indicating sustained buying pressure over time. This bounce could signal a resumption of bullish momentum after a pullback to test support.
RCL saw quite a bit of strength into the close, getting the stock above the 5 day MA. Couple this with a move off a volume shelf and RCL presents a nice setup with a reward to risk ratio of better than 2:1.
An entry at Friday's close (assuming RCL does not gap up on Monday) has a price target of previous highs at $277.00. This is a 12% gain to the upside. A stop loss just below the bottom of the rising channel gives a 5% stop loss. The ADR is $9.90 per day, so this stop loss gives RCL enough room to move without being stopped out.

RCL BUYRCL Buy set up on the Daily. Nice bounce off the Monthly S1 pivot point and a pullback into Fib buy zone. Nice R/R

Earnings BreakoutI love the earnings season. During earnings season we see great setups that are tradable almost every day.
This is also the case today with RCL . Breakout under enormous volume and high relative strength. NYSE:RCL

Royal Caribbean Cruises Ltd. (RCL): Leading the Cruise IndustryRoyal Caribbean Cruises Ltd. (RCL) is one of the world’s largest cruise lines, offering unforgettable travel experiences across stunning destinations. Known for its innovative ships, Royal Caribbean combines luxury, entertainment, and adventure for travelers seeking memorable vacations. The company’s key services include cruises, onboard activities, dining, and excursions, making it a leader in the travel and leisure industry.
Royal Caribbean’s growth is fueled by increasing demand for travel, fleet expansions, and a focus on sustainable cruising. On the stock chart, RCL recently displayed a confirmation bar with rising volume, pushing the price into the momentum zone. This indicates strong investor interest and potential upward movement.

RCL - crusing up the channel?CAPITALCOM:RCL has been on a steady upwards move on the daily since October of last year, keeping within a pretty narrow channel. No huge deviations up or down, just easing up. During the market turmoil recently, we saw a fake break of channel to the downside, which was quickly corrected back into the safety of the channel. Price is also respecting the 50 EMA, with some recent deviations due to the recent market reactions. MACD is turning up as a result and is on its way to green territory. RSI has crossed the signal line, these are the two indicators I most often follow. On the fundamentals the company slightly beat expectations on its latest release. JP Morgan said recently that cruises are now 20% cheaper than land-based alternatives (vs. 10-15% cheaper in 2019), and they predict a shift in favor of cruising. And, they just this week labeled CAPITALCOM:RCL "best in class" among cruise lines. In terms of analyst ratings (I usually focus on technicals), according to Stockanalysis.com 16 of 18 analysts has a Buy or Strong Buy recommendation on the stock (Strong Buy: 10, Buy: 6, Hold: 2). Expect CAPITALCOM:RCL to move up towards the channel roof, setting target 1 around $173 as this is ATH. Seeing as there is no resistance above this, if it breaks it might move even higher.

Buy Royal Caribbean CruisesShort Term Trading Advice by Naranj Capital
Buy Royal Caribbean Cruises
● Buy Range- 228 - 233
● Target- 245 - 248
● StopLoss- 222
● Potential Return- 5-6%
● Duration- 12-14 Trading Days

$RCl - new all time highs incomingRCL - stock in uptrend as holiday season approaches. Stock making higher low on daily time frame and looking bullish for a move towards all time high. looking for calls above $235 for a move towards $240 and higher. Stock is strong on indicators.
