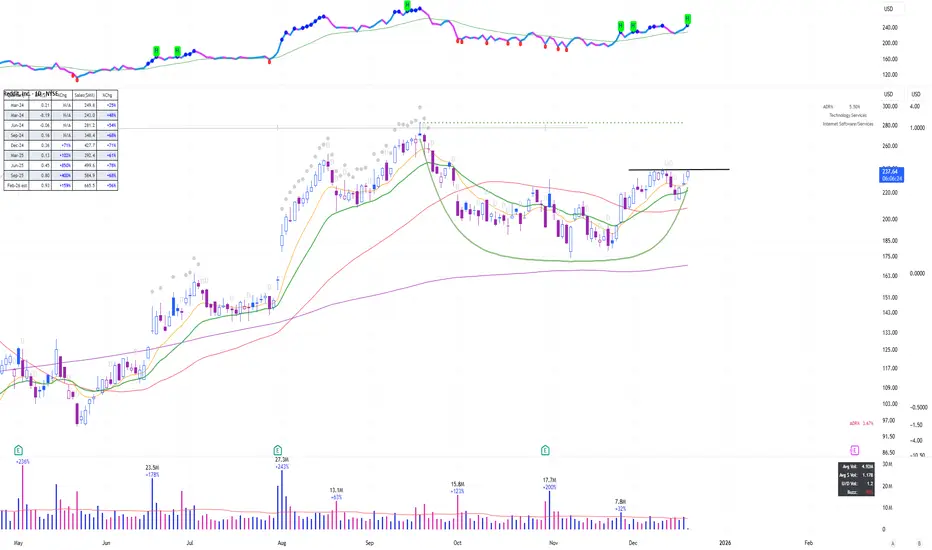
Technical Analysis is All About Pattern RecognitionNYSE:RDDT : The Cup-and-Handle and VCP Breakout Setup
RDDT has established a clear "rhythm": after a two-month consolidation, it consistently reclaims the 20-day SMA (Red Line), followed by a volatility contraction phase where the price stops making new lows.
The stock just completed a Cup-and-Handle pattern, forming a 1 to 1.5-month Volatility Contraction Pattern (VCP) before breaking out, signaling that supply has been fully absorbed.
The recent +5.23% move on expanding volume successfully cleared the $240 psychological level, marking a fresh breakout from the consolidation high. This "breakout within a base" confirms that the trend is ready for its next leg higher.
Summary: By reclaiming the SMA 20 and breaking out of the tightest part of the pattern, RDDT is showing a high-probability continuation signal. As always, manage your risk and keep stops below the previous swing low.
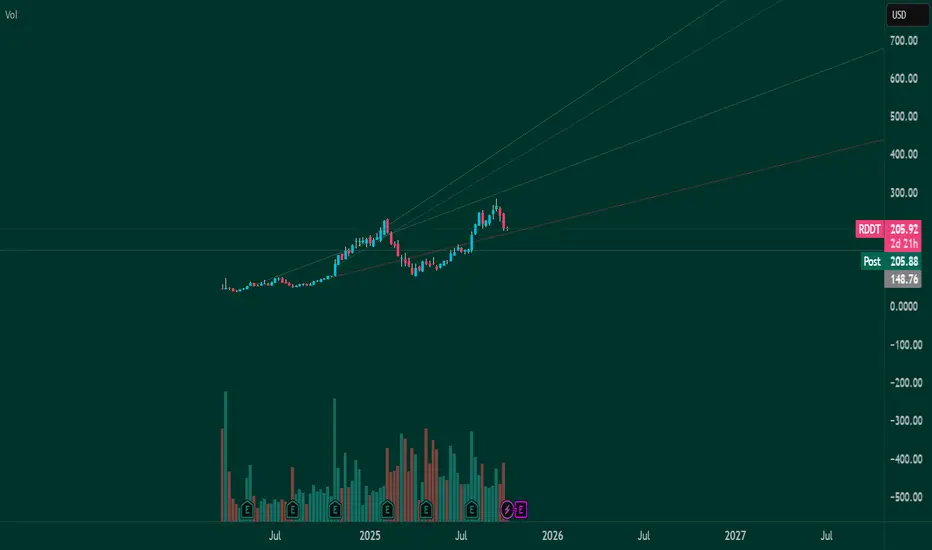
Market insights

$RDDT showing relative strength One of the strong stocks that has defined the market volatility over the past couple weeks. It has formed a nice handle which shows that institution do not want to get out of this stock and are waiting for new highs to add to their position. This looks like a key leader to me to watch as market figures out what it wants to do over the next month
Reddit (RDDT) – Daily AnalysisReddit (RDDT) – Daily Analysis
RDDT is respecting the bullish structure perfectly. Price bounced strongly from the demand zone (160–175) and is now pushing upward along the red bullish trendline.
The green bearish trendline was broken to the upside, and the retest held, confirming a shift back into bullish momentum.
Right now, price is heading directly toward the major resistance level at 286.98, which is the next key liquidity area where previous buyers/sellers interacted heavily.
Why upside momentum is favored:
Bullish trendline intact: Price is respecting both red ascending trendlines, showing strong structure support.
Break of green bearish line: Confirms bearish momentum is over and bulls are back in control.
Clean path to 287: No major resistance between current price (236) and 286.98.
Market structure forming higher lows: Classic continuation pattern.
Likely Scenario
As long as price remains above 220–225, RDDT is expected to continue this bullish leg toward the 286.98 target zone.
Invalidation
A daily close below 200 would signal trendline break and weaken the bullish outlook.
Summary
Reddit is showing strong bullish continuation after breaking the bearish trendline. The structure supports a likely push toward 287 in the upcoming sessions.
— Avo.Trades.

RDDT Covered callThis bad boy has a double bottom at the 100 sma and an unfilled gap. Looking forward to seeing it SLOWLY keep creeping higher!!! Trend is bull. Things look NICE

$RDDT Long Setup - $280 Target During Q1 2026Reddit is one of those gifts that keep on giving since the IPO. Right now, support seems strong and it doesn't seem to be going away, at least from some current indicators. As always, none of this is investment or financial advice. Please do your own due diligence and research.

$RDDT – Larger Head & Shoulders + Bear Flag = Trouble AheadReddit ( NYSE:RDDT ) is showing a bigger-picture head & shoulders pattern combined with a near-term bear flag, and the downside risk is real if the market continues to weaken — especially if NASDAQ:NVDA disappoints on earnings.
🔹 The Bigger Structure:
Head: The peak around $280
Right Shoulder: Forming around $230
This entire pattern is stretched over months — a structural topping pattern with heavy implications.
🔹 Near-Term Structure:
Between $180–$190, NYSE:RDDT is building a tight bear flag.
This is exactly the kind of setup that resolves to the downside when market sentiment turns.
🔹 Downside Levels:
First real support sits around $202, and that’s where sellers likely target first.
A breakdown of the flag could send it there quickly, especially in a risk-off tape.
🔹 Macro Risk:
If NASDAQ:NVDA misses earnings, this market is sitting on a cliff.
Momentum names and high-beta IPOs like NYSE:RDDT tend to get hit the hardest when liquidity dries up.
Combine macro weakness + a topping pattern + a bear flag… and you have a real setup for further downside.
🔹 My Trade View:
1️⃣ Bias: Bearish while under the 9 EMA.
2️⃣ Trigger: Breakdown under the bear flag ($180–$190 zone).
3️⃣ Target: $202 first, and potentially lower depending on market conditions.
4️⃣ Stop: Above the flag highs / 9 EMA.
Why This Matters:
You don’t often see a multi-month topping pattern line up cleanly with a short-term continuation short setup.
NYSE:RDDT has room to fall if the broader market unwinds.
This is one of the cleanest momentum breakdown candidates on the board.

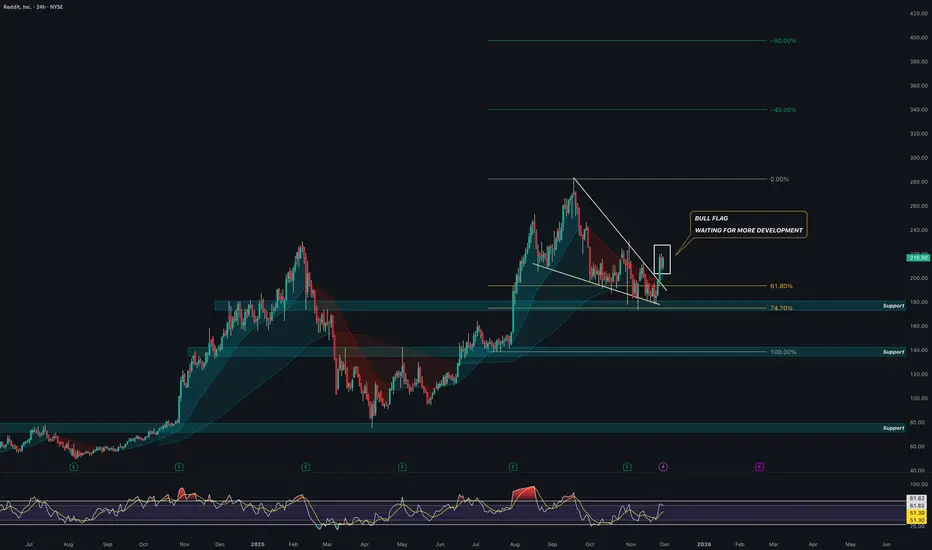
RDDT TO 400?RDDT IS LOOK PRETTY BULLISH.
NICE BREAK AND RETEST ON THE DAILY
And Now Its Looking To Form A BULL FLAG
Waiting for more Development/ Confirmation
So far, So good
FIRST TARGET = $320-$340
SECOND TARGET = $380-$400
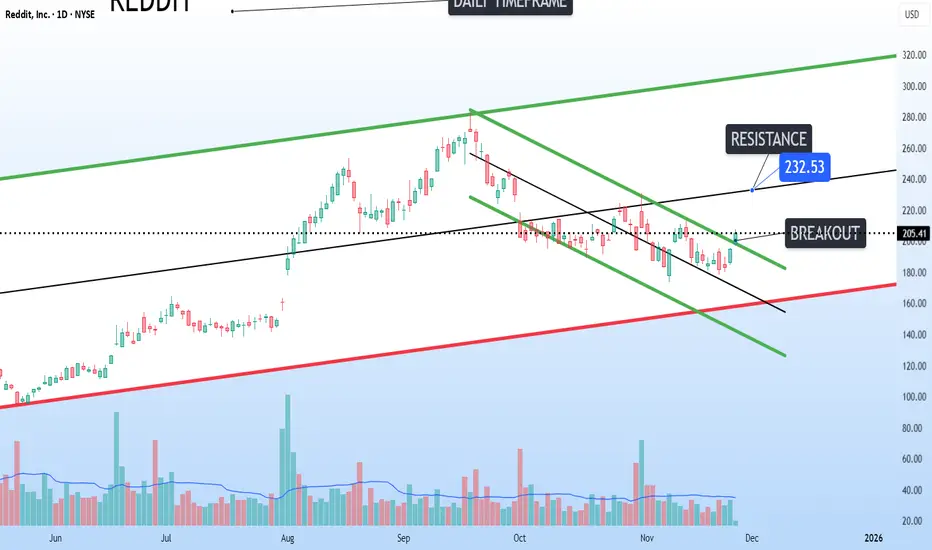
Breakout of local descending channelReddit NYSE:RDDT : The breakout from the local descending channel targets $232 before resistance, which is the mid-range of the ascending channel.
Phenonmenal company about to give a good entryReddit has completed its 5 waves up move since its IPO and is on a healty correction part to reach 145$
I expect it to bottom somewhere between 25th to 28th Nov after completeing the gap fill and restart its upward trajectory.
Short positions should wait for 210-215 levels to make money on the down move. I expect that a good short opportunity will come this week on 19th Nov (Wed) or on 20th Nov (Thu)

$RDDT - gap fill to the downsideRDDT - Stock moving lower post earnings breaking below $190 support level. Stock has 2 gaps to fill to the downside. puts below $185 looking good for a move towards $177.50 for a gap fill to $161 and $150. Stock is weak at the indicator level.
Small Cap QuantSignals AI Screener 2025-11-01Small Cap QuantSignals AI Screener 2025-11-01
💥 EXPLOSIVE SMALL CAP PLAYS DETECTED
AI Analysis of High-Leverage Options Opportunities
🎯 TOP 5 EXPLOSIVE SMALL CAP PLAYS
NYSE:SOC - Score: 95/100
• Explosive Setup: Extreme volatility (126% IV) with heavy distribution (-21.7% 5d) and accelerating volume pointing to capitulation.
• Options Play: $7.5 PUT exp 2025-11-21
• Catalyst: Continued sector weakness and potential breach of key $8 support level triggering algorithmic selling.
• Potential: Target stock move -35% and option return 800-1200%
• Risk: Extreme volatility could cause whipsaw. Position size 1% max.
NASDAQ:RIOT - Score: 81/100
• Explosive Setup: Crypto miner with massive float turnover (131%) and oversold bearish momentum at critical technical breakdown level.
• Options Play: $17.5 PUT exp 2025-11-21
• Catalyst: Bitcoin price volatility and miner operational updates creating binary outcomes.
• Potential: Target stock move -25% and option return 500-800%
• Risk: Bitcoin rebound could spark short squeeze. Position size 1.5% max.
NASDAQ:MSTX - Score: 79/100
• Explosive Setup: Failed rally setup (+11% 1d after -14% 5d) with extreme 129% IV and bearish gap fill rejection potential.
• Options Play: $12.5 PUT exp 2025-11-21
• Catalyst: Biotech catalyst disappointment and technical breakdown below $13 support.
• Potential: Target stock move -30% and option return 600-900%
• Risk: Unexpected positive news could trigger massive short squeeze. Position size 1% max.
NASDAQ:CLSK - Score: 73/100
• Explosive Setup: Clean energy/bitcoin play at inflection point with 102% IV and bullish bias despite recent weakness.
• Options Play: $20 CALL exp 2025-11-19
• Catalyst: Infrastructure bill developments and bitcoin momentum shift creating explosive upside potential.
• Potential: Target stock move +25% and option return 400-700%
• Risk: Dual exposure creates heightened sensitivity to both sectors. Position size 1.5% max.
NASDAQ:MARA - Score: 72/100
• Expl
Image
osive Setup: High-volume bitcoin miner at technical pivot with 90% IV and bullish momentum divergence.
• Options Play: $20 CALL exp 2025-11-19
• Catalyst: Mining efficiency updates combined with bitcoin volatility creating leveraged upside.
• Potential: Target stock move +20% and option return 300-600%
• Risk: Bitcoin correlation makes this highly dependent on crypto market moves. Position size 1.5% max.
⚠️ Risk Warning: These are ultra-high-risk plays. Position size 1-2% max per trade. Binary outcomes expected.

RDDT Reddit Options Ahead of EarningsAnalyzing the options chain and the chart patterns of RDDT Reddit prior to the earnings report this week,
I would consider purchasing the 210usd strike price Calls with
an expiration date of 2025-11-7,
for a premium of approximately $11.00.
If these options prove to be profitable prior to the earnings release, I would sell at least half of them.

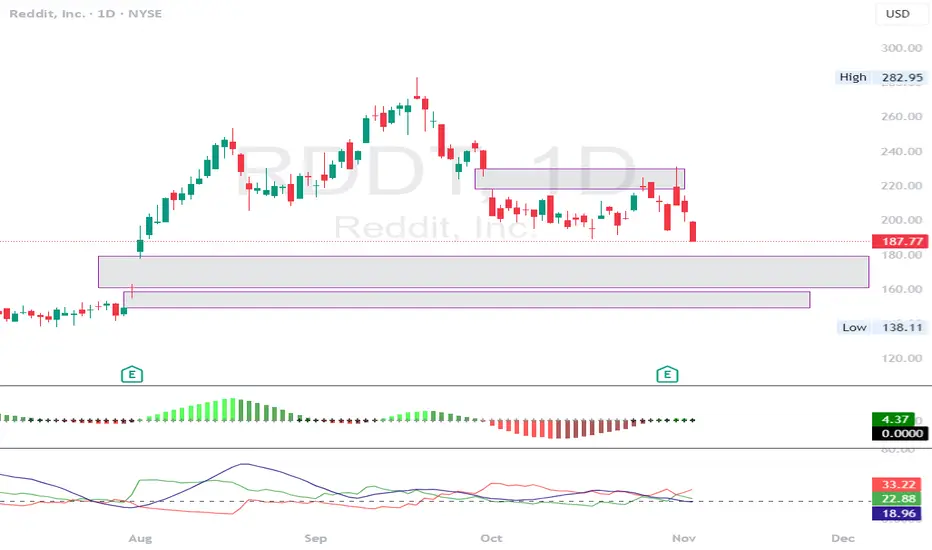
RDDT - Sliding off the top=======
Volume
=======
-Decreasing Volume
==========
Price Action
==========
- Latest uptrend broken with gap down
- Rounded top
- Change of trend observed
=========
Oscillators
=========
- Ichimoku, price inside cloud, green kumo thinning, base + conv + lagging shows sign of piercing clouds
- MACD bearish
- DMI bearish
- StochRSI, Bearish
=========
Conclusion
=========
- short to long term swing, price may reverse at current level, to enter spot or wait for pullback.

NYSE: RDDT Weekly – A Classic 0.618 Pullback in PlayRDDT has been trending higher since April, and its uptrend gained momentum after breaking above the 20-week SMA in mid-June.
The stock saw some pullback in mid-September, retesting the previous swing low around 205 (red dotted line), which also lines up with the rising trendline (green) and the 20-week SMA (purple) — right near the key Fibonacci 0.618 level.
This week, price bounced from that confluence zone and closed with a bullish candle, reclaiming the previous low. The move looks like a possible stop-hunt before the next leg higher, showing that buyers are defending this key support area.

$RDDT back to $280, at least?RDDT looks like the correction is finishing here.
I think we should see a move up from here either to the previous highs at ~$280, or we can potentially surpass the $280 level and hit the upper resistances.
Let's see how it plays out from here.

Potential Reddit Oppertunity $145*If* Reddit falls to $145 it would be a great opportunity to buy at support and ride it back up to $247. Unsure if it'll make it so I'm not opening a short.
Good luck!

Will it go down to 150?Looks bearish and could break down fast towards 150 by end of this November. I think next year this could hit 300. Happy Trading.
Not a financial advice.
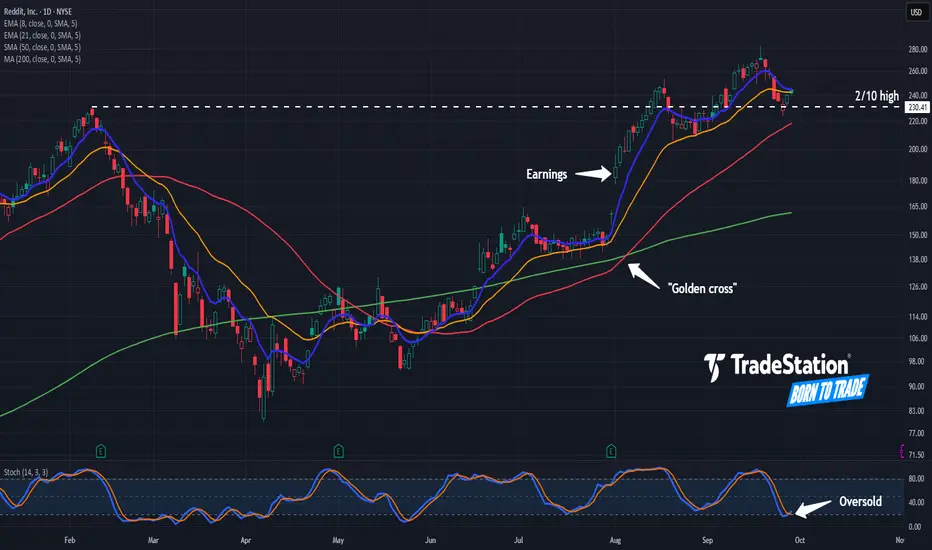
Reddit Pulls Back Following BreakoutReddit hit a new high earlier this month, and now it’s pulled back.
The first pattern on today’s chart is the gap on August 1 after earnings and revenue beat estimates. That may reflect positive fundamentals.
Second is the February 10 high of $230.41. The social-media stock tested and held that level last week. Has old resistance become new support?
Third, the 8-day exponential moving average (EMA) is above the 21-day EMA. That could reflect a bullish short-term trend.
Next, the 50-day simple moving average (SMA) had a “golden cross” above the 200-day SMA in early August. That may reflect a bullish long-term trend.
Additionally, stochastics are turning up from an oversold condition.
Finally, RDDT is an active underlier in the options market. That could let some traders position for moves with calls and puts.
TradeStation has, for decades, advanced the trading industry, providing access to stocks, options and futures. If you're born to trade, we could be for you. See our Overview for more.
Past performance, whether actual or indicated by historical tests of strategies, is no guarantee of future performance or success. There is a possibility that you may sustain a loss equal to or greater than your entire investment regardless of which asset class you trade (equities, options or futures); therefore, you should not invest or risk money that you cannot afford to lose. Online trading is not suitable for all investors. View the document titled Characteristics and Risks of Standardized Options at www.TradeStation.com . Before trading any asset class, customers must read the relevant risk disclosure statements on www.TradeStation.com . System access and trade placement and execution may be delayed or fail due to market volatility and volume, quote delays, system and software errors, Internet traffic, outages and other factors.
Securities and futures trading is offered to self-directed customers by TradeStation Securities, Inc., a broker-dealer registered with the Securities and Exchange Commission and a futures commission merchant licensed with the Commodity Futures Trading Commission). TradeStation Securities is a member of the Financial Industry Regulatory Authority, the National Futures Association, and a number of exchanges.
Options trading is not suitable for all investors. Your TradeStation Securities’ account application to trade options will be considered and approved or disapproved based on all relevant factors, including your trading experience. See www.TradeStation.com . Visit www.TradeStation.com for full details on the costs and fees associated with options.
Margin trading involves risks, and it is important that you fully understand those risks before trading on margin. The Margin Disclosure Statement outlines many of those risks, including that you can lose more funds than you deposit in your margin account; your brokerage firm can force the sale of securities in your account; your brokerage firm can sell your securities without contacting you; and you are not entitled to an extension of time on a margin call. Review the Margin Disclosure Statement at www.TradeStation.com .
TradeStation Securities, Inc. and TradeStation Technologies, Inc. are each wholly owned subsidiaries of TradeStation Group, Inc., both operating, and providing products and services, under the TradeStation brand and trademark. When applying for, or purchasing, accounts, subscriptions, products and services, it is important that you know which company you will be dealing with. Visit www.TradeStation.com for further important information explaining what this means.
Reddit (RDDT) – Bullish Outlook Backed by Monetization StrengthReddit NYSE:RDDT stands out in the social media space with its community-first model and focus on authentic, user-driven engagement. As digital ad spend accelerates globally, Reddit is positioning itself at the intersection of social networking and data-driven monetization.
🔍 Key Drivers:
💡 AI-Powered Ads: Reddit’s ad platform uses AI to optimize placements, improving ROI for advertisers and strengthening pricing power.
💰 ARPU Beats Expectations: Global ARPU hit $4.53, highlighting strong monetization efficiency and reducing reliance on user growth.
📊 Scalability & Leverage: The AI engine supports operating leverage, setting the stage for robust earnings growth over time.
🚀 Price Momentum: Shares are up over 50% YTD, reflecting investor confidence and post-IPO execution strength.
📌 Technical Setup:
We remain bullish above the $205.00–$207.00 breakout zone. Sustained strength above this range could open the path toward a target zone of $380.00–$390.00.
#RDDT #Reddit #Stocks #StockMarket #TechStocks #AI #SocialMedia #DigitalAdvertising #GrowthStocks #Investing #Bullish #Breakout #EarningsGrowth #ARPU #IPO #AIstocks

$RDDT: betting for a pullback to $220 before Oct 17thbought 220p exp 10.17
Audience Size and Engagement
Reddit attracts around 2 billion monthly visitors and boasts a highly engaged user base concentrated in thousands of topic-specific communities known as subreddits. It achieved 47 percent year-over-year user growth in 2025, signaling its rising prominence among niche audiences.
Advertising Performance and Monetization
Advertising revenue on Reddit surged to $465 million in Q2 2025, an 84 percent increase year over year, driven by enhanced ad-tech targeting and search capabilities. Reddit delivered its first profitable year, and its ad offerings now feature on 18 top performance lists, demonstrating strong ROI for sectors like gaming and fintech.
Community-Driven Differentiators
Unlike algorithm-first platforms, Reddit centers on authentic, interest-based engagement. Users join subreddits aligned with their passions, contributing and upvoting valuable content that fuels organic reach. This model fosters deep discussions and positions Reddit as a cultural insights engine for marketers.

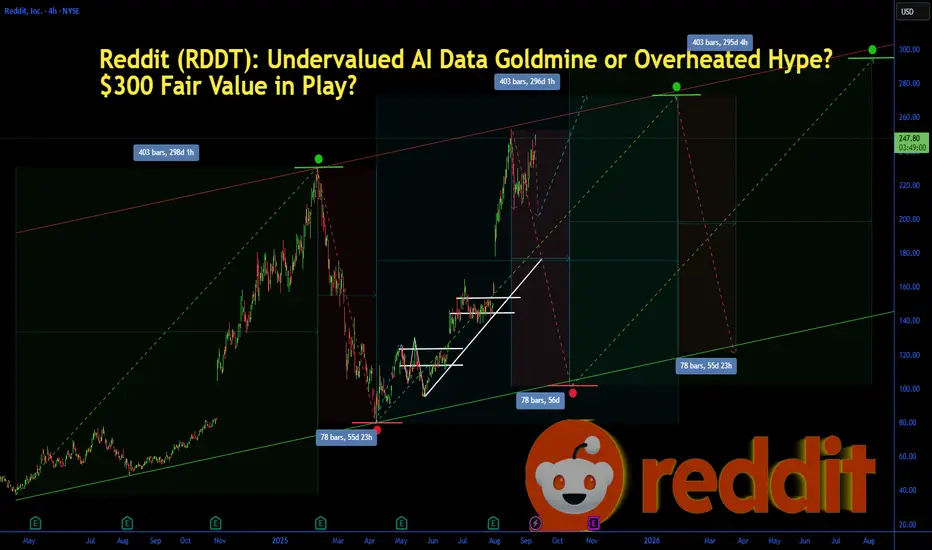
Reddit (RDDT): Undervalued AI Data Goldmine or Overheated Hype?Reddit (RDDT): Undervalued AI Data Goldmine or Overheated Hype? $300 Fair Value in Play?
Reddit (RDDT) shares surged 4.44% to close at $240.20 yesterday, with pre-market trading pushing it to $243.70 today amid optimism over its AI data licensing deals and a 78% YoY revenue jump in recent earnings. Year-to-date, the stock is up 46.97%, but analysts are split—some see it undervalued by 26% with a fair value of $302 based on free cash flow projections, while others flag overvaluation at current levels. With a lawsuit over alleged privacy issues making headlines and Q3 earnings looming on October 28, is RDDT the undervalued growth play in social media's AI era, or just riding short-term momentum? Let's break down the fundamentals, SWOT, technicals, and scenarios for September 10, 2025.
Fundamental Analysis
Reddit's core strength lies in its massive user-generated content, positioning it as a key AI training data source with deals like OpenAI's integration boosting revenue. Recent Q2 results showed $499.6 million in sales, up 78% YoY, surpassing estimates, driven by ad growth and user expansion to over 100 million daily actives.
Analysts expect EPS of $2.23 TTM, with forward P/E at 84.03, reflecting high growth premiums. However, a high PE of 107.71 and enterprise value/EBITDA of 291.25 suggest stretched valuations, compounded by a lawsuit alleging privacy violations.
- **Positive:**
- Surging revenue and user growth underscore AI data monetization potential; profit margin at 12.97% with $2.06B cash on hand.
- Institutional interest rising, with market cap at $44.96B and levered free cash flow of $290.61M signaling operational strength.
- **Negative:**
- High debt/equity at 1.05% and ongoing lawsuit risks could erode investor confidence if macro slowdowns hit ad spending.
- Sticky inflation and Fed rate uncertainty may pressure growth stocks like RDDT if AI hype cools.
SWOT Analysis
Strengths: Dominant in user-generated content for AI datasets; strong revenue growth (78% YoY) and cash reserves ($2.06B); loyal community driving organic traffic.
Weaknesses: Elevated valuations (PE 107.71) amid profitability challenges; history of operational issues like site outages; dependency on ad revenue vulnerable to economic dips.
Opportunities: Expanding AI partnerships (e.g., data licensing deals); global user base growth in emerging markets; potential for new features like premium subscriptions amid digital ad boom.
Threats: Intensifying competition from TikTok and Meta; regulatory scrutiny on data privacy (e.g., ongoing lawsuit); market volatility if Fed delays rate cuts.
Technical Analysis
On the daily chart, RDDT is in a rising trend channel after breaking out from $223 support, with volume spiking on earnings momentum but now consolidating near all-time highs.
This follows a 52-week range from $55.84 to $253.14, with the stock up over 300% from April lows. Current price: ~$243 (pre-market), pivoting around $240.
Key indicators:
RSI: At 68.60, bullish but nearing overbought—watch for pullback if it hits 70.
MACD: At 12.35 with positive histogram, signaling sustained upside momentum.
Moving Averages: Price above 21-day EMA (~$230) and 50-day SMA (~$220)—golden cross intact for bull bias.
Support/Resistance: Support at $223 (recent low), resistance at $253 (all-time high).
Patterns/Momentum: Rising channel targets $260 on breakout; higher highs confirm trend. 🟢 Bullish signals: Strong buy per technical summaries. 🔴 Bearish risks: Overbought RSI could trigger correction.
Scenarios and Risk Management
Bullish Scenario: Break above $253 on positive lawsuit resolution or AI deal news targets $260–$302; buy on pullbacks to $230 support.
Bearish Scenario: Drop below $223 eyes $220 (50-day SMA); watch for death cross if macro data disappoints.
Neutral/Goldilocks: Range-bound $223–$253 if earnings guidance is mixed.
Risk Tips: Use stops at $220 (2% below support). Risk 1-2% per trade. Diversify to avoid tech sector correlations—pair with stable assets like bonds.
Conclusion/Outlook
Overall, bullish bias if RDDT holds $240 and leverages AI tailwinds, affirming its undervalued potential with 25%+ upside to $302 fair value. But watch October earnings and privacy lawsuit for confirmation—this fits September's growth stock rotation amid Fed cut optimism.
What’s your take? Bullish on RDDT's AI edge or bearish on valuations? Share in the comments!
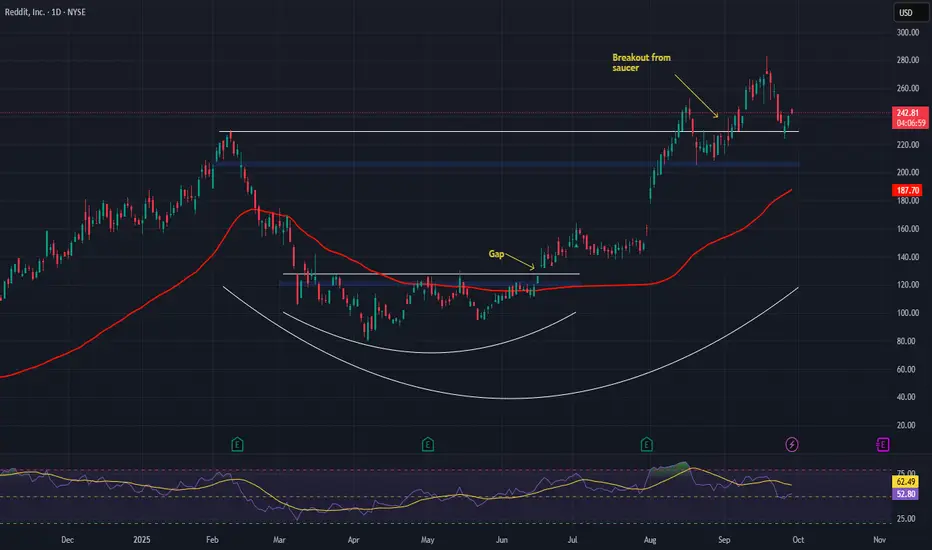
Cup and handle bullish pattern Cup and handle bullish pattern on the daily and weekly chart.
Options: over 1800 $240 and $250 calls for October 17 expiry.
