HDFCBANK - RISING WEDGE PATTERN BREAKOUT [ SELL SIDE ]I am not a SEBI-registered investment advisor. The information provided here is for educational and informational purposes only and should not be construed as financial or investment advice. Please do your own research or consult with a SEBI-registered financial advisor before making any investment
Next report date
—
Report period
—
EPS estimate
—
Revenue estimate
—
1.65 USD
8.37 B USD
56.14 B USD
5.12 B
About HDFC Bank Limited
Sector
Industry
CEO
Kapila Deshapriya
Website
Headquarters
Mumbai
Founded
1994
ISIN
US40415F1012
FIGI
BBG000NWKS18
HDFC Bank Ltd. engages in the provision of banking and financial services including commercial banking and treasury operations. It operates through the following segments: Treasury, Retail Banking, Wholesale Banking, and Other Banking Business. The Treasury segment is involved in net interest earnings from the investment portfolio, money market borrowing, and lending, gains, or losses on investment operations and on account of trading in foreign exchange and derivative contracts. The Retail Banking segment focuses on serving retail customers through the branch network and other channels. The Wholesale Banking segment provides loans, non-fund facilities, and transaction services to large corporates, emerging corporates, public sector units, government bodies, financial institutions, and medium scale enterprises. The Other Banking Business segment includes income from parabanking activities such as credit cards, debit cards, third party product distribution, primary dealership business, and the associated costs. The company was founded by Aditya Tapishwar Puri in August 1994 and is headquartered in Mumbai, India.
Related stocks

BANKNIFTY WEIGHTAGE STOCKS INDEX..Support and Resistance Levels: In technical analysis, support and resistance levels are significant price levels where buying or selling interest tends to be strong. They are identified based on previous price levels where the price has shown a tendency to reverse or find support.

NIFTY WEIGHTAGE STOCKS INDEX..Support and Resistance Levels: In technical analysis, support and resistance levels are significant price levels where buying or selling interest tends to be strong. They are identified based on previous price levels where the price has shown a tendency to reverse or find support.

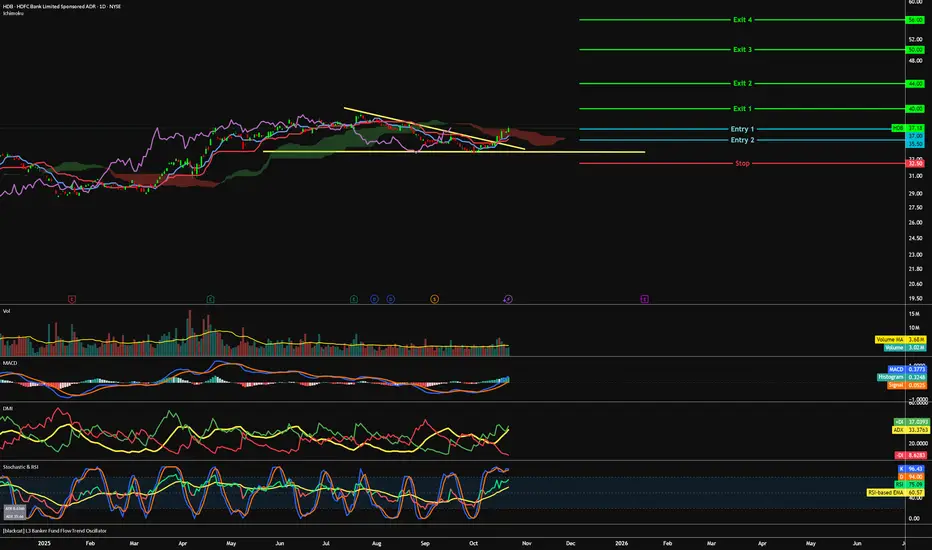
HDB - Banking on uptrend continuation=======
Volume
=======
- slight increase
==========
Price Action
==========
- Broken out of latest downtrend
- Supported at $34
=================
Technical Indicators
=================
- Ichimoku
>>> price above cloud
>>> Green Kumo Budding
>>> Tenken - Within clouds & piercing up
>>> Kijun
HDFC Bank: Major Red Band Resistance LevelHDFC Bank: Major Red Band Resistance Level.
( Not a Buy / Sell Recommendation
Do your own due diligence ,Market is subject to risks, This is my own view and for learning only .)

HDFC Bank Ltd for 6th Oct #HDFCBANK HDFC Bank Ltd for 6th Oct #HDFCBANK
Resistance 970 Watching above 971 for upside momentum.
Support area 960 Below 960 gnoring upside momentum for intraday
Watching below 957 for downside movement...
Above 970 ignoring downside move for intraday
Charts for Educational purposes only.
Please follow

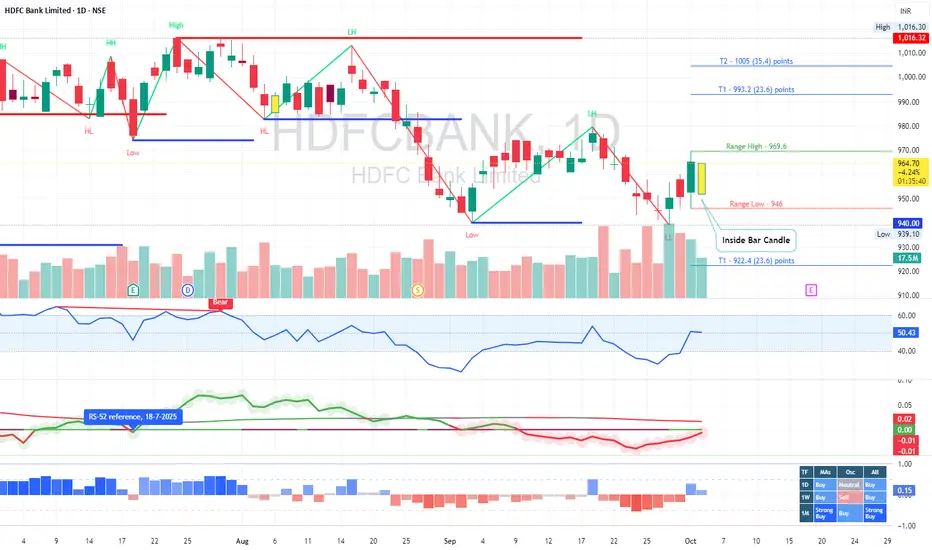
HDFC BankHDFC Bank forming Inside Bar Candle
Means BNF will bullish if Resistance has been crossed
this is before closed market level after we need to check level
Resistance 965
support 952
Expected level 979 / 983 / 993 / 1005

HDFCBANK, 1D, Support, LongHDFCBANK has taken a good support at this level. If it closes above 360 then it may go upto 370 and 390.
Entry : 960
Target1: 970
Target2: 990

New High is Coming In HDFCbank ??Hdfcbank taken support and pushing upside. Seem like new high is coming in few days

See all ideas
Summarizing what the indicators are suggesting.
Neutral
SellBuy
Strong sellStrong buy
Strong sellSellNeutralBuyStrong buy
Neutral
SellBuy
Strong sellStrong buy
Strong sellSellNeutralBuyStrong buy
Neutral
SellBuy
Strong sellStrong buy
Strong sellSellNeutralBuyStrong buy
An aggregate view of professional's ratings.
Neutral
SellBuy
Strong sellStrong buy
Strong sellSellNeutralBuyStrong buy
Neutral
SellBuy
Strong sellStrong buy
Strong sellSellNeutralBuyStrong buy
Neutral
SellBuy
Strong sellStrong buy
Strong sellSellNeutralBuyStrong buy
Displays a symbol's price movements over previous years to identify recurring trends.
78HDFCB33
HDFC Bank Limited 7.8% 03-MAY-2033Yield to maturity
7.78%
Maturity date
May 3, 2033
784HDFCB27
HDFC Bank Limited 7.84% PERPYield to maturity
7.22%
Maturity date
—
775HDFCB33
HDFC Bank Limited 7.75% 13-JUN-2033Yield to maturity
6.94%
Maturity date
Jun 13, 2033
705HDFCB31
HDFC Bank Limited 7.05% 01-DEC-2031Yield to maturity
6.86%
Maturity date
Dec 1, 2031
797HDFCB33
HDFC Bank Limited 7.97% 17-FEB-2033Yield to maturity
6.79%
Maturity date
Feb 17, 2033
HDB5548686
HDFC Bank Limited 5.686% 02-MAR-2026Yield to maturity
4.39%
Maturity date
Mar 2, 2026
771HDFCB33
HDFC Bank Limited 7.71% 20-DEC-2033Yield to maturity
—
Maturity date
Dec 20, 2033
786HDFC32
HDFC Bank Limited 7.86% 02-DEC-2032Yield to maturity
—
Maturity date
Dec 2, 2032
77HDFCB28
HDFC Bank Limited 7.7% 16-MAY-2028Yield to maturity
—
Maturity date
May 16, 2028
765HDFCB33
HDFC Bank Limited 7.65% 25-MAY-2033Yield to maturity
—
Maturity date
May 25, 2033
HDFB5243078
HDFC Bank Limited 3.7% PERPYield to maturity
—
Maturity date
—
See all HDB bonds
Curated watchlists where HDB is featured.

Indian stocks: Racing ahead
46 No. of Symbols
See all sparks