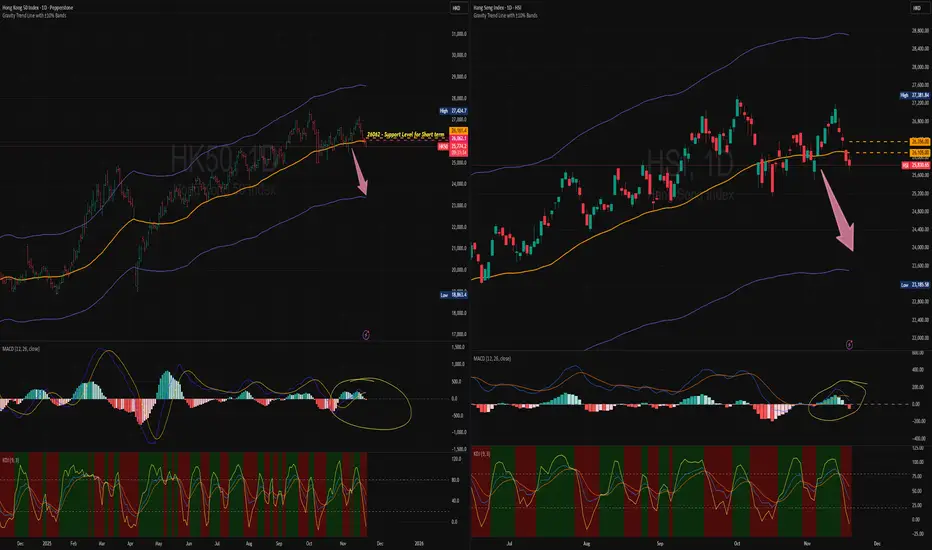
HK50 | Breakout Re-Test in Focus — Will Bulls Defend the Trend? HONG KONG 50 (HK50) | Swing Trade Setup 🚀📈
🎯 BULLISH BREAKOUT CONFIRMED | Multi-Timeframe Confluence ✅
📊 TECHNICAL SETUP
✅ Weighted Moving Average (WMA) pullback completed
✅ LSMA Breakout confirmed on higher timeframes
✅ Bullish momentum building across all indicators
✅ Price action respecting key

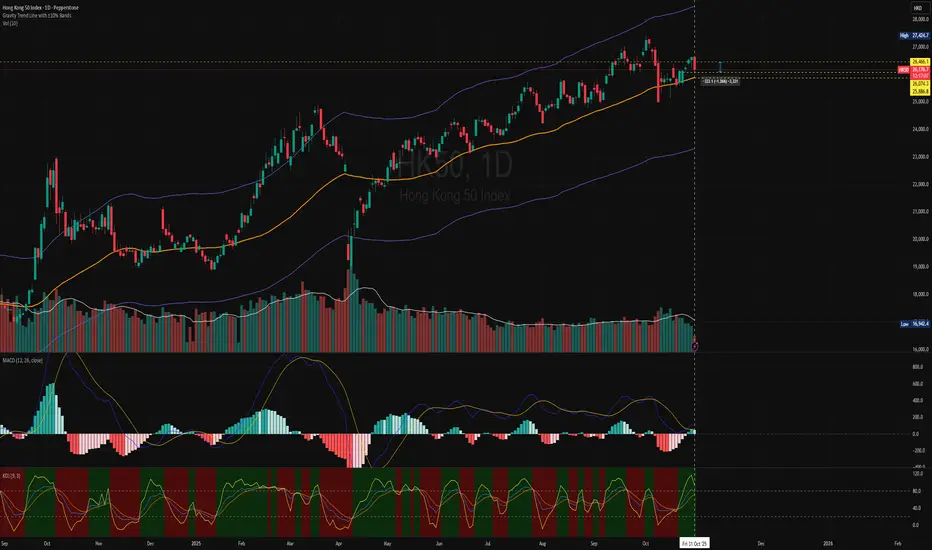
HK50 Long Setup at 25,875Crab pattern completes on M30 and H1, marking a potential reversal zone near current price.
Triple bottom visible on M30 and H1, reinforcing a well defined support shelf.
RSI is rising as the triple bottom forms, which supports the idea of accumulation rather than a weak bounce.
Daily trend remai

seems like Bear winds is blowing19Nov2025
Hello everyone!
HSI has been consecutively down for 4 days streaks.
For this week the HSI:-
🗝️🗝️ Important Support level : 26100 (which already broken down)
🗝️ Key Resistance level : 25850-25890
🗝️ Key Support level l : 25743 -25670
4h Chart:-
The cycle is repeating....history may n
Price reverse from early loss but seems waiting for macro news? Hello everyone....
Price reverse from early loss but seems waiting for macro news? Should you wait for the news too?
For today,
🗝️ Resistance level : 26700, 26760
🗝️ Key support level : 26500 (this has been tested a few times during the noon session)
Remember to check with the underlying HKEX:H

Pullback for Friday. what do you think?
Hello everyone....
MACD formed deadcross for 1h chart.
What's your trade plan?
For today and is Friday.
Resistance level : 26350
Key support level : 26130 if it break below this level then likely to continue to pull back to fill the gap and back to GravityTrendLine for 4h - 26100 (this level app

Chinese stocks could hedge US tech crash Chinese stocks broke their loose correlation to US equities in 2021.
US tech stocks may or may not be in a bubble, but if they are Chinese stocks could be attractive.
The 2008 crash in the US was viewed as a major relative leap for China, because their citizens are generally savers (setting aside


Stay calm, stay alert! Revisit the macro prior to your trade. Hello everyone! tomorrow is the last day before the Q4 commences, let's see what's happening to HSI today. Wonder if you noticed, after lunch, it's quite amazed that how markets react to news - the meeting between the key leaders at Busan today. 😮😮😮
Well, I guess this is just another trick for the
(UPDATE) Hong Kong rally is evident to 26,944Hong Kong is shaping up nicely for upside.
We did this analysis in June and now it has broken above the breakout point and is showing signs of a rally.
🧧 1. Mainland Money Flood
Chinese investors are pouring cash into Hong Kong stocks, hitting record levels.
🚀 2. Big IPOs
Huge listings like

See all ideas
Summarizing what the indicators are suggesting.
Oscillators
Neutral
SellBuy
Strong sellStrong buy
Strong sellSellNeutralBuyStrong buy
Oscillators
Neutral
SellBuy
Strong sellStrong buy
Strong sellSellNeutralBuyStrong buy
Summary
Neutral
SellBuy
Strong sellStrong buy
Strong sellSellNeutralBuyStrong buy
Summary
Neutral
SellBuy
Strong sellStrong buy
Strong sellSellNeutralBuyStrong buy
Summary
Neutral
SellBuy
Strong sellStrong buy
Strong sellSellNeutralBuyStrong buy
Moving Averages
Neutral
SellBuy
Strong sellStrong buy
Strong sellSellNeutralBuyStrong buy
Moving Averages
Neutral
SellBuy
Strong sellStrong buy
Strong sellSellNeutralBuyStrong buy
Displays a symbol's price movements over previous years to identify recurring trends.
Frequently Asked Questions
The current value of Hong Kong 33 is 25,814.3 HKD — it has fallen by −0.67% in the past 24 hours. Track the index more closely on the Hong Kong 33 chart.
Hong Kong 33 reached its highest quote on Jan 29, 2018 — 33,495.3 HKD. See more data on the Hong Kong 33 chart.
The lowest ever quote of Hong Kong 33 is 8,328.3 HKD. It was reached on Apr 25, 2003. See more data on the Hong Kong 33 chart.
Hong Kong 33 value has decreased by −3.62% in the past week, since last month it has shown a −0.17% decrease, and over the year it's increased by 31.79%. Keep track of all changes on the Hong Kong 33 chart.
Hong Kong 33 is just a number that lets you track performance of the instruments comprising the index, so you can't invest in it directly. But you can buy Hong Kong 33 futures or funds or invest in its components.