Peak Tech Earnings Wrapped Up: Here Are the Winners and LosersWe're past that time when we all get glued to the dual-monitor setup and watch the titans of tech parade their financials.
Last week was the Super Bowl of earnings season, with Meta NASDAQ:META , Microsoft NASDAQ:MSFT , Alphabet NASDAQ:GOOGL , Apple NASDAQ:AAPL , and Amazon NASDAQ:AMZN all re

Backtesting 101: How to Turn an Idea Into a Tested StrategyEvery trader has thought it:
“If I’d just followed that setup every time, I’d be up big.”
That’s where backtesting steps in, it separates luck from logic.
It’s how you find out whether your strategy has a real edge, or just worked in hindsight.
Most traders skip it, not because it’s useless, but bec

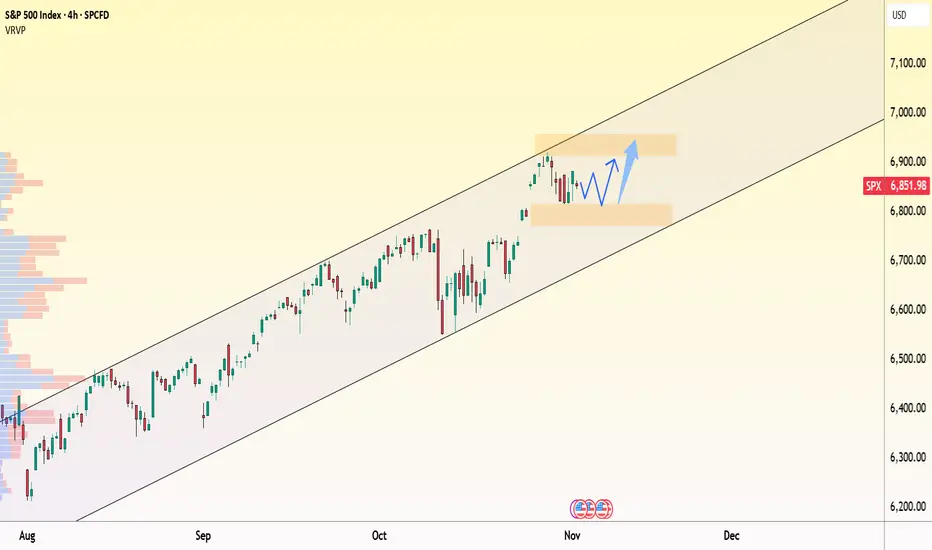
SPX:uptrend remains intact – consolidating for the next breakoutOn the 4-hour chart, the S&P 500 (SPX) continues to move firmly within its ascending channel , with the current range around 6,850–6,900 representing a healthy pause after a strong rally. The nearest support sits at 6,800, where buyers previously stepped in, while short-term resistance remains near
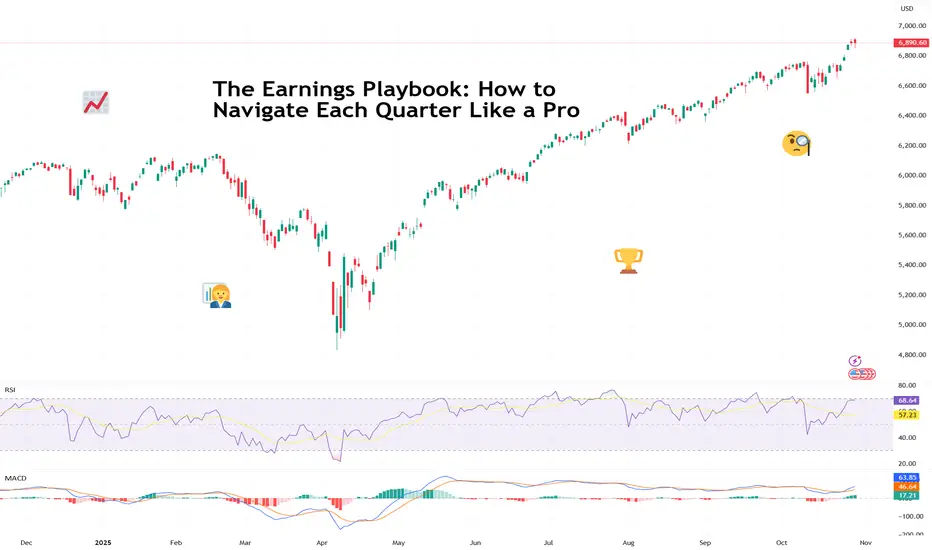
The Earnings Playbook: How to Navigate Each Quarter Like a ProTraders are in the heat of the earnings season and euphoria is sweeping every corner of the market.
The charts twitch, traders stop talking about the Fed for five minutes ( not this week, though ), and online forums turn into a parade of watch-me-trade sessions.
It’s that glorious stretch when c
S&P500 Possibly the last buy signal before Bull Cycle ends.The S&P500 index (SPX) has been trading within a 5-month Channel Up and is currently about to complete its latest Bearish Leg. All such pull-back sequences have reached at least the 4H MA200 (orange trend-line) before rebounding and kick-starting the next Bullish Leg, with the 1D MA50 (red trend-lin

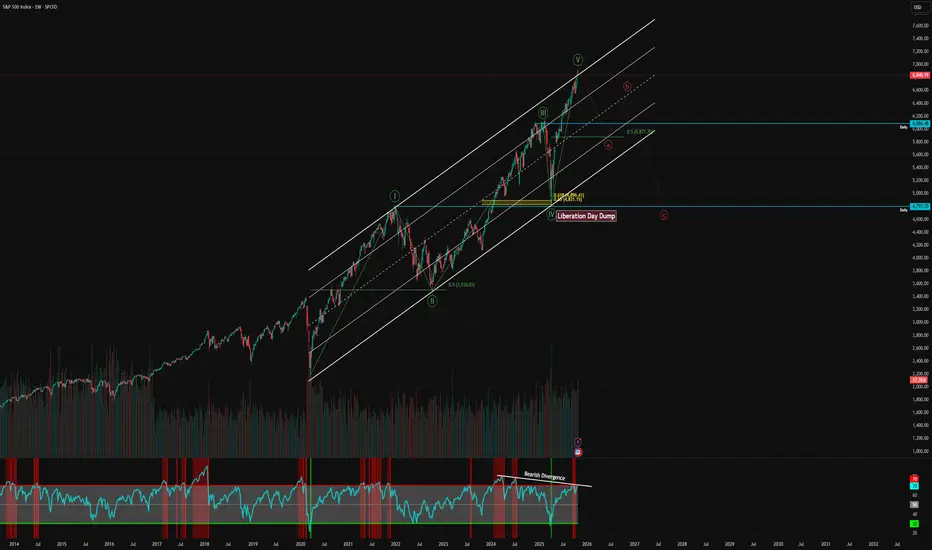
Topping Signal?To me this looks like Wave 5 of the Elliott Wave supercycle in the stock market. We had a monster rally since the liberation day dump, now we are coming up against some strong resistance.
Should we be concerned? So far I have taken a lot of chips of the table. I am still very much long, we don't f
SPY/SPX Bear Market, liquidity speedbumps, and key levels SP:SPX AMEX:SPY
The current setup mirrors the prior rally from trough to peak, projecting a speculative 20% bear market range.
From here, I’m watching for a push into 6100–6200 that’s where strong resistance should form. If we reject that zone, it likely marks the start of a deeper unwind.
A
Agenda 89 --- the path to spy's next major topso I been rambling about agenda 89 and spy cycles for like ages. I also more or less blew my account up not listening to my own advice and my own levels. key thing here is market follows cycles. and no I am not willing to share the prior cycles. this here is for me more than anyone else.
I am not

S&P 500 at Critical Support – Last Line of Defense?Since the S&P 500 index( SP:SPX ) is one of the key indicators in the financial markets, and it’s been highly correlated with parallel markets recently, it's always a good idea to keep an eye on its analysis.
Now, for example, Bitcoin ( BINANCE:BTCUSDT ) started to decline as the S&P 500 index dr

Hellena | SPX500 (4H): LONG to resistance area of 7000.Colleagues, I believe that the upward movement is not over yet and at the moment the formation of wave “3” is taking place, but the chart shows a gap that should be closed.
Therefore, I believe that the price can go into correction of the small wave “4” to the area of 6823, but the priority is stil

See all ideas
Displays a symbol's price movements over previous years to identify recurring trends.
Frequently Asked Questions
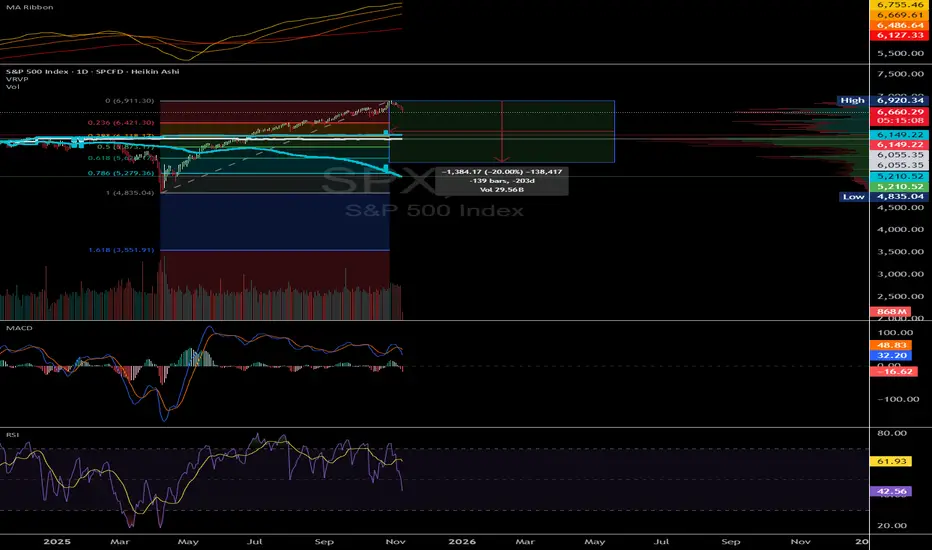
S&P 500 Index reached its highest quote on Oct 30, 2025 — 6,929.4 USD. See more data on the S&P 500 Index chart.
The lowest ever quote of S&P 500 Index is 666.3 USD. It was reached on Mar 6, 2009. See more data on the S&P 500 Index chart.
S&P 500 Index is just a number that lets you track performance of the instruments comprising the index, so you can't invest in it directly. But you can buy S&P 500 Index futures or funds or invest in its components.