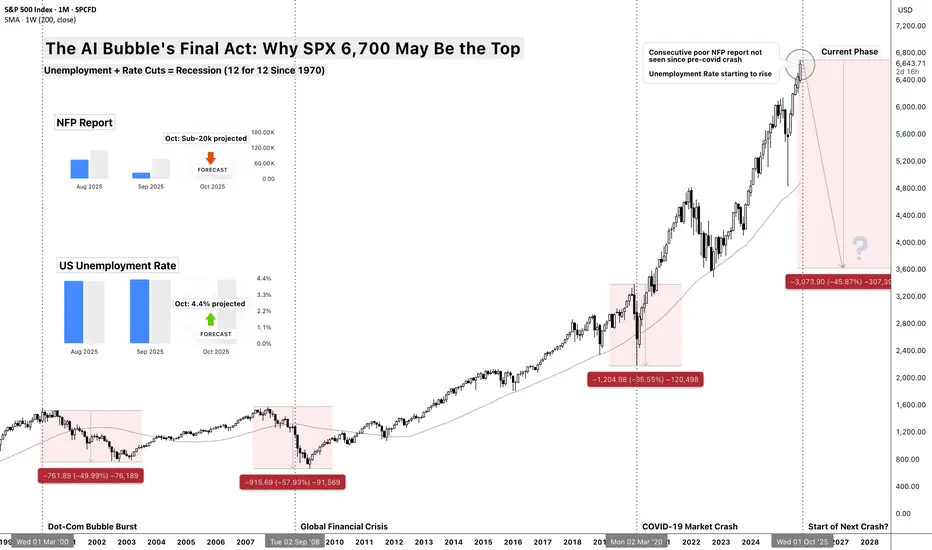
The AI Bubble's Final Act: Why $SP:SPX 6,700 May Be the TopThe AI Bubble's Final Act: Why SP:SPX 6,700 May Be the Top
Unemployment + Rate Cuts = Recession (12 for 12 Since 1970)
The Death Cross Pattern
There's a simple rule that's worked for 55 years: When the Fed cuts rates while unemployment is rising from cycle lows, recession follows within 12 m
The AI Bubble's Final Act II: The Convergence TightensRetail flushed. Institutions trapped. The Fed flying blind. Welcome to October.
The AI Bubble's Final Act II: The Convergence Tightens
Why the AI Bubble Narrative Just Got Its Lehman Moment
This post is a direct sequel to my September thesis: If you haven’t read that, start there⬇️ - this bu

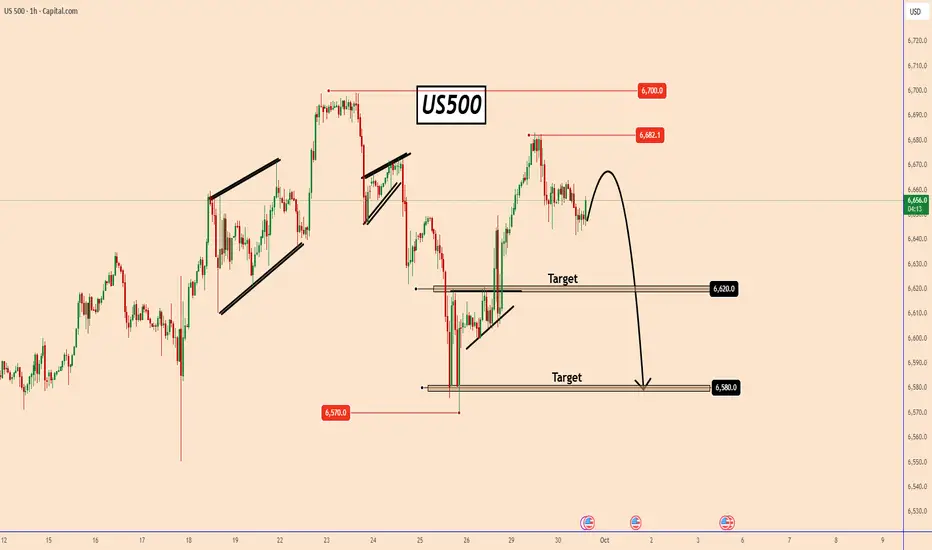
US500 at Record Highs: Caution Ahead of Options ExpirationUS500 at Record Highs: Caution Ahead of Options Expiration
The US500 recently reached a new all-time high near 6700 but quickly retraced back to 6570. The index managed to recover most of those losses, climbing again toward 6680.
In my view, however, we could be approaching the start of a downtre
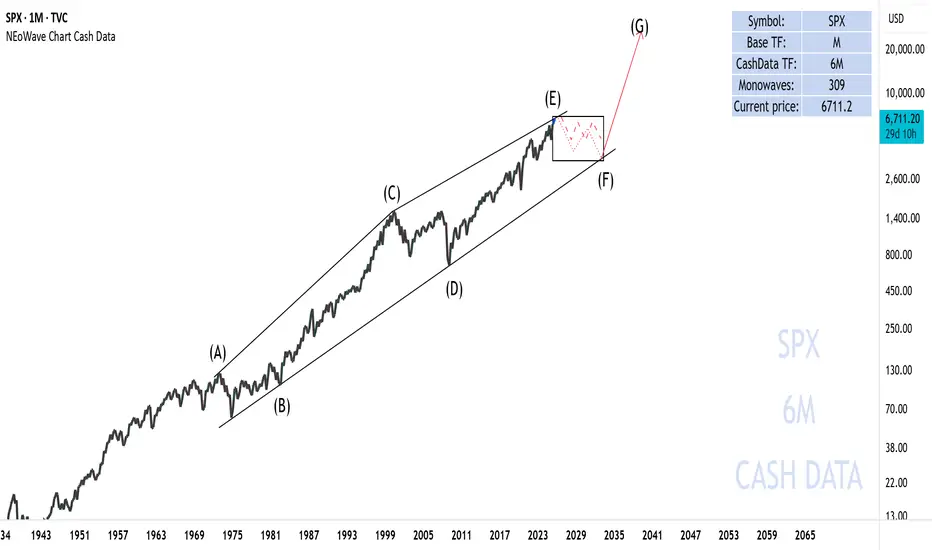
The corrective phase of the S&P
In my view, the S&P 500 index is forming a diametric pattern in the long-term timeframe, with wave (E) currently nearing completion. Following this, the index is expected to enter a corrective phase, which could involve both price and time corrections:
- The price correction may extend to the rang
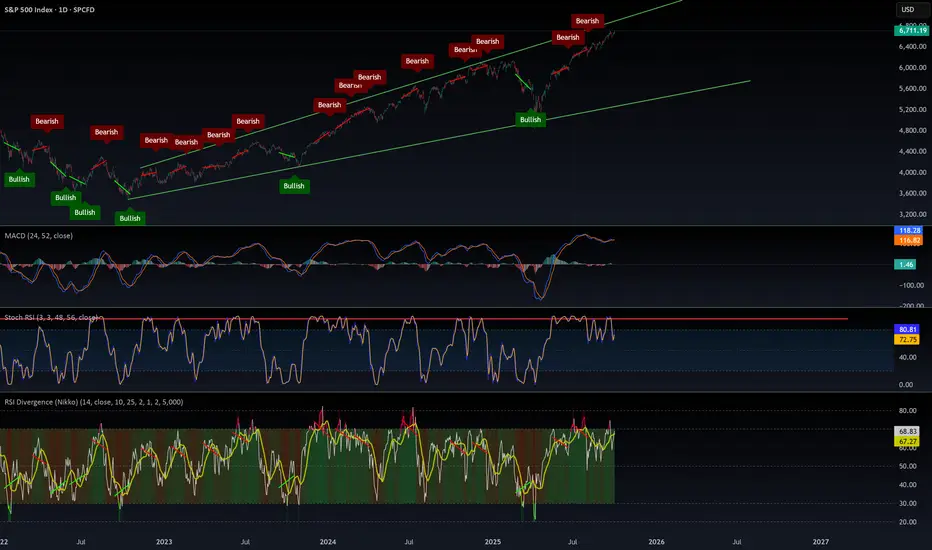
S&P500 - $8.000 is the ultimate target!🎊S&P500 ( TVC:SPX ) continues the bullrun:
🔎Analysis summary:
Over the course of the past couple of months, the S&P500 has been rallying +40%. However, this does not mean that the bullrun is over any time soon. Since the S&P500 perfectly respects the rising channel pattern, a move to the uppe

The Evolution of the Market
I was always curious of what the market was like pre algorithms and computerized trading from market makers, and this is what prompted this research / article. Through the pursuit of this quesiton, I discovered some really surprising things. Mostly, the impact of the retail influx is actually quite

$SPX500 by all metrix this is overboughtMarkets can stay irrational longer than we can stay solvent. Right now, we’re at the top of this megaphone pattern, with everything extremely overbought in epic fashion.
⚠️ Caution: the odds of a serious correction are high — the chart points to a potential target around $5,650.
Sure, the madness
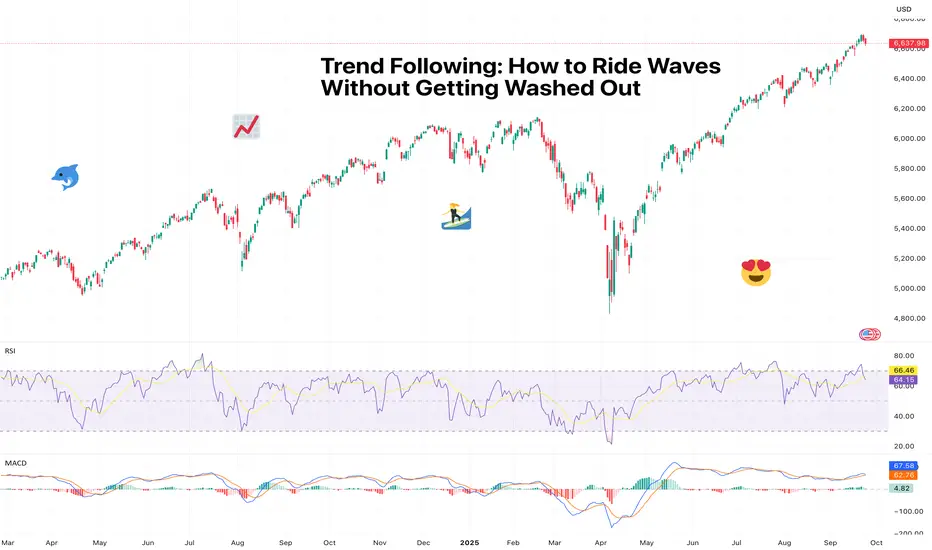
Trend Following: How to Ride Waves Without Getting Washed OutMarkets move in waves. Easy, right? But if you’ve tried catching one only to find out you get washed out, you’ve realized it ain’t’ that easy.
Sometimes there are gentle ripples that lull traders into boredom, other times they’re tsunamis that wipe out everything in sight.
The trick isn’t predict
S&P500 H1 | Bullish Momentum Extending FurtherBased on the H1 chart analysis, we could see the price fall to the buy entry at 6,682.33, which is a pullback support and could bounce from this level to the upside.
Stop loss is at 6,651.10, which is a pullback support.
Take profit is at 6,731.11, which line sup with the 161.8% Fibonacci extensio

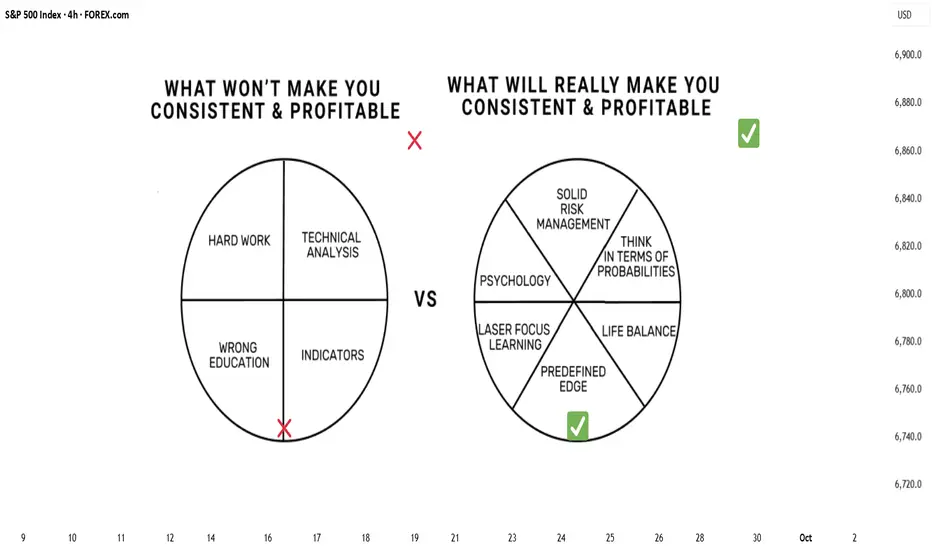
The Truth Behind Profitable TRADING ( must read)Please note : This post isn't meant to scare you away from trading. Quite the oposite. It's meant to show you what NO ONE TALKS ABOUT IT. Better to see it clearly now than learn it expensively later. This post comes from someone with more than 7 years of market experience
♾️How To Really Become P
See all ideas
Displays a symbol's price movements over previous years to identify recurring trends.
Frequently Asked Questions
S&P 500 Index reached its highest quote on Oct 2, 2025 — 6,741.6 USD. See more data on the S&P 500 Index chart.
The lowest ever quote of S&P 500 Index is 666.3 USD. It was reached on Mar 6, 2009. See more data on the S&P 500 Index chart.
S&P 500 Index is just a number that lets you track performance of the instruments comprising the index, so you can't invest in it directly. But you can buy S&P 500 Index futures or funds or invest in its components.