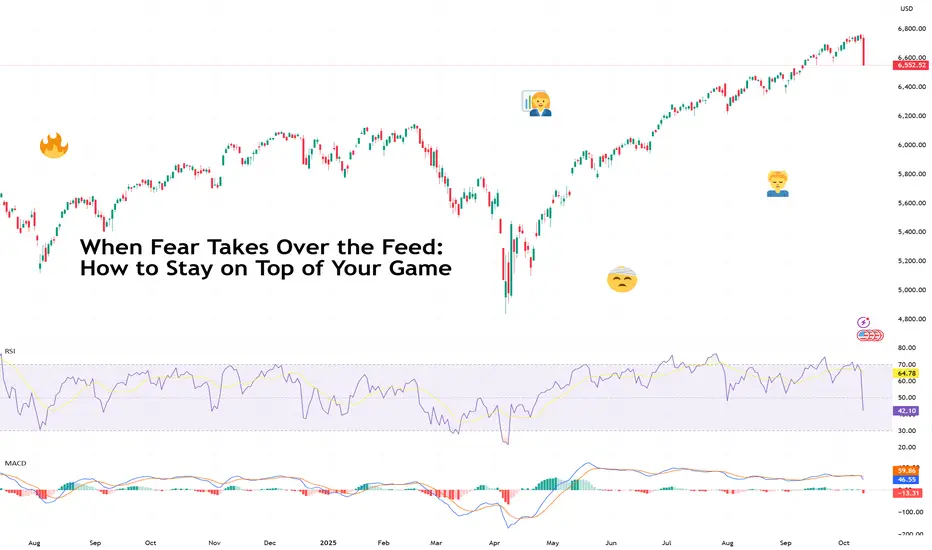
When Fear Takes Over the Feed: How to Stay on Top of Your GameFriday wasn’t just a red day — it was the kind of red that makes traders question their life choices.
The Nasdaq Composite NASDAQ:IXIC plunged 3.6% , its worst day since the April tariff-fueled meltdown.
The S&P 500 SP:SPX dropped 2.7%, the Dow Jones TVC:DJI tumbled nearly 900 points, and $
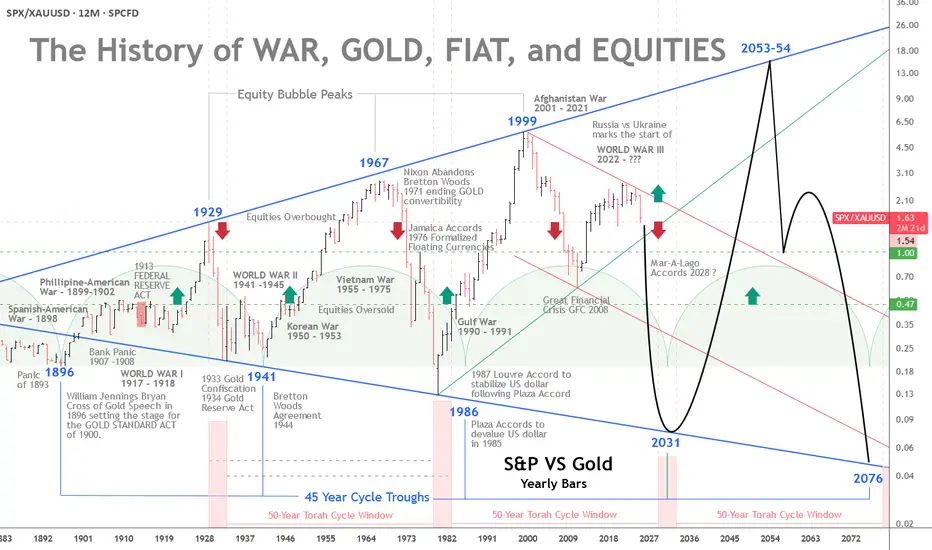
The History of War, Gold, Fiat, and EquitiesGold vs. Equities — The 45-Year Cycle and a Pending Monetary Reset
The interplay of war, gold, fiat money, and equities has long been a barometer of real wealth and economic stability. A recurring pattern emerges across modern history: approximately 45-year intervals when gold strengthens relative
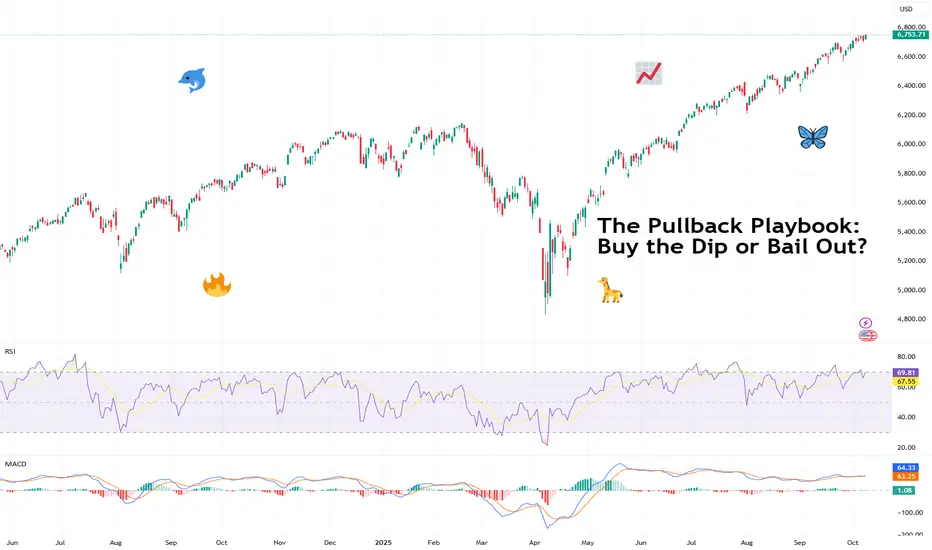
The Pullback Playbook: Buy the Dip or Bail Out?Markets don’t go up in straight lines. Even the strongest trends pause, retrace, and test your conviction.
These pauses are called pullbacks and they can either be healthy breathers before the next leg higher or the first cracks in a trend about to fall apart. The challenge for traders is knowing
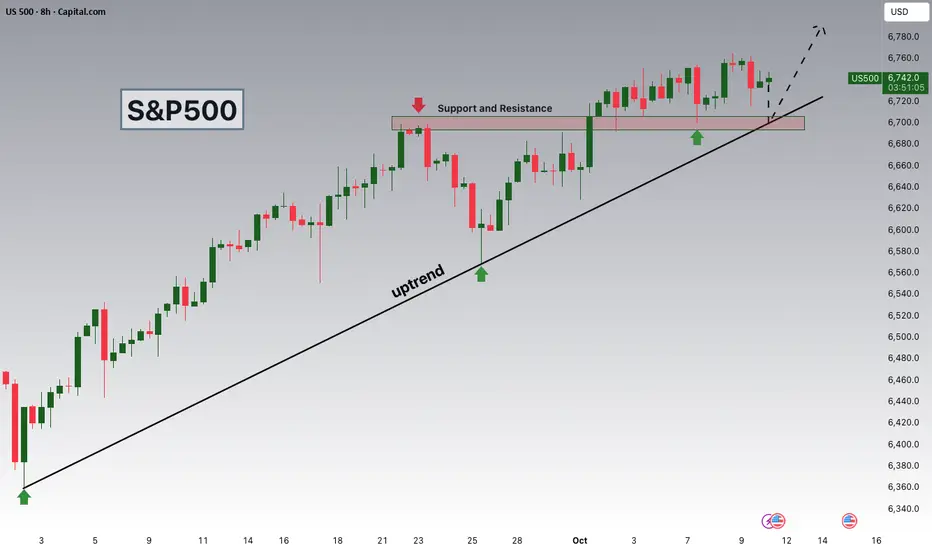
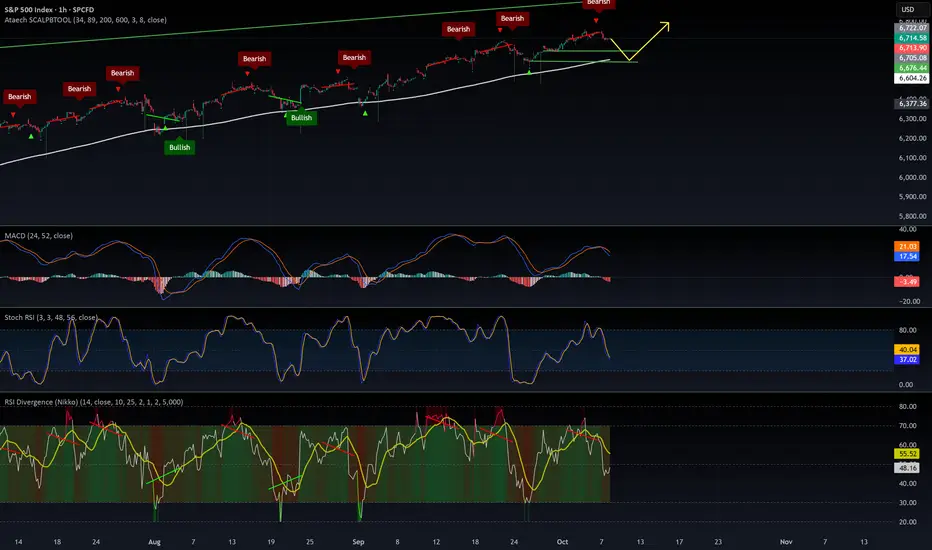
S&P 500 INDEX (US500): Bullish Signal!? As US500 Eyes New HighUpdate on 📈US500
A confirmed breakout above a significant daily resistance level was observed.
Subsequently, the market retested the breached structure and initiated consolidation within a narrow range on the 4-hour timeframe.
The range resistance was breached yesterday, which constitutes a stron

S&P 500 Watching 6,700 Support as Seasonal Tailwinds Strengthen.Hey Traders,
In today’s session, we’re keeping a close eye on US500 for a potential buying opportunity around the 6,700 zone. The S&P 500 remains firmly in an uptrend, with price currently in a healthy correction phase approaching a key support and trend confluence near 6,700.
Beyond the technical
I can't believe nowbody saw this coming for crypto. S&P 500 Technical Analysis: Long-Term Channel Pattern
The S&P 500 has been trading within a well-defined ascending parallel channel for over 5 years. As shown in the chart, the index has consistently respected both the upper resistance and lower support trendlines of this channel throughout this

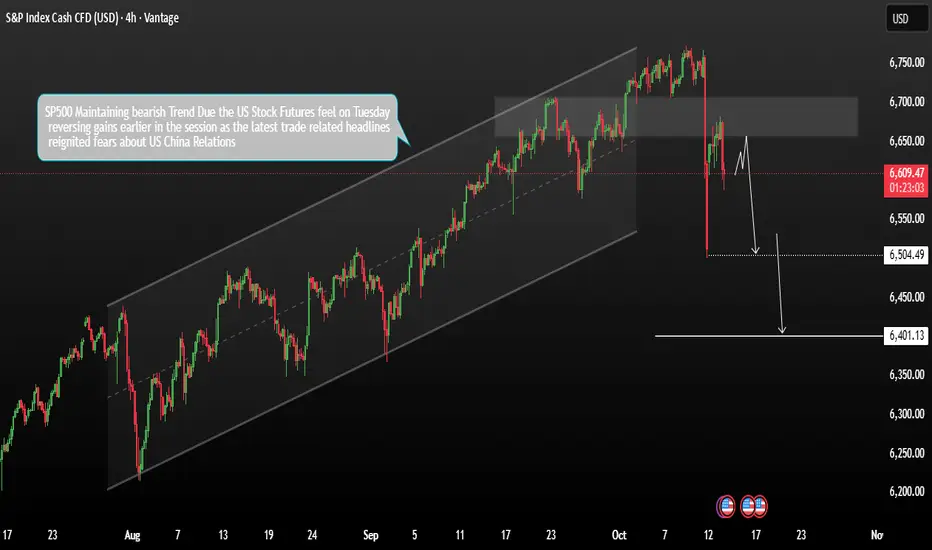
SP500Consoldation Could Next falling patternSP500 Price consolidation a bearish trend due the U.S. stock futures fell on Tuesday, reversing earlier gains as renewed concerns over U.S.–China trade relations weighed on sentiment. The latest trade-related headlines reignited fears of escalating tensions between the two economic powers.
These mo
Hellena | SPX500 (4H): SHORT to support area of 6646 .Colleagues, in the last forecast I was counting on price reaching the 6550 area, but that plan turned out to be a long term plan. I see the sense in making some shorter term targets.
The closest target I see is the 6646 support area, where wave “4” ends. This is a corrective movement, so it is nece

Hellena | SPX500 (4H): LONG to resistance area of 6777.Price made a sharp and strong move to the 6503 level, making wave “4” quite large, but this move did not break the structure.
I think that now the price is in the big wave "5" and middle wave "2".
I think that there will be an upward movement with the purpose to renew the maximum of the wave "3" of

A healthy consolidation should dip lowerA healthy consolidation should dip lower (around $6,648 or even better $6,000) before bouncing.
But will the billionaires manipulating this market have the patience — or will they fire their money into the air too soon?
Hopefully, we get a deeper correction for a solid long setup by the end of the
See all ideas
Displays a symbol's price movements over previous years to identify recurring trends.
Frequently Asked Questions
S&P 500 Index reached its highest quote on Oct 9, 2025 — 6,774.8 USD. See more data on the S&P 500 Index chart.
The lowest ever quote of S&P 500 Index is 666.3 USD. It was reached on Mar 6, 2009. See more data on the S&P 500 Index chart.
S&P 500 Index is just a number that lets you track performance of the instruments comprising the index, so you can't invest in it directly. But you can buy S&P 500 Index futures or funds or invest in its components.