ONDOUSDT UPDATE#ONDO
Update
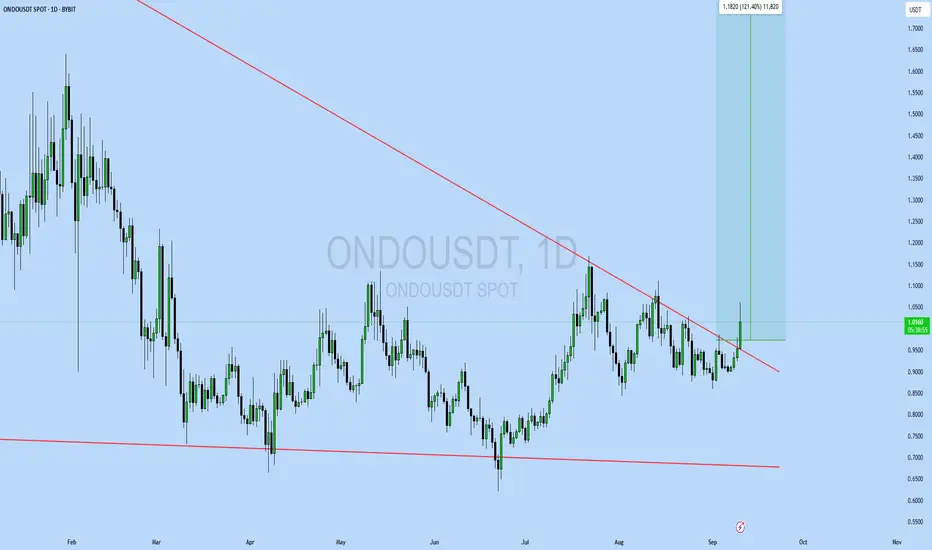
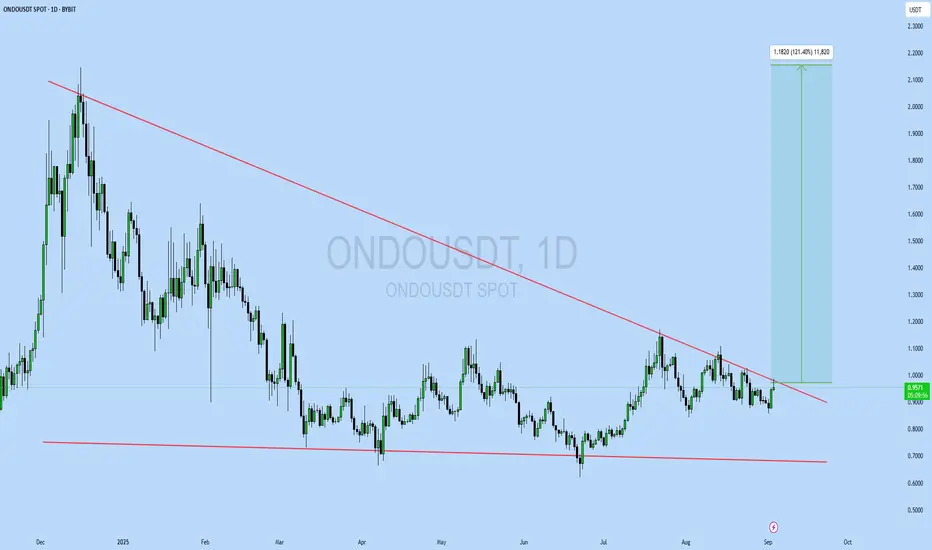
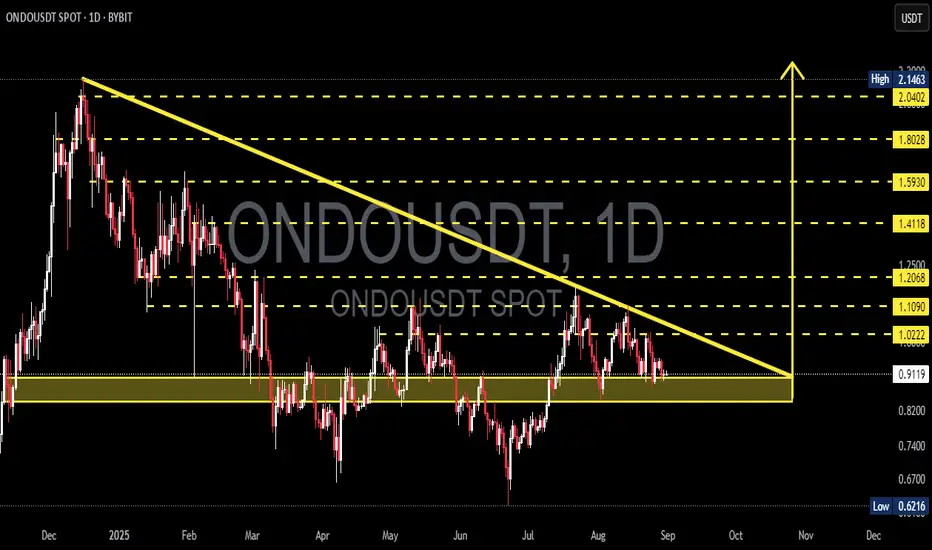
ONDO Technical Setup
Pattern: Falling Wedge Pattern
Current Price: $0.95
Target Price: $2.13
Target % Gain: 121%
Technical Analysis: ONDO is breaking out of a falling wedge on the 1D chart, a bullish reversal setup supported by strong price compression near support. A breakout above the trendline signals potential continuation toward the $2.13 zone with momentum building.
Time Frame: 1D
Risk Management Tip: Always use proper risk management.
ONDOUSDT.3L trade ideas
COTIUSDT UPDATE#COTI
UPDATE
COTI Technical Setup
Pattern : Bullish Falling Wedge pattern
Current Price: $0.05039
Target Price: $0.065
Target % Gain: 30.55%
Technical Analysis: COTI has broken out of a falling wedge on the 4H chart with bullish momentum. The breakout shows strength and suggests continuation toward $0.065, with confirmation supported by price action and breakout retest.
Time Frame: 4H
Risk Management Tip: Always use proper risk management.

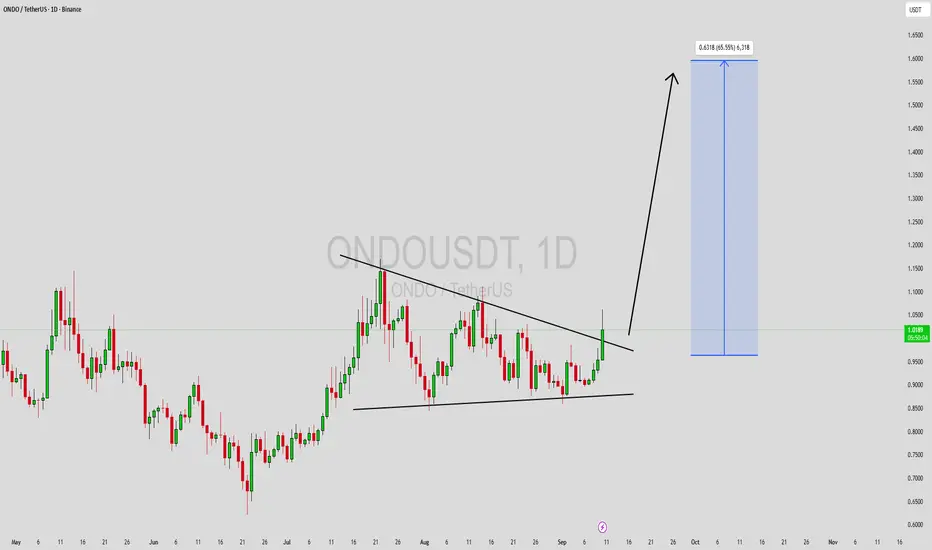
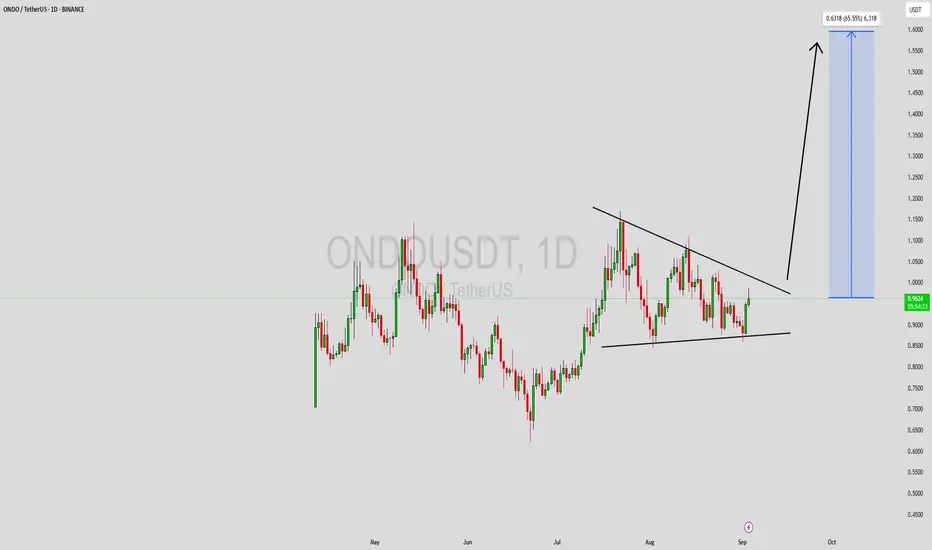
ONDOUSDT Forming Bullish ContinuationONDOUSDT is currently forming a consolidation structure that signals a potential breakout in the coming sessions. The chart pattern shows price compression within a narrowing range, which often acts as a precursor to a strong directional move. With trading volume holding steady at supportive levels, the conditions appear favorable for a bullish continuation. Investors are closely monitoring this setup, as the pair has been gathering momentum, hinting at the possibility of a significant upside rally.
If ONDOUSDT manages to break above its resistance trendline, it could trigger a strong wave of bullish momentum. The technical projection suggests a potential 50% to 60%+ gain, aligning with the market’s anticipation for higher valuations. Historically, such breakout formations have delivered powerful price surges, especially when paired with increasing investor confidence and rising market interest.
Market sentiment around ONDOUSDT has been growing more optimistic as it continues to attract investor attention. The volume profile highlights active participation, which often signals accumulation by strong hands ahead of a breakout. A confirmed move above resistance could set the stage for a sharp rally toward higher targets, giving traders and investors a strong opportunity in the short to mid-term.
In conclusion, ONDOUSDT is positioned for a bullish breakout as long as momentum continues to build. With solid volume backing the price structure and investors taking interest, the coin could be preparing for a notable rally. Traders should watch for a decisive breakout to capture the potential upside move.
✅ Show your support by hitting the like button and
✅ Leaving a comment below! (What is You opinion about this Coin)
Your feedback and engagement keep me inspired to share more insightful market analysis with you!
$ONDO - READY TO FLY???CRYPTOCAP:ONDO - 15% up already 💰
You know what's coming?? 🚀
If yes, like & share! 👍

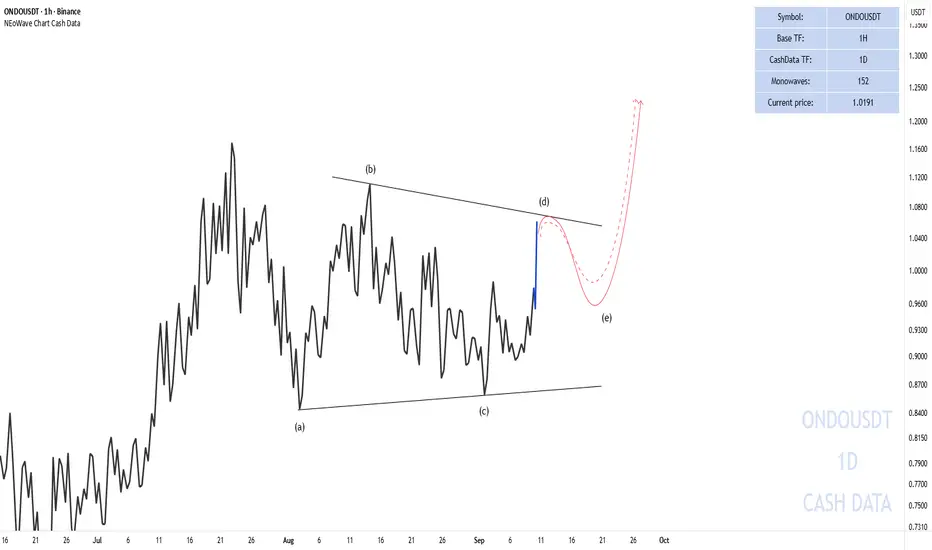
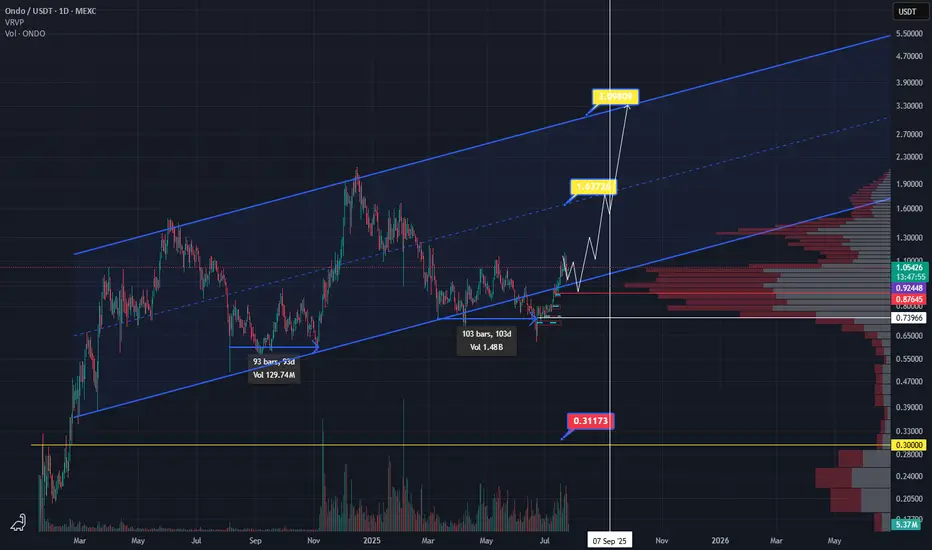
ONDO FIRST TARGETIn the daily cash data, it appears that ONDO is forming a horizontal contracting triangle.
Wave (d) of this pattern is completing in the form of a flat, where wave c of that pattern is a terminal impulse wave of the extended wave-5 type, which is nearly complete, and with the completion of wave (e), the first target for ONDO will be 1.2308.
Good luck
NEoWave Chart
ONDO’s Last Dip Before Liftoff? Don’t Miss This Entry!Yello, Paradisers! Are you positioned for a high-probability bullish reversal on #ONDO? Price is closing in on a key demand zone where a powerful move could ignite, but only if the structure holds.
💎ONDO is currently forming a Bullish Gartley Pattern, and price action is nearing the crucial $0.76–$0.80 demand zone, which completes the D-leg of the structure. This area aligns with Fibonacci confluences and offers a high-probability zone for a reversal if the pattern holds.
💎#ONDOUSDT is currently correcting towards the $0.76–$0.80 demand zone, where the point D of the Bullish Gartley Pattern is expected to complete. This area is technically significant and marks the potential start of a bullish reversal. If price reacts strongly from this zone, a reclaim of the $0.92 level would serve as the first sign of strength, setting up a move toward the moderate resistance near $1.00. This would confirm short-term bullish intent and open the door for further upside.
💎If that strength persists and momentum builds, the next logical target would be the strong resistance around $1.15–$1.20. This level has historically acted as a barrier and would likely see profit-taking or slowdown unless broader market conditions support continuation.
💎The $0.76–$0.80 zone also acts as a strong support. It’s an area where buyers are expected to defend aggressively, and it won’t be easy for sellers to push the price below it unless momentum shifts completely.
Paradisers, strive for consistency, not quick profits. Treat the market as a businessman, not as a gambler.
MyCryptoParadise
iFeel the success🌴

#ONDO - Bullish pennant still in play LSE:ONDO - Bullish pennant still in play 📈
Surely a matter of weeks before the real move start!

ONDOUSDT UPDATE#ONDO
Update
ONDO Technical Setup
Pattern: Falling Wedge Pattern
Current Price: $0.95
Target Price: $2.13
Target % Gain: 121%
Technical Analysis: ONDO is breaking out of a falling wedge on the 1D chart, a bullish reversal setup supported by strong price compression near support. A breakout above the trendline signals potential continuation toward the $2.13 zone with momentum building.
Time Frame: 1D
Risk Management Tip: Always use proper risk management.
ONDOUSDT Forming Bullish ContinuationONDOUSDT is currently forming a consolidation structure that signals a potential breakout in the coming sessions. The chart pattern shows price compression within a narrowing range, which often acts as a precursor to a strong directional move. With trading volume holding steady at supportive levels, the conditions appear favorable for a bullish continuation. Investors are closely monitoring this setup, as the pair has been gathering momentum, hinting at the possibility of a significant upside rally.
If ONDOUSDT manages to break above its resistance trendline, it could trigger a strong wave of bullish momentum. The technical projection suggests a potential 50% to 60%+ gain, aligning with the market’s anticipation for higher valuations. Historically, such breakout formations have delivered powerful price surges, especially when paired with increasing investor confidence and rising market interest.
Market sentiment around ONDOUSDT has been growing more optimistic as it continues to attract investor attention. The volume profile highlights active participation, which often signals accumulation by strong hands ahead of a breakout. A confirmed move above resistance could set the stage for a sharp rally toward higher targets, giving traders and investors a strong opportunity in the short to mid-term.
In conclusion, ONDOUSDT is positioned for a bullish breakout as long as momentum continues to build. With solid volume backing the price structure and investors taking interest, the coin could be preparing for a notable rally. Traders should watch for a decisive breakout to capture the potential upside move.
✅ Show your support by hitting the like button and
✅ Leaving a comment below! (What is You opinion about this Coin)
Your feedback and engagement keep me inspired to share more insightful market analysis with you!
ONDO - Bullish structure HTF🟢 LSE:ONDO – Bullish Structure (HTF) 📈
✅ Triple bottom confirmed near $0.86
✅ Overall bullish high time frame structure
A daily close above $1.10 = price discovery + major pump possible towards $1.30–$1.50+
Top-tier project & solid #RWA pick for the long term.Adoption wave is likely on the way!
🚨 Who wants to see a short-term chart breakdown? Drop a 👍!

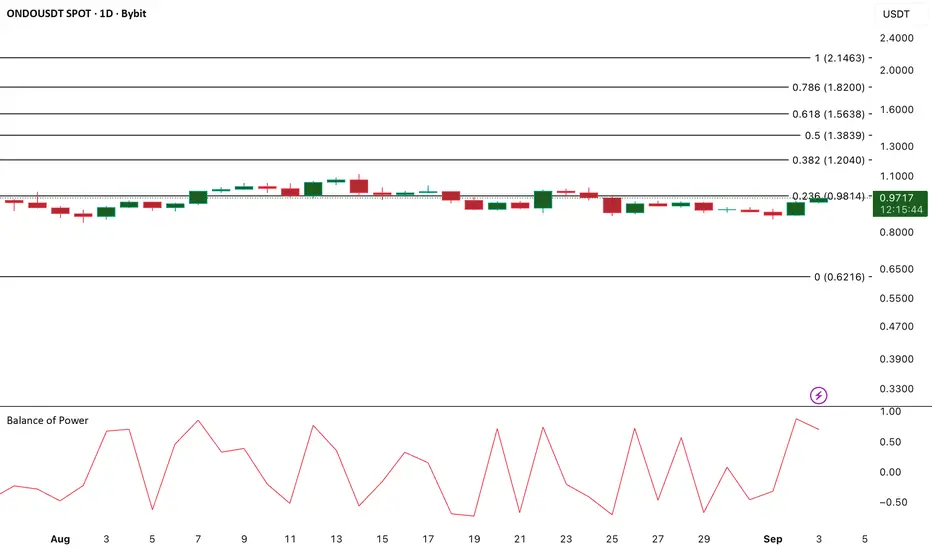
ONDO Climbs on Strong Buying Pressure, Bulls in ControlONDO is currently trading at $0.97, with technicals pointing to strong bullish momentum. The Balance of Power (BoP) indicator sits at 0.71, signaling that buyers are firmly in control. A positive BoP reflects dominance from demand over selling pressure, suggesting that bulls are steering the market trend.
If this momentum holds, ONDO could extend its rally. However, if sellers regain control, the token risks dropping some gains.
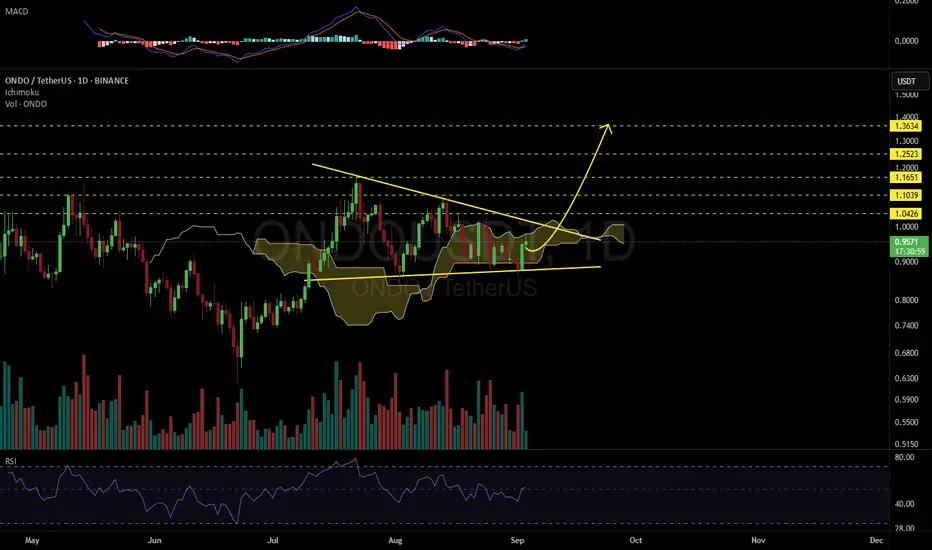
ONDOUSDT 1DKeep an eye on the #ONDO daily chart. If it breaks out above the triangle resistance and the Ichimoku cloud, the potential targets are:
🎯 $1.0426
🎯 $1.1039
🎯 $1.1651
🎯 $1.2523
🎯 $1.3634
⚠️ Always remember to use a tight stop-loss and follow proper risk management.
Ondo Trade SetupONDOUSDT 4h chart, currently ondo is trading in a downward parallel channel. Breakout from channel will be highly bullish and targets in black line will are likely to be achieved

ONDO/USDT — Descending Triangle at a Critical Zone!🔎 Pattern & Structure Analysis
ONDO/USDT is currently forming a Descending Triangle pattern, where:
Lower Highs are consistently forming (yellow descending trendline).
Horizontal support in the 0.78–0.95 USDT demand zone has been tested multiple times since early 2025.
This structure reflects increasing selling pressure, while buyers keep defending the demand zone.
Historically, a descending triangle leans toward a bearish continuation, but a strong breakout can flip the bias into a bullish reversal.
---
🟢 Bullish Scenario
If price manages to break and close daily above the descending trendline + 1.022 USDT with strong volume, upside targets open:
Target 1: 1.109 USDT (+21.6%)
Target 2: 1.206 USDT (+32.3%)
Target 3: 1.411 USDT (+54.8%)
Major Target: 1.802 – 2.04 USDT (potential >100% rally if momentum extends).
📌 Key confirmation: breakout should be followed by a successful retest to confirm strength and avoid false breakouts.
---
🔴 Bearish Scenario
If price breaks down below 0.78 USDT, the descending triangle confirms as a bearish continuation. Downside targets are:
Target 1: 0.6216 USDT (previous swing low, −31.9%).
Target 2: 0.50 USDT (psychological level).
Extended Target: 0.42–0.45 if bearish momentum accelerates.
📌 Note: The more times support is tested without a significant bounce, the weaker it becomes.
---
📌 Technical Insights
Volume: essential for confirmation — weak volume may lead to fakeouts.
Retest: both bull and bear scenarios should be confirmed by a clean retest.
Momentum: RSI on daily remains neutral, giving room for either side to take control.
Market structure: until a breakout above 1.109 or breakdown below 0.78, price remains compressed inside the triangle.
---
🎯 Conclusion
ONDO/USDT is at a make-or-break level.
Bullish → Daily close above 1.022–1.109 could trigger upside toward 1.20–1.41.
Bearish → Daily close below 0.78 could drag price to 0.62 or lower.
⚠️ Descending triangles statistically favor the downside, but confirmation with daily close + volume is key. Always wait for validation before positioning.
---
ONDO is consolidating inside a Descending Triangle near the 0.78–0.95 demand zone. The price is at the tip of the structure, preparing for a major move.
Bullish → Daily close above 1.022–1.109 → upside targets 1.20–1.41.
Bearish → Breakdown below 0.78 → downside targets 0.62, then 0.50.
This is a decisive zone. Watch for confirmation with volume and retests before taking entries.
#ONDO #ONDOUSDT #Crypto #TechnicalAnalysis #CryptoTrading #ChartPattern #DescendingTriangle
ONDO looking hectic. Time to prepare. ONDO is still within range, potentially finding its bottom. This would be a good time to formulate a setup based on RR. BOS = get out. If CHOCH, then enjoy the ride.

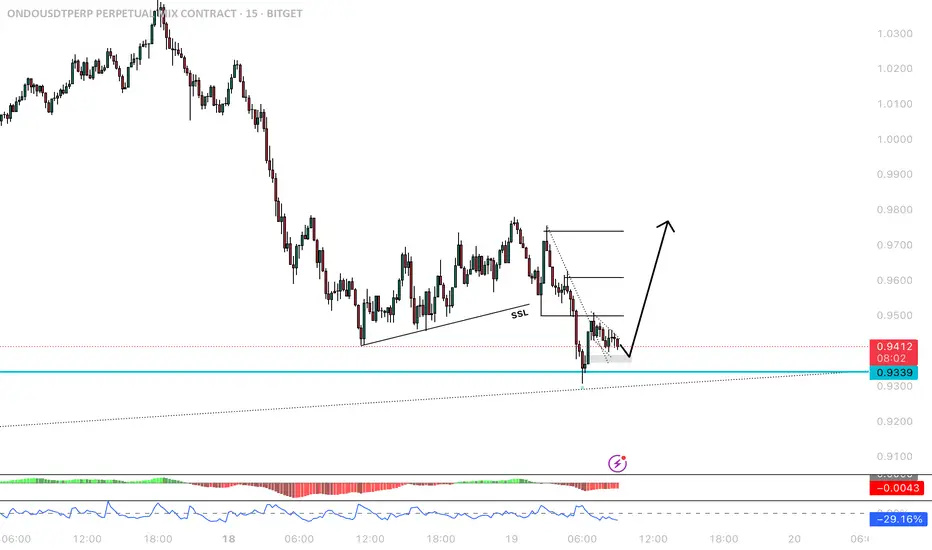
ONDOUSDT Long scalpAfter the Liquidity Sweap we saw the breakout out of the trendline. I´ll wait for a retest at the FVG on 5min Timeframe to enter a long trade. As well we have divergence on the Macd
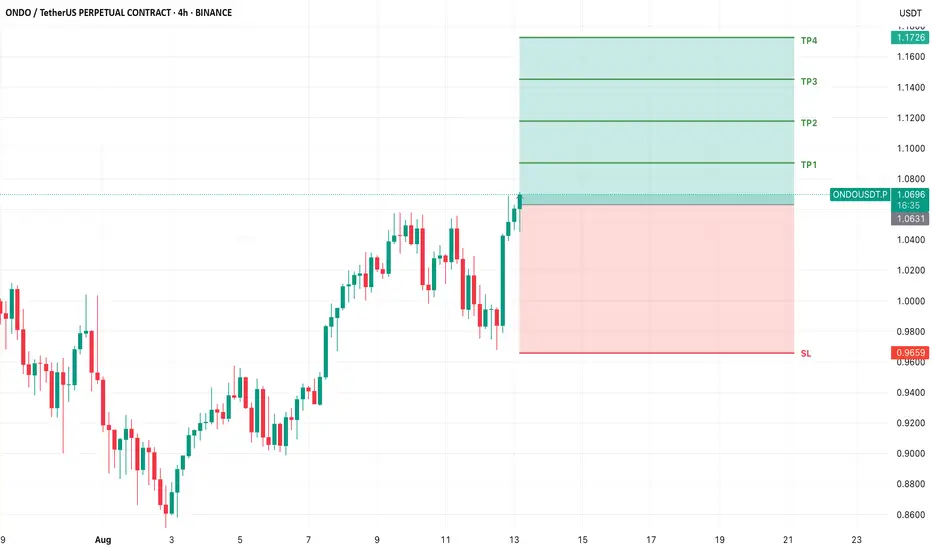
ONDO LONG TRADE SETUPNew Trade Setup: ONDO-USDT
LONG
Entry: 1.0631 OR CMP
Target: TP1: 1.0905, TP2: 1.1179, TP3: 1.1452, TP4: 1.1726
Stoploss: 0.9659
Leverage: 1X
Technical Analysis: ONDO/USDT has a high potential for a breakout from this resistance area, supported by strong volume. The RSI is currently at 60.
#ONDO Ready to Make a Bullish Move | Must Watch For BullsYello, Paradisers! Is #ONDO getting ready for a powerful breakout, or are we about to witness yet another bull trap? Let’s break down the real picture on #ONDOUSDT:
💎After steadily climbing inside an ascending wedge, #ONDOUSD is now pressing against a key resistance area around $1.05–$1.07. A breakout above this zone would significantly boost the probability of a bullish continuation, especially with the 50EMA providing underlying support.
💎The immediate support zone to watch is between $0.84–$0.85, aligning with the lower boundary of the channel and overlapping with a visible demand area. This is where we expect buyers to defend the trend if any pullback occurs.
💎If bulls manage to hold this zone and break through the current resistance, our next upside target is the moderate resistance level at $1.34. From there, the strong resistance sits at $1.72, which will be the key decision point for any further upside momentum.
💎On the flip side, a breakdown below $0.72, our bullish invalidation level, would nullify this setup entirely and open the door for a deeper drop, where sellers are likely to step in aggressively.
Stay patient, Paradisers. Let the breakout confirm, and only then do we strike with conviction.
MyCryptoParadise
iFeel the success🌴

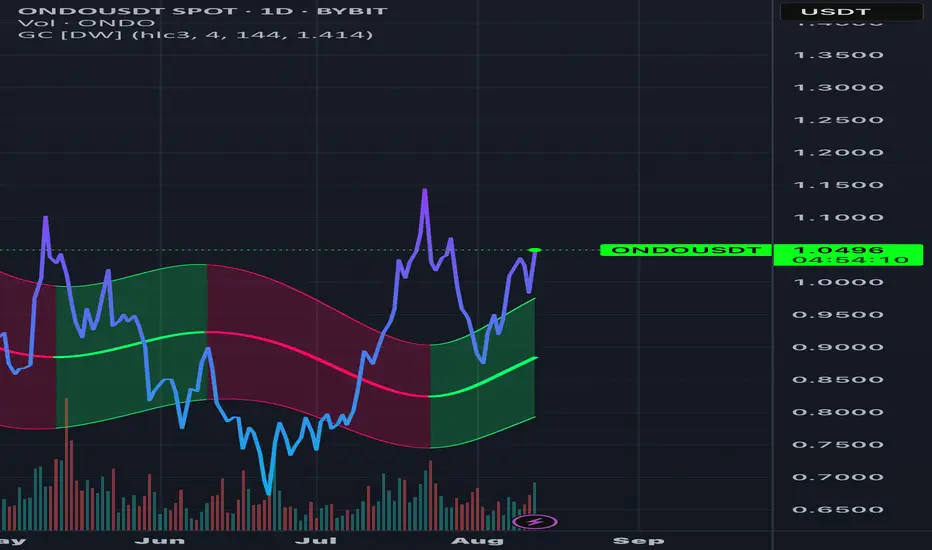
$ONDO is Ready to Go to the Moon !!!Today’s push reclaimed the recent range and is pressing into the prior supply zone just under $1.05–$1.07.
• the bands (GC / Gaussian‑style channel)
• Price is above the baseline and inside the green regime, which = short‑term bullish bias.
• As long as candles keep closing above the midline, momentum favors upside tests.
• “True” Fib map using the last impulsive leg (~$0.84 → ~$1.15)
• Range = 0.31.
• Key retrace supports: 38.2% = ~$1.032, 50% = ~$0.995, 61.8% = ~$0.958, 78.6% = ~$0.906.
• Above $0.995 keeps price in “premium”; dips into $1.03–$1.00 are buy-the-dip territory if the uptrend holds.
• Levels to watch
• Immediate resistance: $1.05–$1.07 (then $1.10).
• Major resistance / breakout: $1.15 (prior swing high).
• Upside extensions if $1.15 breaks: 1.272 ≈ $1.234, 1.618 ≈ $1.342.
• Supports: $1.03–$1.00, then $0.958, then $0.906.
• Invalidation for bulls: Daily close back below $0.95 or a close back into the red channel.
• Trade idea framing (not advice)
• Bullish continuation: Hold above $1.03–$1.00 → retest $1.10 / $1.15; break and hold over $1.15 opens $1.23–$1.34.
• Failure scenario: Lose $0.995 convincingly → likely revisit $0.958 or the channel midline.
ONDO Bullish structureOndo is back to bullish scenario. We can see long accumulation more then 100 days. As you can see price 0.9 is back and then bullish coming. So 0.85 and 0.9 have to hold and we can buy the dip.
Keep in mind if Ethereum start to attack ATH, Eth ecosystem will grow much higher. So watch this level in next couple weeks and months.
Ondo (ONDO): 200 EMA is Key Zone | Aiming for $1.50-2.20$1.50 - $2.20 is the key target zone for us, where the price of ONDO has been moving in a sideways channel since the summer of 2024.
The channel has established a proper support zone where now we are looking for another touch to upper zones, after price recently broke the local zone of EMAs, which usually has been a market for trend switch.
Swallow Academy

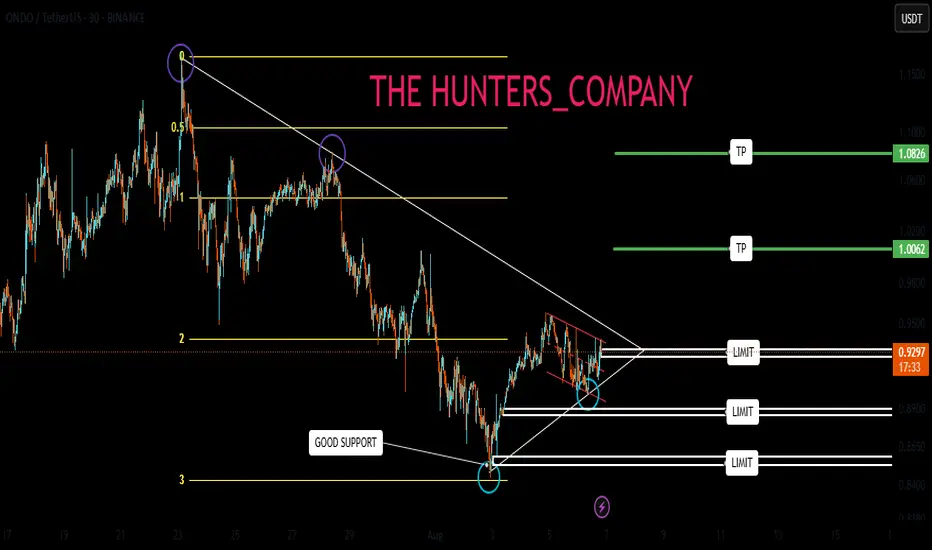
ONDO:What are the implications of being listed on an exchange?Hello friends🙌
What are the implications of being listed on an exchange?
✅Well, the first question that comes to mind when a currency is listed on an exchange is what impact does it have? Will the price be pumped or dumped? Let's examine it together.
✅Well, many currencies are listed on exchanges, and not every currency that is listed is necessarily pumped or dumped.
Many factors are involved in this, the most important of which is the chart.
✅So, if we look at the chart of this currency in the 30-minute time frame, which can be considered a short-term time frame, we see that we had a decline due to the selling pressure in the market for the past few days, and now we see that in the third leg of the Fibonacci, buyers supported the price and created higher lows.
✅Now, these higher lows alone are not enough for us to buy, we need other confirmations, the most important of which is a valid breakdown of the identified resistance.
By breaking this resistance validly, we can buy in the areas we have identified for you in a stepwise manner, with capital and risk management, and move towards the specified goals.
If it fails to break the specified resistance and the buyers do not have enough power, we will refrain from buying it.
✅So this was the listing of currencies on the exchange and its impact on the currency price.✅
🔥Follow us for more signals🔥
*Trade safely with us*
TradeCityPro | ONDO Builds Strength Beneath Key Supply Barrier👋 Welcome to TradeCity Pro!
In this analysis, I want to review the ONDO coin for you — one of the RWA projects, currently ranked 37th on CoinMarketCap with a market cap of $2.93 billion.
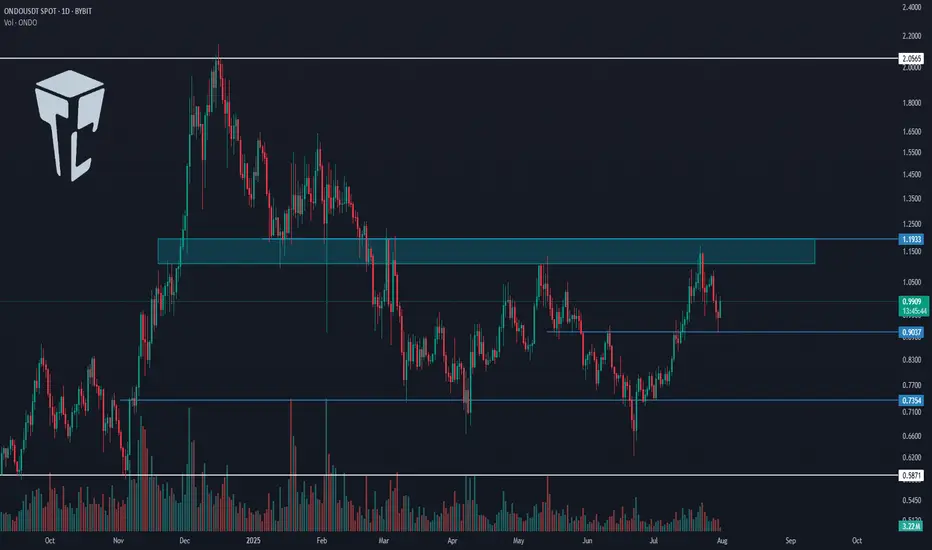
📅 Daily Timeframe
In the daily timeframe, as you can see, this coin has formed a range box between the levels of 0.7354 and 1.1933, and the price is currently sitting in the upper half of this box.
✔️ At the moment, the price is hovering around 0.9037, and it’s forming a higher low above 0.7354. If this low gets confirmed, the probability of breaking above 1.1933 increases.
⭐ The 1.1933 zone is a very significant supply level that was previously acting as support in late 2024, and after being broken, has since acted multiple times as resistance.
📊 If this area breaks, we can open a long position, or even buy this coin in spot. Personally, if this trigger is broken, I’ll open a long-term long position.
✨ The target for this position is 2.0565, and once the price reaches this level, we can take profits and consider a spot buy.
📝 Final Thoughts
This analysis reflects our opinions and is not financial advice.
Share your thoughts in the comments, and don’t forget to share this analysis with your friends! ❤️