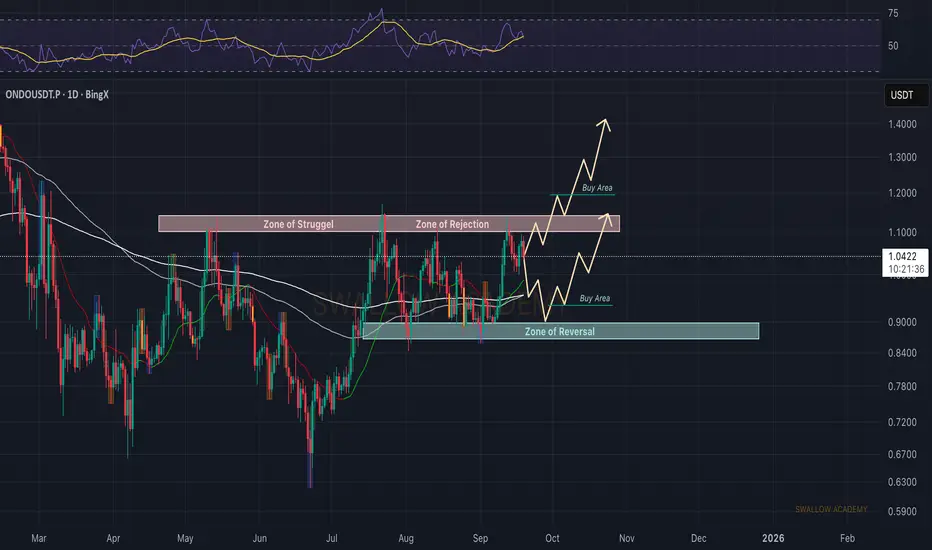
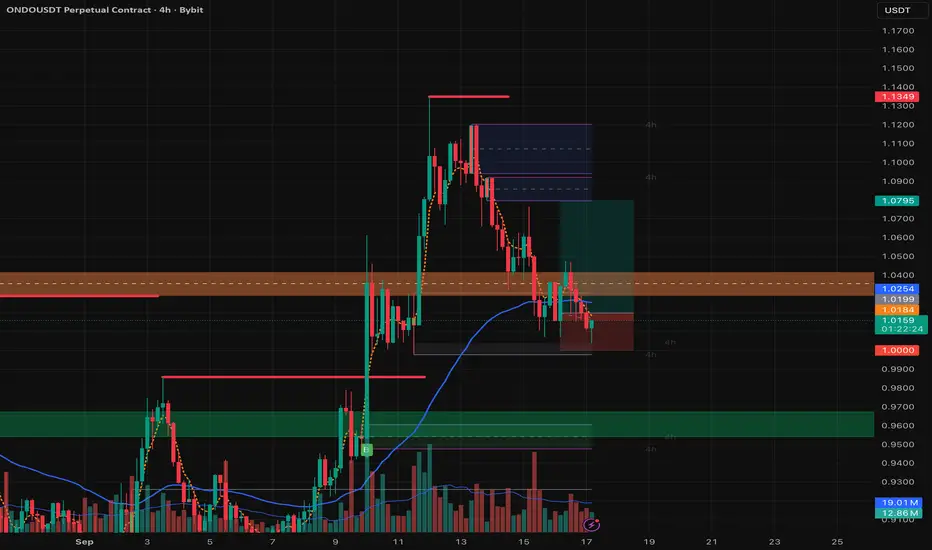
Ondo (ONDO): Looking For Buy Entry Soon!ONDO is once again testing the zone of struggle, but the recent smaller rejection shows weakness kicking in across markets and here as well. Buyers will need to reclaim this area with strength; otherwise, another retest of the lower buy zone (zone of reversal) becomes likely. As long as we stay under this rejection zone, upside remains capped.
Swallow Academy
Trade ideas
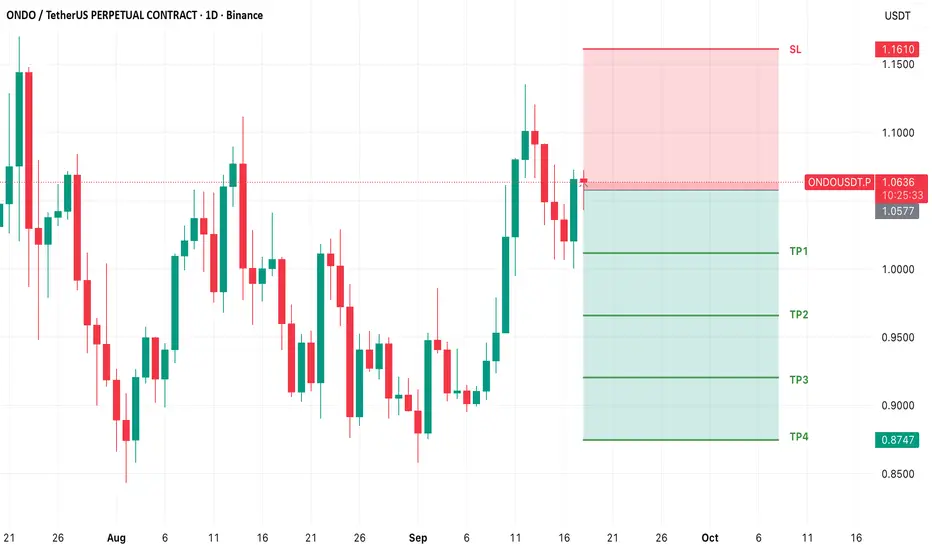
ONDO SHORT TRADE SETUPONDO-USDT
SHORT
Entry: 1.0574 or CMP
Target: TP1: 1.0117, TP2: 0.9660, TP3: 0.9203, TP4: 0.8747
Stoploss: 1.1610
Leverage: 1X
Technical Analysis: ONDO/USDT is taking reversal at its resistance zone, indicating a high chance of a short-term trend reversal. We may see an downtrend in the short term.
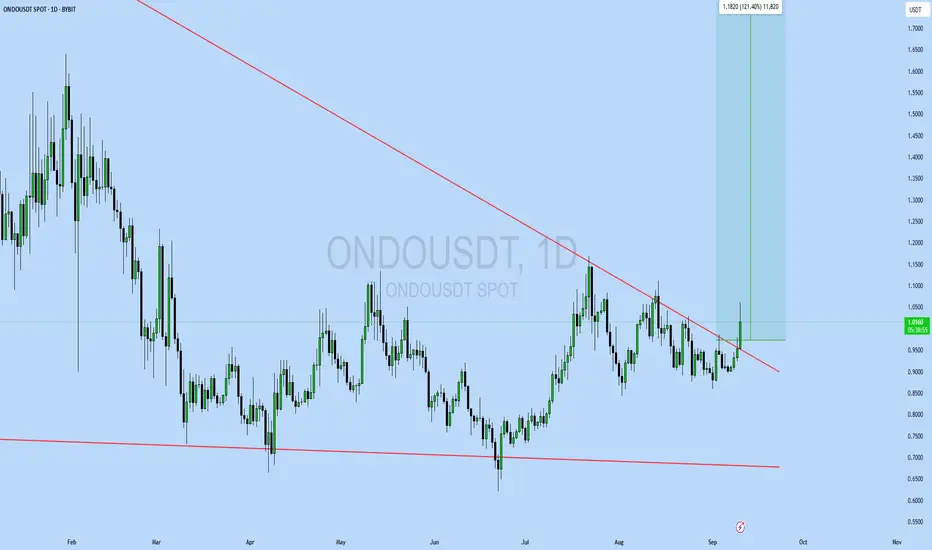
$ONDO - I am IN, entry @ $1.051CRYPTOCAP:ONDO I am officially in, order got triggered.
Great volume spike on a breakout above 200 SMA on 1-day chart.
RSI jumped to 68, great sign.
Stop loss placed at $0.975
Good luck but don't follow me, do your own research👽💙

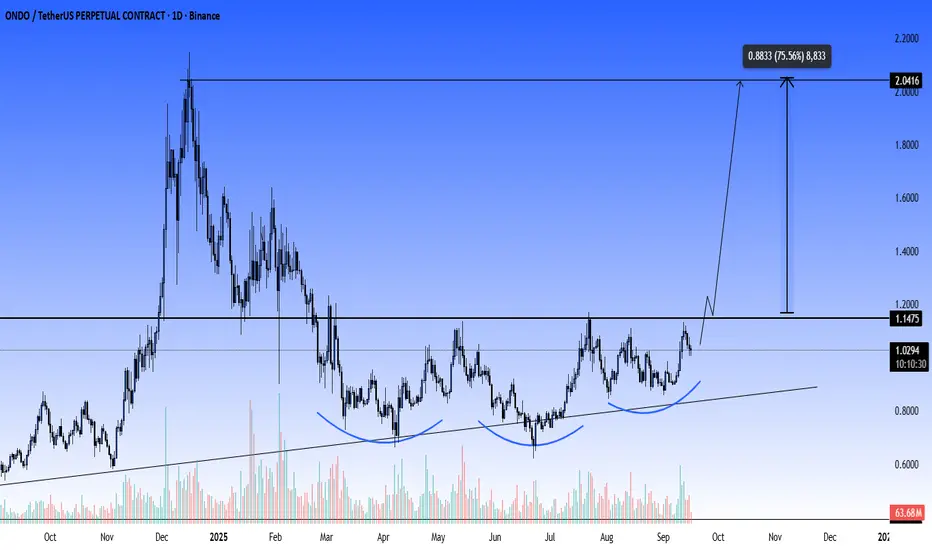
ONDO - BULLISH RETEST? Remember my view on LSE:ONDO
Are we at the 50% fib & key retest before the moonshot? 🚀
Or are bears strong enough to push lower?
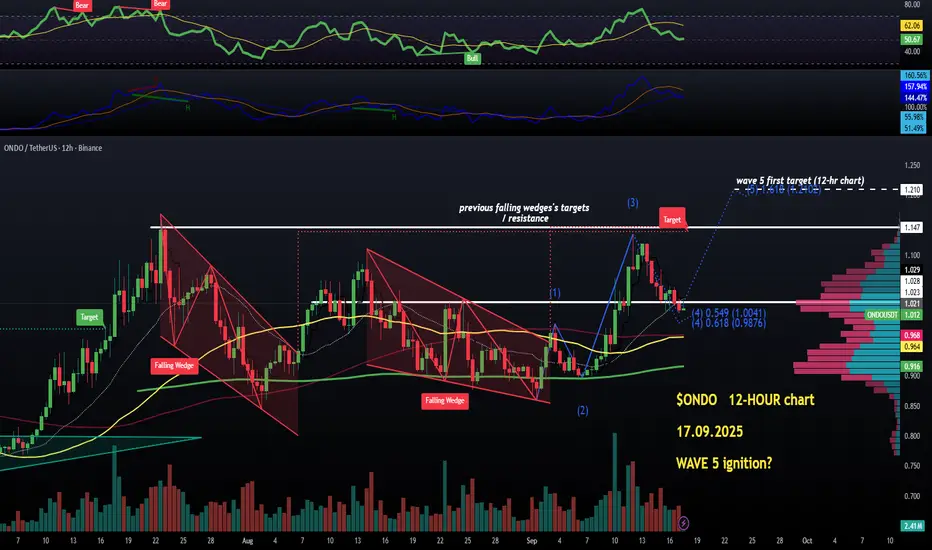
$ONDO on 12-HR chart... likely WAVE 5 ignition incoming LSE:ONDO staying BULLISH on the 12-hr chart, currently should be finishing Wave 4 retracement soon, it hit my stop loss but it was a very small loss, the wider markets bled due to FED decision later on today.
Wave 5 could start anytime initially aiming for $1.21. Staying on the sidelines with all future action for now but this is worth monitoring. Rsi and OBV profiles staying bullish wih no divergences.
Liqudity mostly above $1.10 - $1.13 for the last quarter, so magnet to the upside on this chart.
Shorter timeframes in next posts of mine👽💙
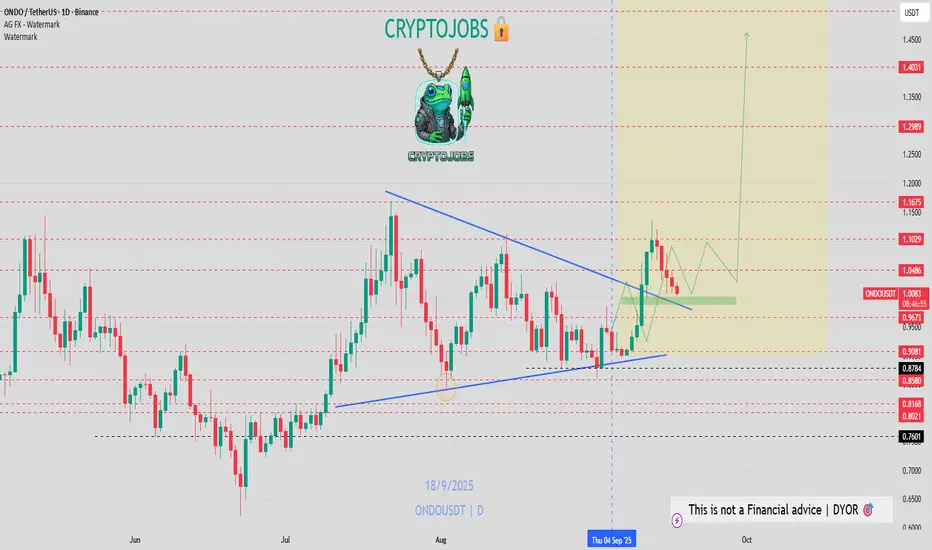
ONDO – Another Juicy Long?Another day, another long setup on the radar! ONDO is looking pretty juicy right now, with price action hinting at more upside potential.
Trend momentum is still holding, and if buyers keep the pressure on, we could see continuation from here. Let’s see if ONDO delivers! 👀🔥
ONDOUSD – Waiting for Bullish Re-entry After 13% SurgeONDO recently posted a 13%+ rally, showing strong bullish momentum. However, the price faced resistance and is now pulling back, likely heading toward a key support zone between $0.85 and $0.78. This level has historically acted as a solid base, and we’re watching for signs of a bullish reversal there.
📉 Retracement Expected
The current rejection suggests a healthy correction. A controlled move back into the support range could offer a high-probability long setup—if buyers step in and price action confirms.
📈 Trade Setup (Spot Long):
• Entry Zone: $0.85 – $0.78
• Targets:
🥇 TP1: $1.13 – $1.32
🥈 TP2: $1.64 – $2.00
• Stop Loss: Daily close below $0.75

Ondousdt iH&S pattern about to take breakoutondo will dominate this bull rally , LFG...
trgt $2 ,$2.5 , $3
send it to the moon...
ONDO / USDT : Retest successful , Strong rally aheadONDO/USDT after a successful retest is now ready for a strong rally towards $1.20 – $1.40.
📌 Manage risk wisely.
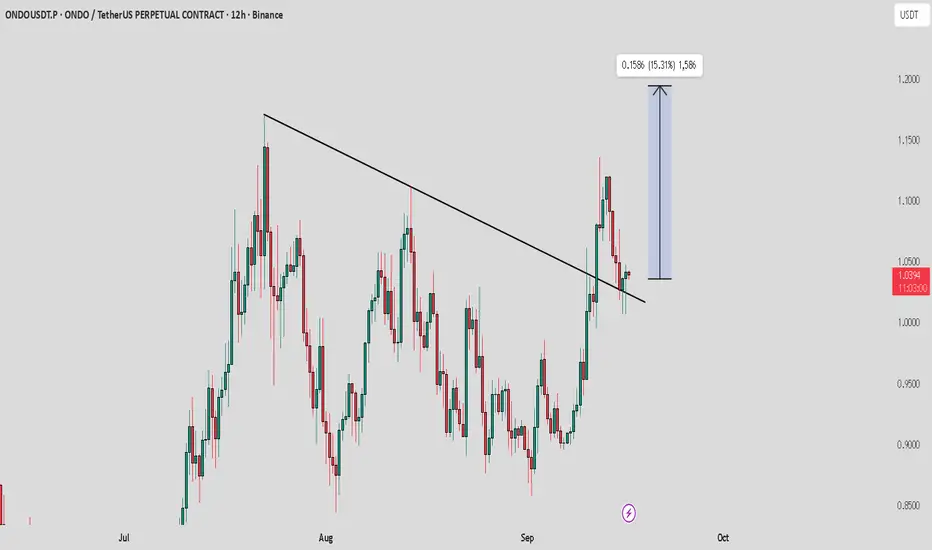
Range Locked, But Bulls are Knocking on the DoorCRYPTOCAP:ONDO has been moving inside a wide sideways range for months, bouncing between support and resistance.
Recently, it broke above the falling resistance line and is now holding around the mid S/R zone.
If buyers keep control here, price could work its way back toward the upper resistance; losing this level, however, risks a slide toward the lower support zone.
DYOR, NFA
#PEACE
Stay tuned for more updates!

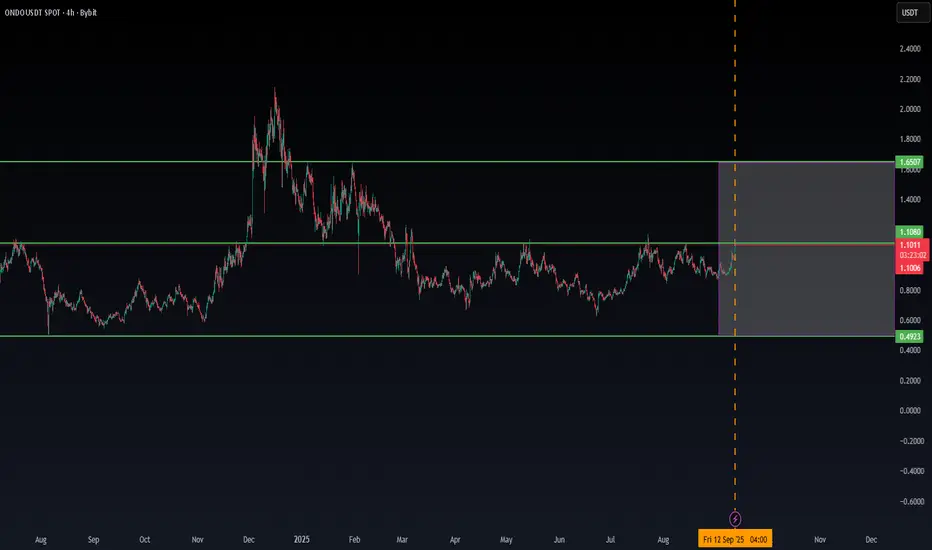
ONDO CAN DO IT AGAIN.. The same study as WLDIt's been a long time since ONDO showed a new increasing trend.
Following the coming hours to see if WLD is able to open a new cycle
Never enter any trend directly, wait for the confirmations, and trade only depending on your setups.
ONDO can do in the coming time a target to up $1.65
WE did before similar idea before with WLD, and it targeted in 24H from $0,90 to up $2
This update:
Lets see what ONDO CAN do, the same study as WLD.
waiting for BTC low time frame confirmation, when this happens, it will give ONDO new power support volume.
This can happen in the next hours.

ONDO/USDT NEW INCREASE VOLUME💎Last data show that ONDO has the chance to break in the coming time on the low time frame.
We will follow up on this reason, ONDO to check for confirmations.
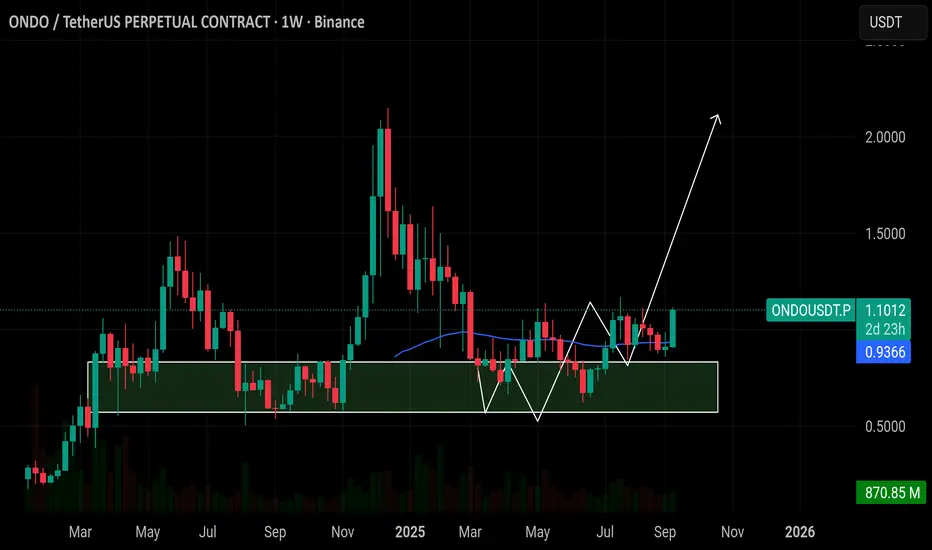
$ONDO: Both Entries Filled — Bullish Wave LoadingCRYPTOCAP:ONDO : Both Entries Filled — Bullish Wave Loading 🚀
Both support entries triggered successfully, and buyers stepped in with conviction. The inverse head & shoulders on the weekly chart is becoming clearer, pointing to a major bullish reversal.
🔸 Support at $0.85 – $0.92
This zone is now proven demand. As long as ONDO holds it, the bullish structure stays intact.
🔸 Upside Target: $2 – $2.50
With the breakout brewing, weekly momentum could fuel a move toward previous highs, especially if volume continues to build.
🔸 Risk Level at $0.54
That’s still the ultimate invalidation level, but with supports holding, probability leans toward continuation.
Outlook:
Entries filled now it’s about managing the trade.
Trail stops into profit as ONDO pushes higher.
#ONDO is doing exactly what accumulation patterns are meant to do flush out weak hands, fill supports, and then launch.
ONDO Retest Setup – Spot Long Opportunity from SupportText (Description):
ONDO has been extremely bullish over the past few days, breaking out of a key resistance zone and showing strong momentum. Now, price is now retesting the breakout level, which could act as support — a classic continuation setup for a spot long entry.
🔹 Entry Zone: $0.98 – $1.00 (Support Retest)
🔹 Take Profit 1: $1.10 – $1.25
🔹 Take Profit 2: $1.40 – $1.55
🔹 Stop Loss: Below $0.95
🔹 Risk/Reward: Favorable setup based on trend continuation
#ONDO #Crypto #SpotTrade #SupportResistance #BullishSetup #TradingView #CryptoAnalysis #PriceAction

ONDOUSDT UPDATE#ONDO
Update
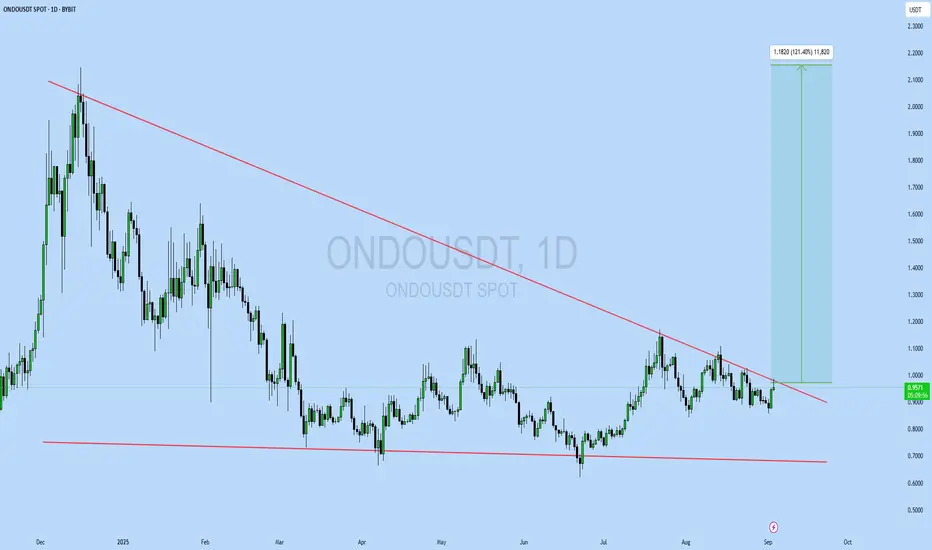
ONDO Technical Setup
Pattern: Falling Wedge Pattern
Current Price: $0.95
Target Price: $2.13
Target % Gain: 121%
Technical Analysis: ONDO is breaking out of a falling wedge on the 1D chart, a bullish reversal setup supported by strong price compression near support. A breakout above the trendline signals potential continuation toward the $2.13 zone with momentum building.
Time Frame: 1D
Risk Management Tip: Always use proper risk management.
COTIUSDT UPDATE#COTI
UPDATE
COTI Technical Setup
Pattern : Bullish Falling Wedge pattern
Current Price: $0.05039
Target Price: $0.065
Target % Gain: 30.55%
Technical Analysis: COTI has broken out of a falling wedge on the 4H chart with bullish momentum. The breakout shows strength and suggests continuation toward $0.065, with confirmation supported by price action and breakout retest.
Time Frame: 4H
Risk Management Tip: Always use proper risk management.

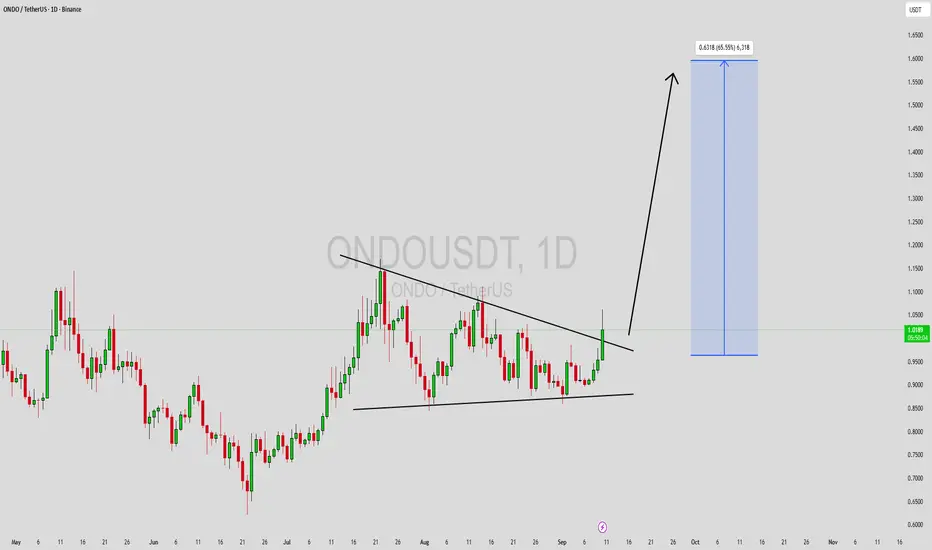
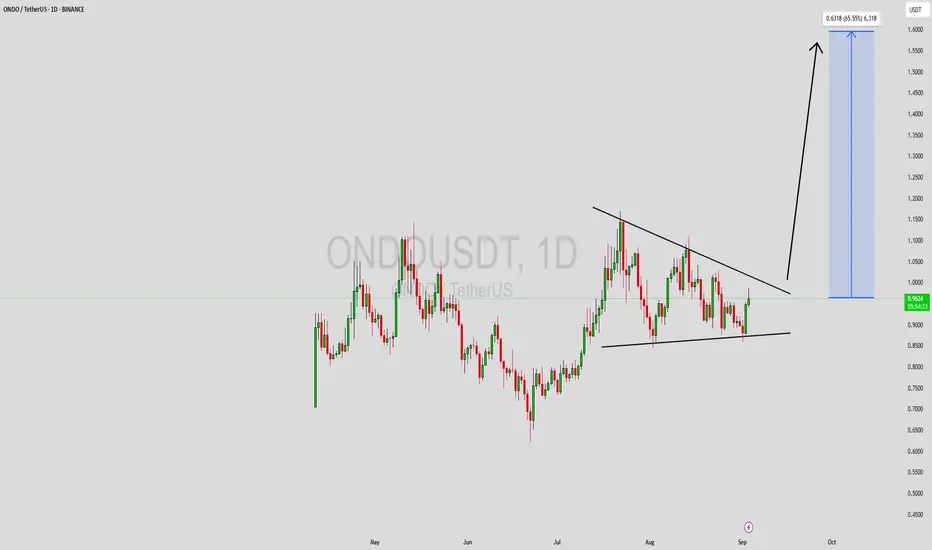
ONDOUSDT Forming Bullish ContinuationONDOUSDT is currently forming a consolidation structure that signals a potential breakout in the coming sessions. The chart pattern shows price compression within a narrowing range, which often acts as a precursor to a strong directional move. With trading volume holding steady at supportive levels, the conditions appear favorable for a bullish continuation. Investors are closely monitoring this setup, as the pair has been gathering momentum, hinting at the possibility of a significant upside rally.
If ONDOUSDT manages to break above its resistance trendline, it could trigger a strong wave of bullish momentum. The technical projection suggests a potential 50% to 60%+ gain, aligning with the market’s anticipation for higher valuations. Historically, such breakout formations have delivered powerful price surges, especially when paired with increasing investor confidence and rising market interest.
Market sentiment around ONDOUSDT has been growing more optimistic as it continues to attract investor attention. The volume profile highlights active participation, which often signals accumulation by strong hands ahead of a breakout. A confirmed move above resistance could set the stage for a sharp rally toward higher targets, giving traders and investors a strong opportunity in the short to mid-term.
In conclusion, ONDOUSDT is positioned for a bullish breakout as long as momentum continues to build. With solid volume backing the price structure and investors taking interest, the coin could be preparing for a notable rally. Traders should watch for a decisive breakout to capture the potential upside move.
✅ Show your support by hitting the like button and
✅ Leaving a comment below! (What is You opinion about this Coin)
Your feedback and engagement keep me inspired to share more insightful market analysis with you!
$ONDO - READY TO FLY???CRYPTOCAP:ONDO - 15% up already 💰
You know what's coming?? 🚀
If yes, like & share! 👍

ONDO’s Last Dip Before Liftoff? Don’t Miss This Entry!Yello, Paradisers! Are you positioned for a high-probability bullish reversal on #ONDO? Price is closing in on a key demand zone where a powerful move could ignite, but only if the structure holds.
💎ONDO is currently forming a Bullish Gartley Pattern, and price action is nearing the crucial $0.76–$0.80 demand zone, which completes the D-leg of the structure. This area aligns with Fibonacci confluences and offers a high-probability zone for a reversal if the pattern holds.
💎#ONDOUSDT is currently correcting towards the $0.76–$0.80 demand zone, where the point D of the Bullish Gartley Pattern is expected to complete. This area is technically significant and marks the potential start of a bullish reversal. If price reacts strongly from this zone, a reclaim of the $0.92 level would serve as the first sign of strength, setting up a move toward the moderate resistance near $1.00. This would confirm short-term bullish intent and open the door for further upside.
💎If that strength persists and momentum builds, the next logical target would be the strong resistance around $1.15–$1.20. This level has historically acted as a barrier and would likely see profit-taking or slowdown unless broader market conditions support continuation.
💎The $0.76–$0.80 zone also acts as a strong support. It’s an area where buyers are expected to defend aggressively, and it won’t be easy for sellers to push the price below it unless momentum shifts completely.
Paradisers, strive for consistency, not quick profits. Treat the market as a businessman, not as a gambler.
MyCryptoParadise
iFeel the success🌴

#ONDO - Bullish pennant still in play LSE:ONDO - Bullish pennant still in play 📈
Surely a matter of weeks before the real move start!

ONDOUSDT UPDATE#ONDO
Update
ONDO Technical Setup
Pattern: Falling Wedge Pattern
Current Price: $0.95
Target Price: $2.13
Target % Gain: 121%
Technical Analysis: ONDO is breaking out of a falling wedge on the 1D chart, a bullish reversal setup supported by strong price compression near support. A breakout above the trendline signals potential continuation toward the $2.13 zone with momentum building.
Time Frame: 1D
Risk Management Tip: Always use proper risk management.
ONDOUSDT Forming Bullish ContinuationONDOUSDT is currently forming a consolidation structure that signals a potential breakout in the coming sessions. The chart pattern shows price compression within a narrowing range, which often acts as a precursor to a strong directional move. With trading volume holding steady at supportive levels, the conditions appear favorable for a bullish continuation. Investors are closely monitoring this setup, as the pair has been gathering momentum, hinting at the possibility of a significant upside rally.
If ONDOUSDT manages to break above its resistance trendline, it could trigger a strong wave of bullish momentum. The technical projection suggests a potential 50% to 60%+ gain, aligning with the market’s anticipation for higher valuations. Historically, such breakout formations have delivered powerful price surges, especially when paired with increasing investor confidence and rising market interest.
Market sentiment around ONDOUSDT has been growing more optimistic as it continues to attract investor attention. The volume profile highlights active participation, which often signals accumulation by strong hands ahead of a breakout. A confirmed move above resistance could set the stage for a sharp rally toward higher targets, giving traders and investors a strong opportunity in the short to mid-term.
In conclusion, ONDOUSDT is positioned for a bullish breakout as long as momentum continues to build. With solid volume backing the price structure and investors taking interest, the coin could be preparing for a notable rally. Traders should watch for a decisive breakout to capture the potential upside move.
✅ Show your support by hitting the like button and
✅ Leaving a comment below! (What is You opinion about this Coin)
Your feedback and engagement keep me inspired to share more insightful market analysis with you!
ONDO - Bullish structure HTF🟢 LSE:ONDO – Bullish Structure (HTF) 📈
✅ Triple bottom confirmed near $0.86
✅ Overall bullish high time frame structure
A daily close above $1.10 = price discovery + major pump possible towards $1.30–$1.50+
Top-tier project & solid #RWA pick for the long term.Adoption wave is likely on the way!
🚨 Who wants to see a short-term chart breakdown? Drop a 👍!
