$ONDO/USDT BUT SETUPONDO/USDT 4-hour chart is showing a slow recovery from the support zone around 0.45–0.47 after multiple rejections in the past, which means buyers are still protecting this level strongly. Price has broken slightly above the descending trendline for the first time in a long time, showing that selling pressure is weakening and buyers are trying to take control. Candles are trading above the short moving average and momentum looks like it is shifting bullish, but the price still needs to hold above 0.47–0.48 to confirm strength. If the price keeps holding this support and stays above the trendline, it can continue moving upward gradually towards higher resistance levels, while a drop back below 0.47 again may weaken the move and bring consolidation near the support zone.
Trade ideas

ondo spotONDOUSDT – Elliott Wave Setup (1D Timeframe)
ONDO is completing a corrective structure and showing signs of reversal from the b-wave (C) low, hinting at a potential start of a new impulsive move upward.
📈 Analysis Summary:
Structure: Complex corrective wave (A)-(B)-(C) forming a bottom near $0.63–$0.65
Wait for range reclaim before entry confirmation
Bullish target: 1.618 Fib extension = $3.0463
Stop-loss: Below recent swing low (~$0.53)
Risk-to-reward: Highly favorable upon breakout confirmation
⚠️ Note: Wait for price to reclaim and close above the range before confirming the long setup — otherwise, the structure could still be part of an extended correction.

ONDOUSDT — Demand Zone Retest Before the Next Big Trend?ONDOUSDT is heading toward one of the most important demand zones in its entire price history — 0.26–0.21, the very area where the previous macro rally was born.
This zone is not just support; it represents institutional accumulation, a level where smart money previously stepped in with size.
The 4D market structure has been printing lower highs and lower lows, showing sustained weakness. Yet as long as the 0.26–0.21 demand zone remains intact, the probability of a macro reversal is still on the table.
A long downside wick in the past indicates a liquidity sweep, not a true breakdown — a common signature before a new structural turn.
Now, ONDO is preparing to retest this key area, setting up a make-or-break moment for the next major trend.
---
Bullish Scenario — Reversal from the Demand Origin
If ONDO taps into the 0.26–0.21 zone and shows strong bullish reaction, this could trigger a significant recovery.
Bullish signals to watch:
Strong rejection (pin bar / long tail) or bullish engulfing candle on 4D
Increasing buy volume
Break of the nearest lower-high → formation of a new higher-high
Upside targets:
Target 1: 0.65
Target 2: 0.90
Target 3: 1.20 if momentum extends
A bounce from this zone could mark the first major reversal since the 2024 top.
---
Bearish Scenario — Breakdown of the Final Support
If the price closes below 0.21 on the 4D timeframe, the demand zone loses its strength, confirming a structural breakdown.
If breakdown confirmed:
Expect volatility to spike
Retest of 0.21 turning into resistance is likely
Bearish continuation becomes dominant
Downside targets:
0.15
0.10
0.08 (old liquidity region)
A breakdown opens the door to a deeper correction phase.
---
Pattern Explanation
We already saw a liquidity sweep — an early sign of accumulation or stop-hunt.
Price is drifting slow and steady toward the origin demand.
If buyers defend this zone, the structure can form a Reversal Base Pattern, often leading into a strong bounce.
---
ONDO is approaching the most decisive zone of the year.
The 0.26–0.21 demand area will determine whether ONDO prints a macro rebound or enters its next major bearish leg.
The next reaction from this zone is likely to be explosive.
---
#ONDO #ONDOUSDT #CryptoAnalysis #DemandZone #PriceAction #MarketStructure #Altcoins #CryptoTA

Long trade
🟦 TRADE SUMMARY
Pair: ONDOUSDT.P
Trade Type: Buyside Trade
Date: Sun 23rd Nov 25
Time: 2:00 pm
Session: NY Session PM
Timeframe: 1H
🟩 TRADE PARAMETERS
Entry: 0.4788
Profit Level: 0.5291 (+10.50%)
Stop Level: 0.4726 (–1.29%)
Risk-to-Reward: 8.11 R
🟨 MARKET CONTEXT & STRUCTURE
ONDO printed a multi-session liquidation leg, clearing sell-side liquidity down into the 0.45–0.46 zone. A double bottom + liquidity grab confirmed the exhaustion of sellers. Lower timeframes printed a 2-hour BOS, followed by an H1 BOS just before the NY PM expansion.
EMAs are beginning to realign:
50 EMA curling upwards
200 EMA flattening
We assume this signals a transition from bearish order flow → accumulation → early markup.
🟫 WYCKOFF ALIGNMENT
Phase ONDO Price Behaviour
Phase A Selling climax followed by AR
Phase B Long consolidation + internal sweeps
Phase C Spring (double bottom + liquidity grab)
Phase D Rally + BOS (your entry confirmation)
Phase E Markup toward premium levels
🟩 VOLUME & CONFIRMATION
Volume spikes appear on impulsive bullish candles, especially at BOS points.
Retracements into OB/FVG zones show volume compression, signalling:
Absorption
Programmatic accumulation
No active distribution

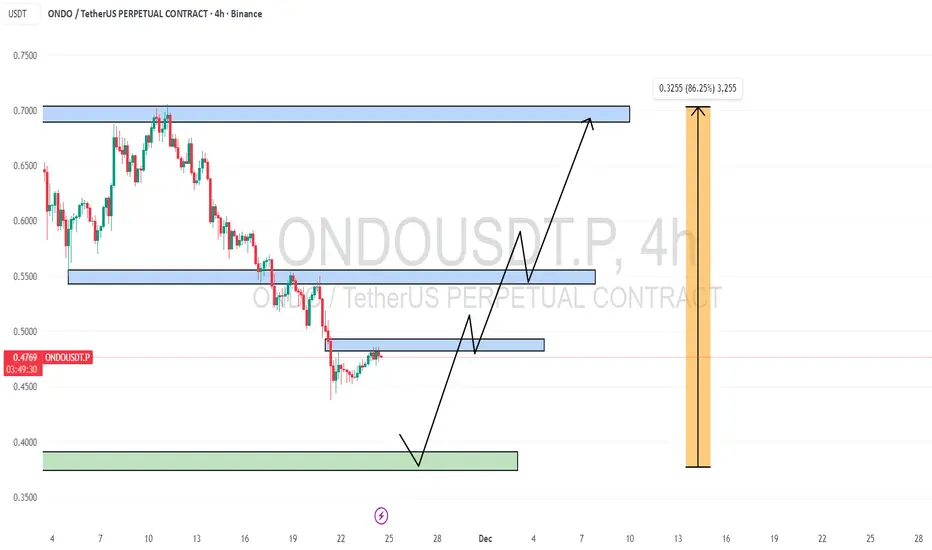
$ONDO 4H CHART UPDATE 📌 LSE:ONDO is bullish on the smaller time frames, but it is showing a bearish trend on the 4H CHART✅
📌A bullish reversal can be expected from the support zone below ✅
📌If that happens, the price can go back to 0.5$+, 0.7$+ 🔥
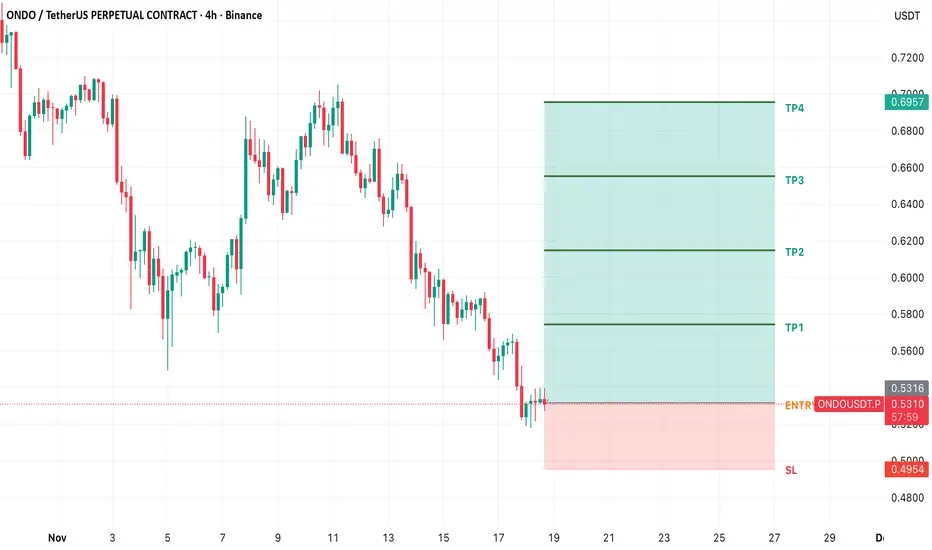
ONDO USDT LONG TRADE SETUPONDO-USDT
LONG
Entry: 0.5320 or CMP
Target: TP1: 0.5743, TP2: 0.6148, TP3: 0.6552, TP4: 0.6957
Stoploss: 0.4954
Leverage: 1X
Technical Analysis: ONDO was facing strong selling pressure, but now it is taking support. Its RSI is also below 20, which indicates extremely oversold conditions. So there is a high chance of a bounce-back.
ONDOLSE:ONDO is trading nicely inside a descending wedge pattern, and I’m expecting a breakout within the next 100 days. The structure points to a potential gain of more than 200 percent once momentum kicks in and resistance breaks. This setup looks primed for a strong move.

ONDO USDT LONG SIGNAL---
📢 Trade Idea: ONDO / USDT
Type: Long
Entry: 0.6608
🎯 Take-Profit Targets (Partial Exits):
• TP1 = 0.6726
• TP2 = 0.6860
• TP3 = 0.7030
🛑 Stop-Loss: 0.6445
⏱ Timeframe: 1H
⚖️ Risk/Reward Ratio: 2.73
💥 Suggested Leverage: 5x – 10x
---
🧠 Technical Analysis Summary:
ONDO is showing a bullish rebound pattern from the 0.64–0.65 support zone, indicating renewed buyer interest.
The price has broken above EMA20 on the 1H chart, and RSI has turned upward from the midline, confirming early bullish momentum.
If the price sustains above 0.66, continuation toward the 0.70 zone is likely, which aligns with the next resistance level.
---
⚙️ Trade Management Tips:
• Take partial profit at TP1 and move SL to entry once reached.
• Use a trailing stop for TP2–TP3 to lock in profits.
• Avoid re-entry if the price closes below 0.645.
---
⚠️ Disclaimer:
This analysis is for educational purposes only and not financial advice.
Always do your own research (DYOR) and use proper risk management.
---
📌 Hashtags for TradingView:
#ONDOUSDT #CryptoSignal #CryptoTrading #TradingViewIdeas #Altcoins #TechnicalAnalysis #FuturesTrading #CryptoSetup
---

Long trade
30min TF
📘 Trade Journal Entry
Pair: ONDOUSDT.P
Date: Sun 9th Nov 2025
Session: Tokyo → London AM
Direction: Buy-side Trade
Timeframe: 30 minutes
🔹 Trade Details
Entry: 0.6526
Take Profit (TP): 0.7791 (+19.97 %)
Stop Loss (SL): 0.6409 (–1.84 %)
Risk / Reward (RR): 14.74 R
🔹 Market Context
The market had completed a multi-week distribution phase from the 0.95 – 0.85 region before entering a deep markdown.
🧾Support levels confirmed at 0.6177 and 0.5955, with price reacting impulsively from this demand zone.
🧾The Order Block at 0.64–0.65 aligns with a discount zone within the overall range (0.75–1.00), forming a high-probability re-accumulation base.
🧾KAMA (Adaptive MA) flattening and beginning to curl upward — signalling momentum shift.
🧾Volume profile shows capitulation flush followed by absorption, typical of a Selling Climax Automatic Rally → Secondary Test transition.
15min TF overview
🔹 Model Type
Accumulation → Breaker Block → FVG Continuation Model
Accumulation occurred after the final markdown sweep; the price broke the structure upward, confirming the intent. Subsequent pullback into the Order Block confluence zone provided the entry trigger at 0.6526. The setup aims for continuation toward the premium inefficiency zone, located near 0.78–0.80.
🔹 Execution Notes
Entry refined within discount range (0.65–0.64) following low-volume retrace into structural support. Stop placed below the most recent Secondary Test wick (0.6409). Target projected at the upper FVG region overlapping the prior distribution midpoint. Confluence factors: OB alignment + Fib 0.618 retracement + KAMA reversal slope + session overlap liquidity injection.
🔹 Trade Narrative
This ONDO setup presents a shift from redistribution to early markup.
After weeks of compression and markdown, ONDO formed a structural low and reclaimed the prior order-block zone. The break of structure confirmed bullish intent, while the entry at the retest captured the transition from accumulation to markup. Target zones align with unmitigated inefficiencies and liquidity above 0.78, offering a strong 14 R+ reward potential under controlled risk.

ONDOMy stop loss triggered for LSE:ONDO , so I’ve reevaluated the setup and plan to reenter around the $0.45–$0.50 region. If momentum builds from there, the structure offers a potential 210% upside move. Watching closely for confirmation before reentering.

ONDOI really like the LSE:ONDO setup here. Price has reclaimed key levels and structure looks bullish. Within the next 70 days, this setup has the potential to deliver around 95% in gains. Momentum is building and the chart suggests continuation is likely.

ANDO USDT LONG SIGNAL---
📢 Signal Alert
🔹 Pair: ONDO / USDT
📈 Trade Type: Long
💰 Entry Zone: 0.7031
🎯 Targets (Take Profits):
▫️ TP1 = 0.7144
▫️ TP2 = 0.7228
▫️ TP3 = 0.7331
🛑 Stop-Loss: 0.6870
📊 Timeframe: 1H
⚖️ Risk/Reward Ratio: 3.8
📌 Suggested Leverage: 5x–10x
---
🧠 Technical Analysis Explanation
ONDO is showing bullish structure continuation after a successful retest of the 0.687–0.690 demand zone, where price previously found strong buying pressure.
Currently, the market has formed a higher low, indicating strength in the ongoing uptrend. The EMA 50 is acting as dynamic support, and the RSI has bounced from the midline (50), confirming renewed bullish momentum.
The entry point at 0.7031 is positioned near the retest of a local breakout area, offering an optimal risk/reward setup.
Take-profit targets are placed at short-term resistance levels based on recent price action and volume profile nodes.
The stop-loss at 0.6870 is safely below the last swing low — protecting against a false dip before continuation.
⚠️ Note: Wait for a bullish confirmation candle (such as a strong 1H engulfing or hammer) before entering. Always manage your risk and secure partial profits as targets are reached.
---
🔸 After TP1 is reached, move stop-loss to entry level to secure your position.

$ONDO (12-HOUR): WYCKOFF DISTRIBUTION again, at SUPPORTI'm stuck with my LSE:ONDO spot bag ($0.907 entry) that I bought on 10/10 before Trump stirred up some serious crap with CHINA.
I will EXIT below the $0.666 SUPPORT (DOUBLE BOTTOM for now), as the price has been stuck in a range between 66.6c and 78.2c, forming a RECTANGLE — a BREAKDOWN below would have a measured target around 55c.
A breakout above $0.782 would target 90c.
This whole 12-HOUR chart (and the DAILY too) simply looks like just another WYCKOFF DISTRIBUTION schematic, unfortunately.
A lot of BEAR RSI divergences recently — a REGULAR one followed by three HIDDEN ones. The momentum has been awful for 7 weeks in a row, just a solid DOWNTREND.
A lot of positive news — the BIST:LINK one, the #RWA push by Larry FINK, etc... No reflection on the charts. All I see is distribution, lower and lower without any serious buyers stepping in.
It's a BEAR MARKET coin, and below $0.666 it could fall like a stone, imo. I will update when it breaks out of this range. My STOP LOSS at $0.65.
👽💙
#blackrock

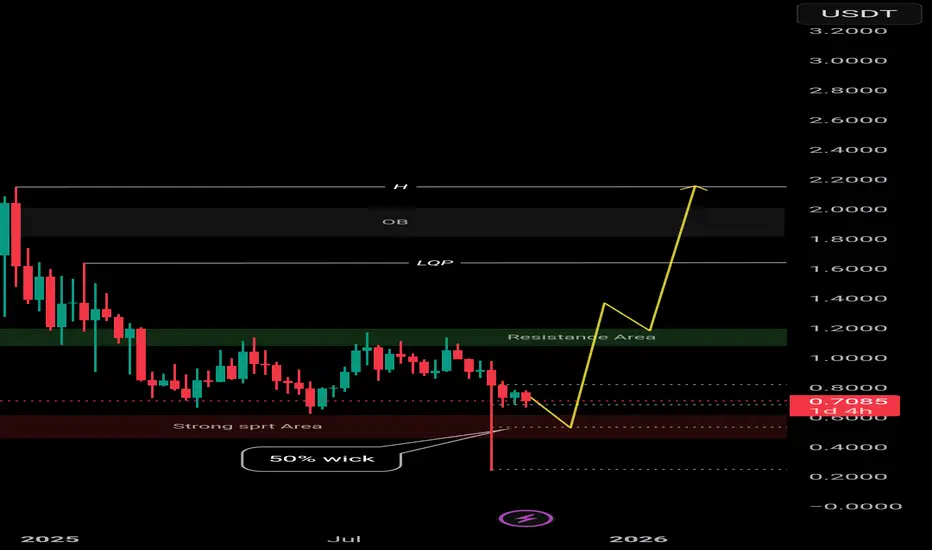
$ONDO 𝗪𝗲𝗲𝗸𝗹𝘆 𝗪𝗮𝘁𝗰𝗵 – $𝟮 𝗧𝗮𝗿𝗴𝗲𝘁 𝗜𝗻𝗰𝗼𝗺𝗶𝗻
LSE:ONDO is pulling back into a well-tested support zone on the weekly chart after multiple rejections from the mid-range supply block. Price is hovering just above support — a level that has held strong several times before.
If buyers step back in, a rebound to $1.10 – $1.25 is very possible. But a break below could see LSE:ONDO sliding deeper into the next demand region before any meaningful recovery.
📈 Trade Plan:
🟢 Entry: $0.70 & $0.55 (50% wick)
🎯 Targets: $1.10 → $1.40 → $1.70 → $2.00
🔴 Support: $0.2
This is a critical weekly reaction zone — next candles will reveal whether bulls or bears take control. Eyes on ondo
ONDOLSE:ONDO is showing strong structure and momentum buildup, setting up for a clean move. I’m expecting around an 80% gain within the next 75 days as it pushes toward the next resistance zone. Solid short to mid-term setup forming here.

ONDO/USDT — At Golden Zone: Major Rebound or Complete Breakdown?ONDO is now sitting at its most critical structural level of 2025 — the golden demand zone between 0.735 and 0.62 USDT.
This area has historically acted as the foundation for every major bullish rally. Each time price tapped this zone, strong accumulation followed.
But this time, things look different — the chart reveals a persistent sequence of lower highs, signaling weakening momentum, while the latest deep wick indicates a liquidity grab — a classic sign that large players might be accumulating or offloading positions before a major move.
The key question now:
> Will this zone become the launchpad for another major rally, or the final floor before a deep collapse?
---
Market Structure & Price Pattern
Primary Range: ONDO has been ranging broadly between 0.62 – 2.10 since mid-2024, with a steady bearish compression forming through lower highs.
Demand Zone (Yellow Block): 0.735 – 0.62 remains a strong historical accumulation area. Rejection or bullish confirmation here could trigger a macro reversal.
Liquidity Sweep: The long downside wick suggests liquidity has been collected — often preceding a sharp move in the opposite direction.
---
Bullish Scenario — Reversal from the Golden Zone
Confirmation Conditions:
A 4-day candle close above 0.735, or a strong bullish rejection candle within the zone.
Increasing volume with follow-through momentum.
Upside Targets:
TP1: 0.8665 — local resistance
TP2: 1.10 — mid-range resistance
TP3: 1.44 – 1.96 — macro distribution zone
If price forms a higher low above 0.735 after rejection, ONDO could enter a re-accumulation phase targeting mid-range resistance.
Stop Loss: Below 0.60 to avoid being trapped by liquidity spikes.
---
Bearish Scenario — Breakdown from Structural Base
Confirmation Conditions:
4D candle closes below 0.62 with strong selling pressure.
Failed retest of 0.62–0.70 (support turns resistance).
Downside Targets:
TP1: 0.50 — minor liquidity zone
TP2: 0.40 — structural support
TP3: 0.25 — full capitulation extension
A confirmed break below 0.62 would mean ONDO’s macro structure has fully collapsed, indicating the start of a prolonged bearish phase.
---
Strategic Summary
The 0.735 – 0.62 zone is ONDO’s line of survival.
As long as price holds or rejects strongly from this area, a macro reversal remains possible.
But a confirmed breakdown below it could lead to a full structural reset toward 0.40 or even 0.25.
> Simply put: this is ONDO’s “make or break” moment —
Either the base for a strong comeback, or the beginning of a deeper decline.
---
Trading Approach
Wait for 4D confirmation before entering any position.
Conservative entries near 0.63–0.68 with SL below 0.60.
Increase position size only after confirmed structure reversal.
Manage risk strictly — volatility in this zone is high and unpredictable.
#ONDO #ONDOUSDT #CryptoAnalysis #PriceAction #SwingTrade #DemandZone #SupportAndResistance #CryptoChart #LiquiditySweep #CryptoTechnical #4DChart #SmartMoneyConcept #CryptoMarket #ReversalSetup

ONDOUSDT 2D#ONDO is moving inside a descending triangle on the 2-day timeframe chart and has recently bounced off the triangle support. The short-term target is:
🎯 $0.8621
In case of a breakout above the triangle resistance, the potential targets are:
🎯 $0.9660
🎯 $1.0500
🎯 $1.1340
🎯 $1.2535
🎯 $1.4058
⚠️ Always remember to use a tight stop-loss and maintain proper risk management.

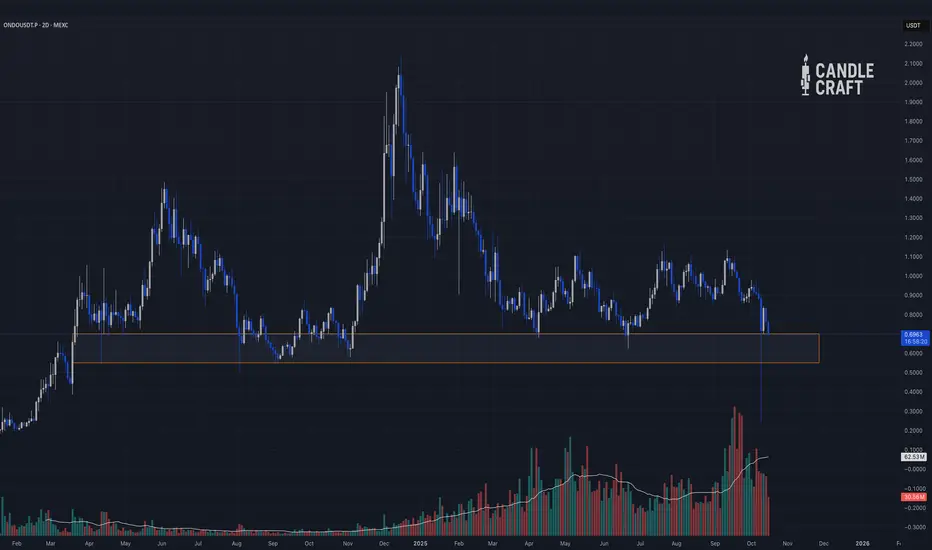
ONDOUSDT — Wolves Don’t Panic, They AccumulateThe crowd calls it “dumping.”
We call it redistribution before ignition.
ONDO has just plunged into the orange accumulation box — a zone that’s seen every capitulation, every fakeout, every final shake before trend reversals. The kind of place where retail gets scared… and the wolves quietly fill their bags.
Volume is surging while price is drilling into historical support.
That’s not weakness — that’s transfer of ownership.
If ONDO dips lower, good. It’s liquidity, not loss. This zone — and even slightly below it — is where smart money enters, not exits.
Our plan is simple:
🎯 Accumulate between 0.555–0.70 USDT.
🕐 Hold through December–January.
The rotation cycle is setting up — and those who hold through the boredom will catch the reward phase.
Every market writes the same story: capitulation → silence → disbelief → expansion.
We’re now in the silence part.
Time to listen closely.
Candle Craft | Signal. Structure. Execution.
ONDO Looks Bearish (12H)At the top, we have a hunt followed by a bearish CH, and then the formation of a neutral range, which represents our distribution phase.
The price is near a resistance zone and has been rejected; therefore, it is expected to move toward our downside targets soon.
The targets are marked on the chart.
A daily candle closing above the invalidation level will invalidate this analysis.
For risk management, please don't forget stop loss and capital management
When we reach the first target, save some profit and then change the stop to entry
Comment if you have any questions
Thank You

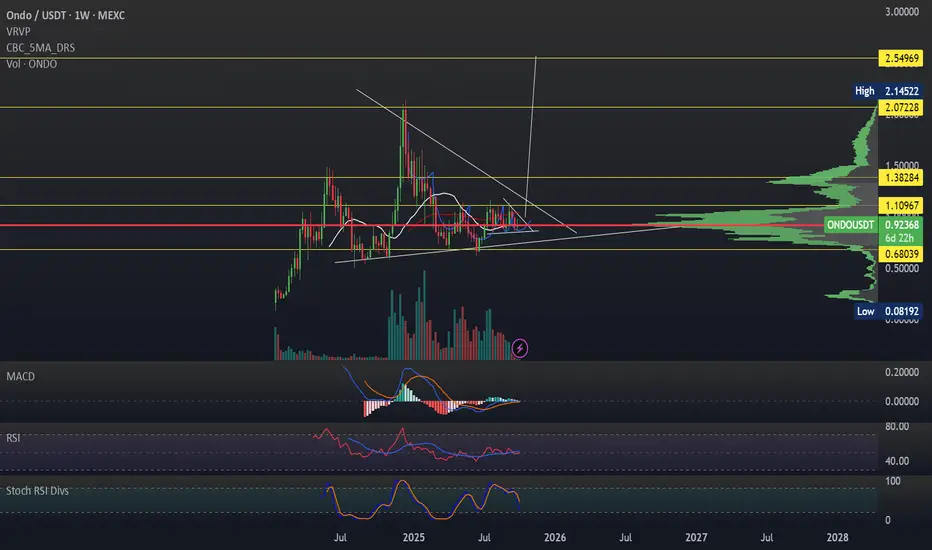
long on ONDOUSDT OKAY this asset is very boring first off, but a safer investment in my honest opinion, with a descent amount in it I'm hold maybe a 8 or 9k bag at around the current price.. average is in the 92 cent range slightly in profit
1. i see a sloppy inverse head and shoulder over the years i have noticed i do great with higher time frames and letting it cook.
2. volume on the weekly time frame is losing selling pressure that is a bullish sign
3. i do not like how the rise is turning down on the weekly but on the other time frames like the 3 and 4 day they are about to start turning up.
4. my target is 2.54 which is a 180% percent gains could be a stretch but that is the algorithmic move from the length of the bull with how the market is going at the moment i am not stressed on this trade excited for my 3x on my money
trade safely my firends lets get this bag trading my way to million dollars liquid.... lets send this up in to the right...
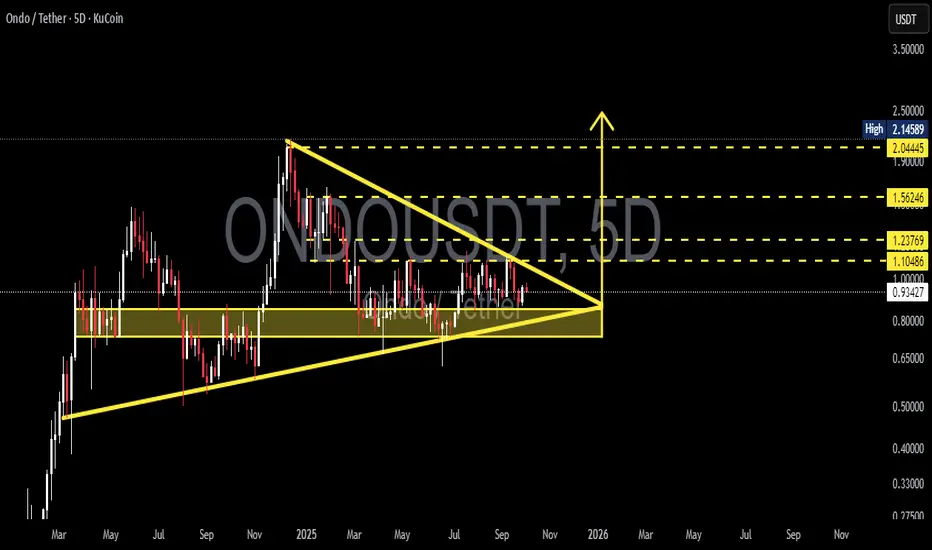
ONDO/USDT — Symmetrical Triangle: Breakout or Breakdown Ahead?🔎 Overview
ONDO is currently trading inside a large consolidation phase after rallying to a peak around $2.14 earlier this year. Price action has now formed a symmetrical triangle pattern, compressing between lower highs and higher lows, right at the critical support zone of $0.80–1.00.
This setup signals that the market is building up pressure — and the next breakout or breakdown will likely dictate the mid-term direction.
---
🏛️ Key Technical Levels
Current Price: ~$0.93
Major Support Zone: $0.80 – $1.00
Upside Targets (if breakout occurs):
$1.10 → breakout trigger level
$1.24 → first resistance target
$1.56 → secondary target
$2.04 – $2.15 → major target, previous swing high
Downside Levels (if breakdown occurs):
$0.65 → minor support
$0.50 → psychological support
$0.33 → next historical support
---
📐 Pattern Explanation
Symmetrical Triangle → formed by lower highs and higher lows converging into an apex.
Indicates price compression and a potential big move ahead.
Directional bias: Often acts as a continuation pattern (favoring bullish trend continuation), but confirmation is essential.
---
🚀 Bullish Scenario
1. Confirmation: A 5D close above the upper trendline and >$1.10 with strong volume.
2. Aggressive entry: Enter on breakout above $1.10.
3. Conservative entry: Wait for a successful retest around $1.00–$1.10 zone.
4. Upside Targets:
TP1: $1.24
TP2: $1.56
TP3: $2.04 – $2.15
5. Stop-loss: Below the breakout zone → around $0.90–0.95, or safer below $0.80.
---
🐻 Bearish Scenario
1. Confirmation: A strong 5D close below $0.80 support zone with volume.
2. Entry: Short/exit longs after breakdown or on failed retest back to $0.80.
3. Downside Targets:
TP1: $0.65
TP2: $0.50
TP3: $0.33
4. Stop-loss (for shorts): Above $0.85–0.90.
---
⚠️ Key Points to Watch
Volume spike is crucial for validating breakout/breakdown.
Retest confirmation: Breakouts are stronger if retests hold.
False breakouts are common in triangle patterns — use higher timeframe confirmation (5D or weekly).
Risk management: Position sizing and R:R ratio are critical; avoid overexposure.
---
📝 Conclusion
ONDO is at a critical decision point within a large symmetrical triangle.
Bullish breakout above $1.10 could open the path toward $1.24 → $1.56 → $2.04–2.15.
Bearish breakdown below $0.80 may trigger downside toward $0.65, $0.50, and $0.33.
With price nearing the triangle apex, volatility expansion is almost guaranteed — traders should prepare for a major move in either direction.
---
#ONDO #ONDOUSDT #Crypto #Altcoin #TechnicalAnalysis #TrianglePattern #Breakout #BullishScenario #BearishScenario
Ondo doing ondo thingslast days i shared here about ondo chart, search and look into entry, it will be worth play

ONDO market snapshotONDO’s $0.90 level is getting more interesting. The price managed to break out and hold above it, but a retest of this support level could very likely lead to a breakdown. The profit potential looks attractive, as the next support is around $0.65.
For now, I’m just watching and waiting for an entry point if we see a pullback below $0.94
