DXY :Signs of weakness towards support at 95, even 91DXY:
Signs of weakness towards support at 95, even 91 are gradually becoming evident.
With this scenario, it will be a bad scenario for gold, gold will increase in price to other very high levels.
Trade ideas
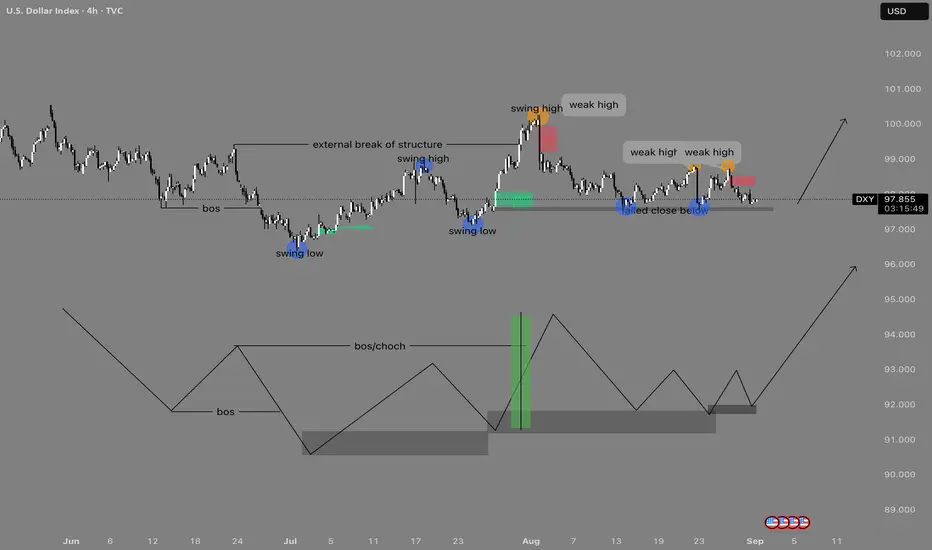
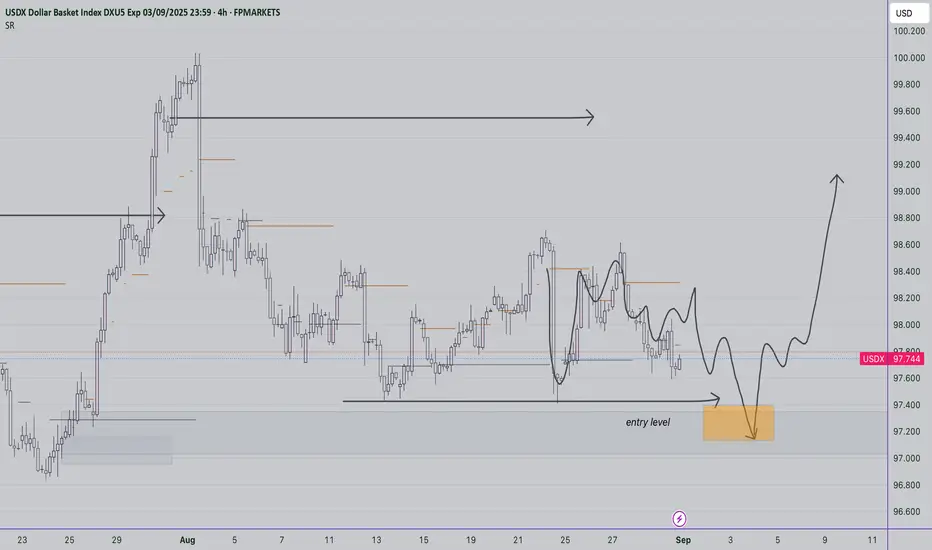
DXY Bullish Structure Outlook – September 2025Description:
This chart highlights a bullish idea on the Dollar Index (DXY), with structure and liquidity concepts driving the outlook.
Swing Structure:
Price formed a major swing low after a clear BOS (break of structure) to the downside. From there, buyers stepped in, creating a new swing high and pushing into an external BOS, confirming higher-timeframe strength.
Weak Highs & Liquidity Pools:
Multiple weak highs (highlighted in orange) remain unprotected and serve as liquidity targets. These highs are unlikely to hold, suggesting the market will eventually raid them as it seeks upside continuation.
Demand Zones & Failed Close:
Despite temporary sell-offs, the market failed to close below key support (annotated near 97.80–97.00), showing absorption of selling pressure. Fair Value Gaps (FVGs) also act as areas of re-accumulation where buyers can step back in.
Schematic Alignment:
The lower schematic illustrates the anticipated accumulation process: a BOS/CHOCH leading into demand mitigation, followed by higher-lows being built and a final expansion phase. This aligns with the live chart, projecting a bullish run once the corrective phase completes.
Outlook:
As long as price respects the current demand zone, DXY is positioned for continuation to the upside, with liquidity objectives above 99.00 and potentially 100+. A deeper retracement toward 96.00–95.00 would still fit the bullish accumulation model and provide an additional long opportunity.
DXYThe US Dollar Index (DXY) is a financial index that measures the value of the United States dollar relative to a basket of six major foreign currencies. It is widely used to gauge the overall strength or weakness of the US dollar in global currency markets.
DOLLAR index on weekly trendline ,the fed rate decision is expected for forward guidance .
#dxy

Forex Weekly Review: Fundamental analysis. USD to weaken? The week starting Monday 25 August ended where it began, with roughly an 85% likelihood of a September FED rate cut.
There was a lot of external noise in-between. But all the while, the currencies 'movement' remained fairly muted.
Given the reaction to chair Powell's speech the previous Friday, I was quite surprised by the USD strength on Monday.
Throughout the week, we did get a few 'events', namely Mr Trump 'firing' FED member cook, whilst simultaneously stirring the tariff pot. The firing of COOK is an interesting one as it brings into question the FED's independence and is a scenario that could rumble on for a while. We also got 'discouraging' forward guidance from NVIDEA. On another week, all of these narratives would have 'likely' spurred 'sour sentiment'. But any moves were muted, which I put down to many traders being away on 'summer breaks', the fact the VIX hovered around 15 all week (despite the negativity) backs up this theory.
In other news, we did a bit of 'action,' on Monday when political uncertainty in France weakened the EUR. And on Friday 'in line with expectations' US PCE data (eventually) weakened the USD. The theory being inflation is still benign enough for the FED to cut rates in September.
Finally, 'soft' CAD GDP data keeps a BOC September rate cut firmly on the table.
On a personal note, I only really perceived two opportunities all week, the EUR weakness on Monday (which I didn't trade) and the USD opportunity on Friday (GBP USD long). Although that was a tricky one because the dollar did initially strengthen on the headline. We only saw the 'true reaction' once the US market opened.
Throughout the week, I did find myself a little frustrated with the lack of my perceived opportunities over the last few weeks, I'm very intrigued to see if volume picks up once 'institutional traders' return to their desks.
I begin the new week with my 'risk on' bias in tact (particularly following weekend news of a supreme court tariff ruling). But I suspect the narrative surrounding the US jobs market could play a big role this week.
Results:
Trade 1: GBP USD +1.2
Total = +1.2%

DOLLAR INDEX CURRENCY We will be looking for bullish opportunities as the market its on an EQL Zone Resulting possible buying opportunities, the dollar will be strong |1H TIMEFRAME

US Dollar: A Bit Lower Before Moving Higher? Happy September!Welcome back to the Weekly Forex Forecast for the week of Sept. 1 - 5th.
In this video, we will analyze the following FX market: USD Dollar
The USD is more bearish than bullish. Yes. However, it is still in correction territory. That is to say, it could potentially move higher from current levels. It is in consolidation, ranging here for weeks. Sept may bring the volume to move price out of the summer range. Let's be prepared for it!
React and do not predict.
Enjoy!
May profits be upon you.
Leave any questions or comments in the comment section.
I appreciate any feedback from my viewers!
Disclaimer:
I do not provide personal investment advice and I am not a qualified licensed investment advisor.
All information found here, including any ideas, opinions, views, predictions, forecasts, commentaries, suggestions, expressed or implied herein, are for informational, entertainment or educational purposes only and should not be construed as personal investment advice. While the information provided is believed to be accurate, it may include errors or inaccuracies.
I will not and cannot be held liable for any actions you take as a result of anything you read here.
Conduct your own due diligence, or consult a licensed financial advisor or broker before making any and all investment decisions. Any investments, trades, speculations, or decisions made on the basis of any information found on this channel, expressed or implied herein, are committed at your own risk, financial or otherwise.

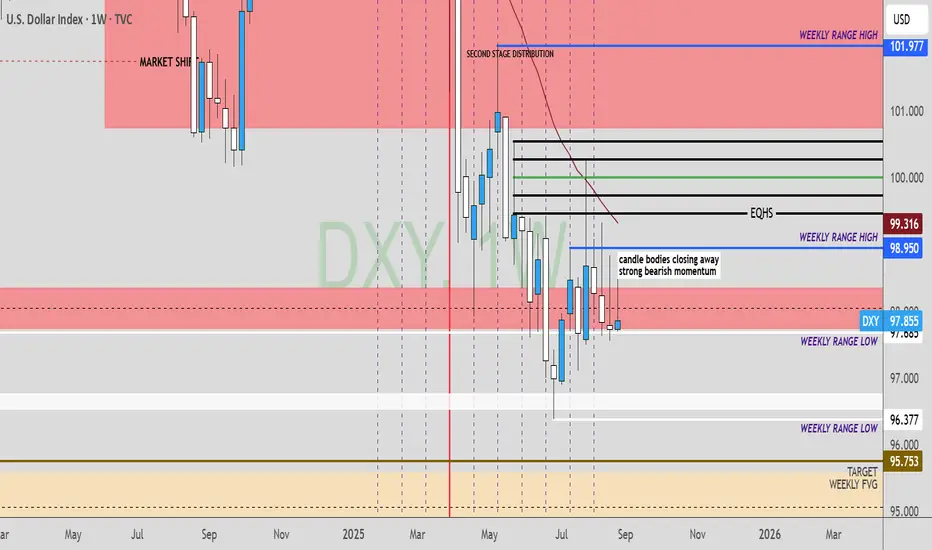
DXY Outlook – Bearish Lean, Choppy SetupDollar had a hard run the last three weeks with heavy bearish candles on the weekly. Price action has been messy, not easy to just get in and ride. My bias is still bearish, but I’m also looking at the bigger picture.
On the monthly chart, key distribution sits under 94.095 and we haven’t reached it yet. Over the last two months price has been filling the bullish order block around 95.971 order block on the dollar index. If the market maker decides to move, it could go fast once the data lines up, whether in the first or second week.
Right now we are sitting in a bearish volume channel lower end. Selling late is not smart because most of the move has already passed. That doesn’t mean there are no trades, but it does mean higher frequency and tighter risk until the next clear setup.
From the economic side the jobs data is weak with only 73K added last month, which keeps pressure on the Fed to cut. The Fed is also seen as politicized, which hurts credibility and weighs on the dollar. Markets are already pricing a September cut and analysts are leaning bearish. At the same time inflation is still sticky near 2.9 percent while jobs are slowing, which leaves the Fed boxed in. Headline PCE is flat, not strong enough to flip hawkish and not weak enough to go fully dovish. That mix can trap the dollar between 97 and 100 until one side breaks.
Best move is to keep watching the data closely before trading dollar markets. Bias stays bearish, but chop risk is high.

DXYDXY is heading towards the critical zone as highlighted for buys or further sells from the box.
Disclosure: We are part of Trade Nation's Influencer program and receive a monthly fee for using their TradingView charts in our analysis.

DXY Dollar Index: Technical Analysis & Trading Strategy Forecast# DXY Dollar Index: Comprehensive Technical Analysis & Trading Strategy Forecast
Asset Class: US Dollar Index (DXY)
Current Price: 97.855 (as of August 30, 2025, 12:59 AM UTC+4)
Analysis Date: August 31, 2025
Market Context: Post-correction consolidation phase with emerging bullish momentum
Executive Summary
The Dollar Index (DXY) is currently trading at 97.855, showing signs of stabilization after a significant decline from yearly highs. Our multi-dimensional technical analysis reveals a critical juncture where multiple timeframes converge, presenting both intraday scalping opportunities and swing trading setups. The analysis incorporates advanced pattern recognition, wave theory, and momentum indicators to provide actionable trading insights.
Current Market Landscape
The DXY exchange rate rose to 97.8549 on August 29, 2025, up 0.04% from the previous session, indicating short-term stabilization. However, over the past month, the United States Dollar has weakened 1.96%, and is down by 3.81% over the last 12 months. This presents a complex technical picture where short-term bullish momentum may be developing within a broader corrective phase.
The DXY Dollar Index Futures kicked off the new week with a strong bullish candle, signaling renewed upward momentum, supported by non-commercial traders reducing their bearish bets according to recent COT data.
Multi-Timeframe Technical Analysis
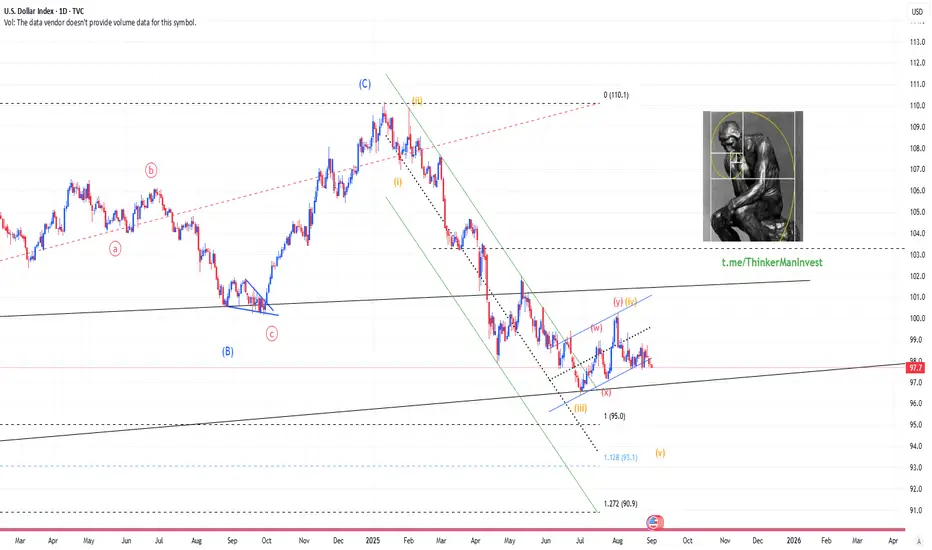
Elliott Wave Theory Analysis
Based on recent Elliott Wave patterns, the descent from the May 29, 2025 high is currently unfolding as a five-wave impulse Elliott Wave pattern. From this high, wave ((i)) concluded at 98.35, followed by a corrective rally in wave ((ii)). The rally formed as an expanded flat, peaking at 99.43.
Wave Count Structure:
Primary Wave: Currently in corrective Wave 4 of larger degree cycle
Intermediate Count: Completing 5-wave decline from 2025 highs
Near-term: Potential Wave 5 completion around 96.50-97.00 zone
Elliott Wave Targets:
Immediate Support: 96.80-97.00 (Wave equality zone)
Key Resistance: 99.40-99.80 (Previous Wave ((ii)) high)
Major Resistance: 101.50-102.00 (Fibonacci confluence)
Harmonic Pattern Analysis
Active Patterns:
1. Potential Bullish Bat Pattern forming on 4H-Daily timeframe
- X to A leg: 103.50 to 96.20
- A to B retracement: 38.2% at 98.98
- B to C projection: 88.6% of AB at 97.15
- Completion zone: 96.50-96.80 (88.6% XA retracement)
2. Bearish Gartley Pattern (Completed)
- Generated sell signals at 99.20-99.50 range
- Currently in profit-taking phase
Fibonacci Confluence Zones:
Strong Support: 96.50-96.80 (Multiple harmonic convergence)
Resistance Cluster: 98.80-99.20 (38.2% and 50% retracements)
Major Resistance: 101.20-101.80 (61.8% golden ratio)
Wyckoff Theory Assessment
Current Phase: Potential Accumulation Phase (Spring Test)
Distribution Phase: Completed at 2025 highs (103.50+ region)
Markdown Phase: May-August 2025 decline
Current Position: Testing Spring levels around 96.50-97.50
Wyckoff Signals:
- Volume divergence suggests smart money accumulation
- Price action showing reduced selling pressure
- Potential for markup phase if 98.50 resistance breaks
W.D. Gann Analysis
Gann Square of 9:
- Natural resistance at 98 (perfect square)
- Strong support at 96 (key Gann level)
- Next major target: 100 (psychological and Gann confluence)
Gann Time Theory:
- Current time cycle suggests reversal window: September 3-10, 2025
- Major time square due: October 2025 (90-degree angle)
- Price-Time balance suggests equilibrium around 97.50
Gann Angles:
- 1x1 angle from August lows: 97.20 (active support)
- 2x1 resistance line: 98.60
- 1x2 support angle: 96.40
Ichimoku Kinko Hyo Analysis
Current Cloud Status:
- Price below Tenkan-sen (97.95) - Short-term bearish
- Kijun-sen at 98.40 acting as dynamic resistance
- Cloud (Kumo) resistance: 99.20-99.80
- Future Cloud: Thinning, suggesting volatility ahead
Ichimoku Signals:
- TK Cross: Pending bullish crossover if price holds above 97.50
- Cloud breakout target: 99.80+
- Support levels: Kijun-sen (98.40), Tenkan-sen (97.95)
Technical Indicators Analysis
Relative Strength Index (RSI)
Daily RSI: 42.5 (Oversold but not extreme)
4H RSI: 38.2 (Approaching oversold territory)
1H RSI: 45.8 (Neutral zone)
Divergence Alert: Bullish divergence forming on 4H timeframe
Bollinger Bands (BB)
Current Position: Lower third of bands
Band Width: Contracting (low volatility environment)
Squeeze Setup: Potential breakout within 3-5 trading days
Direction Bias: Slight bullish based on band position
Volume Weighted Average Price (VWAP)
Daily VWAP: 98.12 (resistance)
Weekly VWAP: 98.85 (major resistance)
Monthly VWAP: 99.45 (significant overhead supply)
Moving Averages Confluence
SMA 20: 98.15 (immediate resistance)
EMA 50: 98.75 (intermediate resistance)
SMA 200: 100.20 (major trend line)
Current Status: Below all major MAs (bearish bias)
Candlestick Pattern Recognition
Recent Formations:
1. Doji Star (August 29) - Indecision at support
2. Hammer Pattern (August 30) - Potential reversal signal
3. Bullish Engulfing setup developing
Pattern Implications:
- Short-term reversal signals strengthening
- Volume confirmation needed for validation
- Risk-reward favors long positions with tight stops
Market Structure & Support/Resistance
Key Support Levels:
1. 97.20-97.40 - Immediate support (Gann 1x1 angle)
2. 96.80-97.00 - Major support (Harmonic completion)
3. 96.20-96.50 - Critical support (Previous reaction low)
4. 95.50-95.80 - Ultimate support (2024 major low)
Key Resistance Levels:
1. 98.15-98.40 - Immediate resistance (SMA 20 + Kijun-sen)
2. 98.80-99.20 - Intermediate resistance (Fibonacci + VWAP)
3. 99.40-99.80 - Major resistance (Elliott Wave + Cloud)
4. 101.20-101.80 - Long-term resistance (Multiple confluences)
Trading Strategy & Time Frame Analysis
Intraday Trading Strategy (5M - 4H Charts)
Bullish Scenario (Probability: 60%)
Entry Zone: 97.40-97.60 (on pullback)
Stop Loss: 97.15 (below harmonic completion)
Target 1: 98.15 (Daily SMA 20)
Target 2: 98.60 (Gann 2x1 angle)
Target 3: 99.20 (Fibonacci resistance)
Risk-Reward: 1:2.5
Bearish Scenario (Probability: 40%)
Entry Zone: 98.40-98.60 (on failed breakout)
Stop Loss: 99.00 (above key resistance)
Target 1: 97.60 (immediate support)
Target 2: 96.80 (Harmonic target)
Target 3: 96.20 (Major support)
Risk-Reward: 1:2.8
Swing Trading Strategy (4H - Monthly Charts)
Primary Long Setup:
Accumulation Zone: 96.50-97.50
Confirmation: Break above 98.80 with volume
Swing Target 1: 100.20 (SMA 200)
Swing Target 2: 102.50 (61.8% retracement)
Ultimate Target: 105.00 (2025 high retest)
Stop Loss: Below 96.20
Position Sizing: 2% risk per trade
Time Horizon: 4-8 weeks
Alternative Short Setup:
Entry Condition: Failure at 99.50 resistance
Confirmation: Break below 97.00 support
Target 1: 95.50 (2024 low)
Target 2: 93.80 (Extended projection)
Stop Loss: Above 100.00
Time Horizon: 6-10 weeks
Weekly Trading Plan (September 2-6, 2025)
Monday-Tuesday: Consolidation Expected
Range: 97.20-98.40
Strategy: Range trading, fade extremes
Key Events: Watch for volume expansion
Wednesday-Thursday: Potential Breakout
Catalyst: Economic data releases
Scenarios: Break above 98.60 (bullish) or below 97.00 (bearish)
Strategy: Breakout trading with confirmation
Friday: Trend Continuation
Focus: Weekly close positioning
Strategy: Hold winners, cut losers
Risk Management: Reduce position sizes before weekend
Risk Management Framework
Position Sizing Rules:
Intraday: Maximum 1% risk per trade
Swing: Maximum 2% risk per trade
Portfolio: Total DXY exposure not exceeding 5%
Stop Loss Guidelines:
Intraday: 25-30 pips maximum
Swing: 80-120 pips based on volatility
Time-based: Exit if no progress in 5 trading days
Profit Taking Strategy:
Scale out: 50% at first target, 30% at second, 20% runner
Trailing stops: Implement after 1:1 risk-reward achieved
Weekend rule: Close 70% of intraday positions before Friday close
Market Psychology & Sentiment
Current Sentiment Indicators:
COT Data: Non-commercial traders reducing bearish bets
Options Flow: Put-call ratio normalizing from extreme levels
Technical Sentiment: Oversold conditions with emerging reversal signals
Psychological Levels:
98.00: Round number resistance (psychological barrier)
100.00: Major psychological milestone
95.00: Critical psychological support
External Factors & Market Context
Geopolitical Considerations:
- Federal Reserve policy stance monitoring required
- Global economic data impacts (ECB, BOJ decisions)
- Geopolitical tensions affecting safe-haven demand
Economic Calendar Watch:
- NFP data (First Friday of month)
- Fed speakers and policy minutes
- Inflation data releases
- Global PMI readings
Advanced Pattern Alerts
Bull Trap Warning:
Setup: False break above 99.00 followed by immediate reversal
Confirmation: Heavy volume on break, light volume on decline
Response: Wait for 4H close below 98.20 before shorting
Bear Trap Alert:
Setup: False break below 96.80 with quick recovery
Confirmation: Immediate buying pressure and volume surge
Response: Long entry on return above 97.20 with tight stops
Technology Integration
Automated Alerts Setup:
1. Price Alerts: 96.80, 97.50, 98.60, 99.20
2. RSI Alerts: <30 (oversold), >70 (overbought)
3. Volume Alerts: 150% above 20-day average
4. Pattern Alerts: Harmonic completion, Elliott Wave targets
Trading Platform Integration:
TradingView: Custom indicator stack with all mentioned tools
MT4/MT5: Expert Advisor for automated entries
Risk Management: Position sizing calculators
Conclusion & Forecast Summary
The DXY Dollar Index stands at a critical technical juncture with multiple analytical frameworks suggesting a potential reversal from current levels. The convergence of Elliott Wave completion zones, harmonic pattern targets, and Wyckoff accumulation signals creates a compelling risk-reward setup for both intraday and swing traders.
Primary Scenario (65% probability): Consolidation between 96.80-98.60 followed by breakout to 100.20+ levels over the next 4-6 weeks.
Alternative Scenario (35% probability): Failed recovery leading to extended decline toward 95.50-94.00 zone.
Trading Bias: Cautiously bullish with defensive positioning until confirmation above 98.80 resistance cluster.
Key Success Factors:
- Strict adherence to risk management protocols
- Multiple timeframe confirmation before major position increases
- Continuous monitoring of Federal Reserve policy developments
- Adaptation to changing market structure and volatility conditions
---
*This analysis incorporates advanced technical methodologies including Elliott Wave Theory, Harmonic Patterns, Wyckoff Analysis, Gann Theory, and Ichimoku Kinko Hyo, combined with traditional indicators and market structure analysis. All price targets and support/resistance levels are derived from mathematical relationships and historical price behavior patterns.*
Risk Disclaimer: Past performance is not indicative of future results. All trading involves substantial risk of loss. This analysis is for educational purposes and should not be considered as financial advice. Traders should conduct their own analysis and consider their risk tolerance before making trading decisions.

DXY Possible sell on pullback!Back to back 3 weekly pin bar on DXY with series of lower high's putting pressure on the weekly support level. From the Monthly, it is a long term bear market, after the previous monthly pullback, price started to continue to drop which signals potential new impulse on the monthly. As the monthly close, the price is on the intraday support with potential for initial bounce. As weekly market is creating series of higher low, there is a possibility of 50% pullback and liquidity grab to potentially break the weekly support.

DXYSuccess in the FX, indices, and gold markets comes from discipline, not luck — I win by combining deep market analysis with strict risk management, keeping emotions out of trading, and focusing on long-term consistency rather than quick gains. Every trade is based on research, patience, and clear strategy, allowing me to grow steadily while protecting capital.

Dollar Index: Déjà Vu at the BottomTVC:DXY is testing the bottom of its channel once again. Historically, every touch at these levels has been followed by a rally in the dollar.
If the pattern holds, a rebound here could have meaningful implications for equities, commodities, and crypto.

ALLOCATION IN FAVOR OF FOREIGN CURRENCIESDollar Weakness expected to persist into Q4
Weekly draw towards 95.73
-bullish equities
-bullish us2y
-bullish fx
Trump’s Death Sparks Uncertainty in the DollarWith the news of Trump’s death, the dollar may weaken in the short term – especially if political concerns and instability rise. In the long term, the impact will largely depend on the succession process and policymakers’ response.

DXY directions I would love to see DXY under 96 it has a lot of SSL on those levels, for this week I will aim to the FVG at 1 hour and then look for short positions aim the PML.

Are we in wave 3 currently printing a bearish leading diaognalIs the very shallow bullish correction over and have now entered wave 3. Are we printing a bearish leading diaognal as wave (1) of Wave 3.....Trentline at 1.1730 is critical

DXY Back to Monday Start low after price just comfirmed today our weekly cot that bullish momentum for this week so we can expect more bullish momentum moving forward. As we rejected to break below for change of structure from bullish to bearish.

DXY 4HTrading Outlook for Major Currency Pairs and Indices, Especially Gold and Silver, in the Upcoming Week
In this series of analyses, we have reviewed short-term trading perspectives and market outlooks.
As can be seen, each analysis highlights a key support or resistance area near the current price of the asset. The market’s reaction to or break of these levels will determine the subsequent price trend up to the next specified levels.
Important Note: The purpose of these trading outlooks is to identify key price levels and potential market reactions, and the analyses provided should not be considered as trading signals.

USD/CAD, GBP/USD, EUR/USD Video of my trades last week.My 3rd video explaining my trades for last week 25-29nd August and the week ended with a nice profit of 2.58%.
If you have any questions send me a message here or on X and enjoy the weekend.

DXY WILL GO UP|LONG|
✅DXY fell again to retest
The support of 97.600
But it is a strong key level
So I think that there is a high chance
That we will see a bullish
Rebound and a move up
LONG🚀
✅Like and subscribe to never miss a new idea!✅

idea for us dollarSimple structural follow up D (the general macro trend is short) ; tp at 99.5 to then let's see what he does to us
Possible entry on the zone
Supply + liquidity hunt = breakout failure1.This breakout failed because it lacked consolidation strength and ran directly into a strong supply/FVG zone.
2.Liquidity above the trendline was hunted, trapping breakout buyers.
3.Momentum was weak, with no strong volume or follow-through.
4.The higher timeframe bias was still bearish, limiting upside potential.
Without retest and acceptance above resistance, the move couldn’t sustain.
⚡ Key Points
📝Trendline break without consolidation.
📝Rejection from FVG / supply zone.
📝Liquidity grab above highs.
📝Weak momentum and no follow-through.

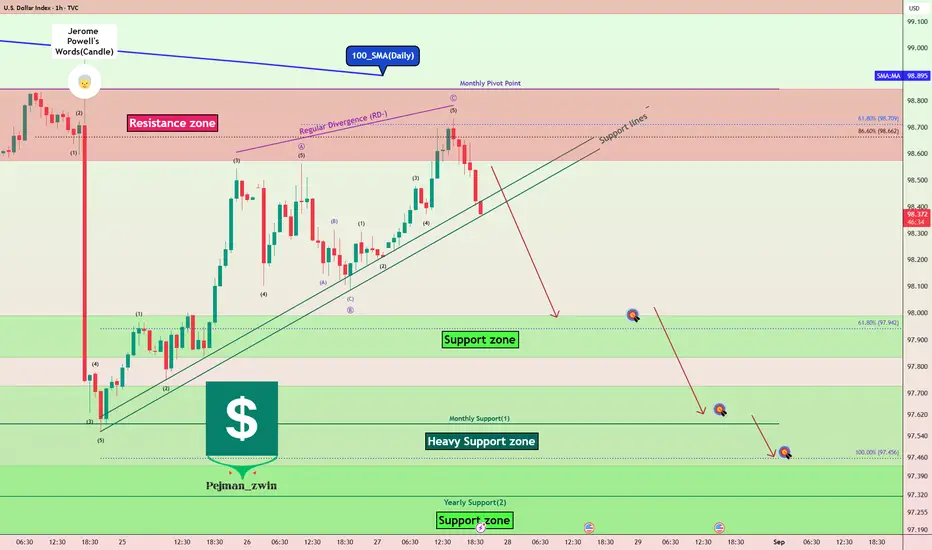
DXY Analysis: Resistances Holding Strong, Is the Downtrend Back?Today, I want to analyze one of the important indices of the financial markets , the U.S. Dollar Index ( TVC:DXY ), for you, which can be a guide for taking short-long positions in the Forex , Futures , and even Crypto markets.
The DXY index fell by about -1.2% after Jerome Powell began talking about the possibility of a rate cut in September , but as the new week began, the DXY index started to rise again.
If we look at the DXY Index chart on the 1-hour time frame , we can see that the DXY Index reacted well to the Resistances and started to decline.
The Resistances for the DXY Index include:
Resistance zone($98.843-$98.575)
Monthly Pivot Point
100_SMA(Daily)
In terms of Elliott Wave theory , it seems that this increase in the DXY Index over the last two days has been in the form of corrective waves . The structure of the corrective waves is Zigzag Correction(ABC/5-3-5). By breaking the Support lines , we can confirm the end of the corrective waves .
Also, we can see the Regular Divergence(RD-) between Consecutive Peaks .
I expect the DXY Index to decline to at least the Support zone($97.989-$97.834) AFTER breaking the Support lines .
Second Target: $97.650
Third Target: $97.450
Stop Loss(SL): $99.000
Note: With the DXY Index declining, we can expect more hope for a weakening of the U.S Dollar's strength in the major Forex pairs .
Please respect each other's ideas and express them politely if you agree or disagree.
U.S. Dollar Index Analyze (DXYUSD), 1-hour time frame.
Be sure to follow the updated ideas.
Do not forget to put a Stop loss for your positions (For every position you want to open).
Please follow your strategy and updates; this is just my Idea, and I will gladly see your ideas in this post.
Please do not forget the ✅' like '✅ button 🙏😊 & Share it with your friends; thanks, and Trade safe.