DXY UpdateDXY — The Volume Cap: Where Momentum Meets Memory
Every market has memory — and in the Dollar Index, it’s sitting right at 97.4.
That’s the current Volume Cap — a zone where heavy participation once stopped price cold, leaving unfinished business behind.
Price loves to revisit these caps, testing whether the imbalance still holds or finally gives way.
⚙️ Context (4H | Friday Recap)
Friday delivered heavy volume and clean directional flow — a textbook session.
DXY continues to rotate within the 97.048–99.198 range, holding a short-term bullish tone inside a larger consolidation.
📊 Technical Map
• Structure: Long-term bearish range inside a broader consolidation phase.
• Momentum: Still bullish, but showing early fatigue.
• Volume Cap: The 97.4 level remains unfilled, acting like a magnet for potential retests — the true battleground between continuation and correction.
🌐 Fundamental Pulse
After a month of running hot, the dollar finally cooled.
Retail Sales and Industrial Production softened, yields eased, and traders started whispering “rate cuts” again.
The Fed’s cautious tone keeps volatility contained ahead of next week’s Core PCE inflation data.
🧭 Trade Plan (If/Then)
If DXY runs through 97.4, watch for a bearish Volume Cap flip — potential downside toward nearby support.
If Monday’s price action drives higher, expect bullish momentum rotation back toward the 97.0 retest region.
Trade ideas

DXY: Strong Growth Ahead! Long!
My dear friends,
Today we will analyse DXY together☺️
The recent price action suggests a shift in mid-term momentum. A break above the current local range around 98.869 will confirm the new direction upwards with the target being the next key level of 98.977 and a reconvened placement of a stop-loss beyond the range.
❤️Sending you lots of Love and Hugs❤️


Bullish bounce?The US Dollar Index (DXY) is falling towards the pivot and could bounce to the 1st resistance, which is a pullback resistance.
Pivot: 97.96
1st Support: 97.49
1st Resistance: 98.77
Disclaimer:
The above opinions given constitute general market commentary, and do not constitute the opinion or advice of IC Markets or any form of personal or investment advice.
Any opinions, news, research, analyses, prices, other information, or links to third-party sites contained on this website are provided on an "as-is" basis, are intended only to be informative, is not an advice nor a recommendation, nor research, or a record of our trading prices, or an offer of, or solicitation for a transaction in any financial instrument and thus should not be treated as such. The information provided does not involve any specific investment objectives, financial situation and needs of any specific person who may receive it. Please be aware, that past performance is not a reliable indicator of future performance and/or results. Past Performance or Forward-looking scenarios based upon the reasonable beliefs of the third-party provider are not a guarantee of future performance. Actual results may differ materially from those anticipated in forward-looking or past performance statements. IC Markets makes no representation or warranty and assumes no liability as to the accuracy or completeness of the information provided, nor any loss arising from any investment based on a recommendation, forecast or any information supplied by any third-party.

USD Rate Cut Rally Continues, DXY Falling Wedge BreakoutI last looked at the build of a falling wedge in the USD in these pieces a couple of weeks ago, as we had a push of higher-highs and lows after the Fed's rate cut announcement.
That theme pushed to fresh highs today as DXY broke out of a falling wedge formation, and while the initial rally in October was very much pushed along by a weak Yen the move today is being prodded by a further breakdown move in EUR/USD.
The next significant test for DXY is just ahead, with the 100 level that's confluent with the swing low from last year at 100.22. This spot is what caught the high back in on August 1st after the post-FOMC breakout then, and that's the price that currently marks the four month high in the currency. Above that, it's the 102 level that caught the high back in May, which is also a Fibonacci level of note. - js

Bullish dollar!Trading at the bottom of the range, if holds we looking hella bullish for DXY holders, if back test fails here still hope depending how that follow through reacts, more info still needed but looking promising

09.10.25 Morning ForecastPairs on Watch -
FX:EURCAD
FX:USDJPY
A short overview of the instruments I am looking at for today, multi-timeframe analysis down to what I will be looking at for an entry. Enjoy!

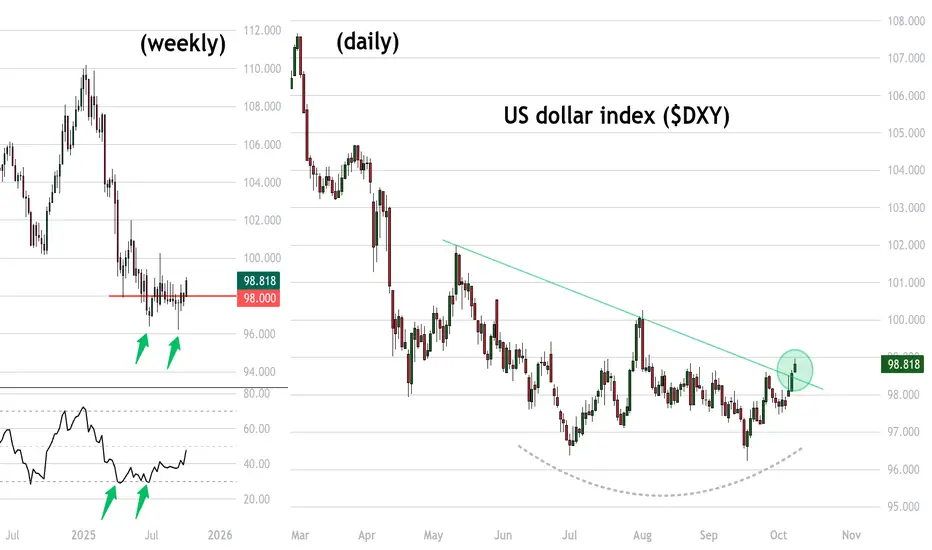
Yes Gold just broke $4K.. but check out the USD (bottom?)Gold is naturally getting all the attention after breaking over $4000 fir the first time
But meanwhile the US dollar looks like its bottoming out.
DXY - the dollar index - not had much interest in breaking below 98
US Dollar: Wait For The +BOS, Then Buy It!Welcome back to the Weekly Forex Forecast for the week of Oct 6 - 10th.
In this video, we will analyze the following FX market: USD Dollar
The USD is technically still bearish, trying to find support for higher prices. A US government shutdown is not helping that case! However, personally, I am still looking toward the upside.
Price is still holding at a bullish discount array, an +OB. As long as the +OB is respected, I am looking for higher prices.
A bearish BOS will make looking for higher prices invalid.
So, let the market show its bias before entering a trade. Look for the confirmations to its direction.
Don't take trades inside the middle of consolidations!
Wait and react. Do not predict.
Enjoy!
May profits be upon you.
Leave any questions or comments in the comment section.
I appreciate any feedback from my viewers!
Disclaimer:
I do not provide personal investment advice and I am not a qualified licensed investment advisor.
All information found here, including any ideas, opinions, views, predictions, forecasts, commentaries, suggestions, expressed or implied herein, are for informational, entertainment or educational purposes only and should not be construed as personal investment advice. While the information provided is believed to be accurate, it may include errors or inaccuracies.
I will not and cannot be held liable for any actions you take as a result of anything you read here.
Conduct your own due diligence, or consult a licensed financial advisor or broker before making any and all investment decisions. Any investments, trades, speculations, or decisions made on the basis of any information found on this channel, expressed or implied herein, are committed at your own risk, financial or otherwise.

Bearish continuation setup?The US Dollar Index (DXY) is rising towards the pivot, which is a pullback resistance that lines up with the 61.8% Fibonacci retracement and could reverse to the 1st support.
Pivot: 98.64
1st Support: 96.64
1st Resistance: 100.20
Disclaimer:
The above opinions given constitute general market commentary, and do not constitute the opinion or advice of IC Markets or any form of personal or investment advice.
Any opinions, news, research, analyses, prices, other information, or links to third-party sites contained on this website are provided on an "as-is" basis, are intended only to be informative, is not an advice nor a recommendation, nor research, or a record of our trading prices, or an offer of, or solicitation for a transaction in any financial instrument and thus should not be treated as such. The information provided does not involve any specific investment objectives, financial situation and needs of any specific person who may receive it. Please be aware, that past performance is not a reliable indicator of future performance and/or results. Past Performance or Forward-looking scenarios based upon the reasonable beliefs of the third-party provider are not a guarantee of future performance. Actual results may differ materially from those anticipated in forward-looking or past performance statements. IC Markets makes no representation or warranty and assumes no liability as to the accuracy or completeness of the information provided, nor any loss arising from any investment based on a recommendation, forecast or any information supplied by any third-party.

DXY Watching 98.800 Resistance as Shutdown Risks Weigh on DollarHey Traders, in today’s trading session we are monitoring DXY for a potential selling opportunity around the 98.800 zone. The Dollar Index remains in a broader downtrend and is currently in a correction phase, with price approaching a key daily resistance area.
Structure: The market has been forming lower highs, consistent with bearish momentum. The 98.800 level aligns with both structural resistance and trendline rejection zones.
Fundamentals: The ongoing US government shutdown continues to pressure sentiment around the Dollar. The longer the impasse persists, the higher the risk of fiscal strain and downside pressure on the USD.
Next move: Watching how price reacts around 98.800 — a rejection here could confirm further downside continuation in line with the prevailing trend.
Trade safe,
Joe.

Dxy | Dollar indexSpecified lower low is a signal for bearish market but price needs a fake out before that.

DXY to break resistance and open the door to further buying?From the US Dollar Index, you can see that the USD has regained some poise and rallied for four consecutive days this week.
This has led the DXY north of a 3M resistance at 98.33 – which is now a marked support level – and subsequently led price action to another 3M resistance level at 99.40. Despite the high of 100.26, formed on 1 August, a meaningful break of the current resistance level, paves the way for a move to a 1Y resistance at 101.43.
FP Markets Research Team

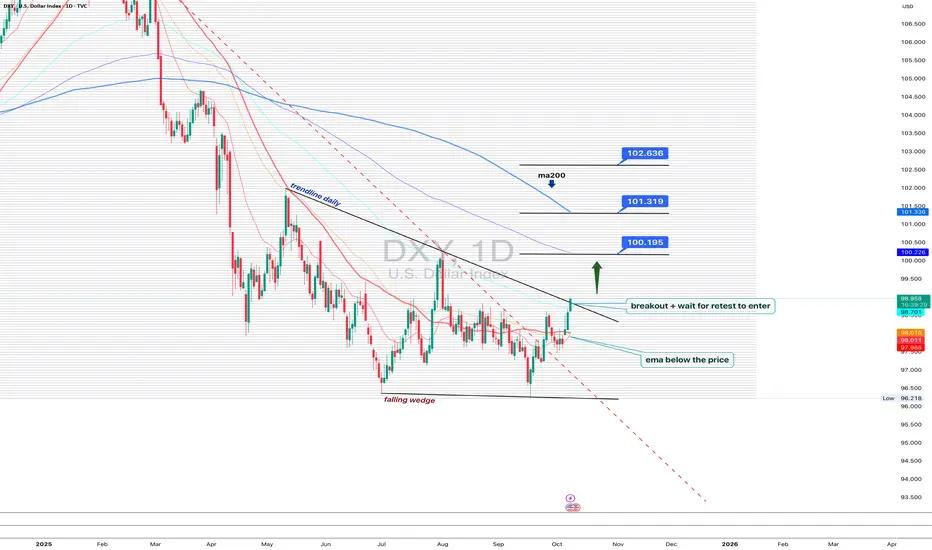
DXY 1D - dollar waking up, but patience is keyOn the daily chart, the US Dollar Index is showing the first signs of recovery: a falling wedge breakout and trendline breach hint that bulls are slowly reclaiming control. Price has moved above the EMA, a short-term bullish signal.
Still, MA200 remains above, reminding us that the broader trend is not yet flipped. The ideal play here - wait for a retest of the breakout trendline to confirm buyers’ strength before jumping in.
If price holds above 99.70, the next upside targets sit around 100.19, 101.31, and 102.63.
But keep in mind - DXY loves to test patience. False breakouts are its favorite sport.
Right now, the dollar looks ready to wake up, but maybe hit the snooze button one last time before the real move begins.
Dollar TVC:DXY
DXY Technical Outlook
The U.S. Dollar Index has successfully broken out of the long-term descending trendline and is showing strong bullish momentum.
Trend: Turning Bullish

$DXY at a key level: the dollar could reclaim its role as a safeTVC:DXY is currently at a key level.
Historically, when markets enter a phase of euphoria and everything rises simultaneously — TVC:SPX equities, TVC:GOLD gold, CRYPTO:BTCUSD crypto — the dollar tends to reassert itself as a safe-haven asset.
With major indices and technical indicators showing overbought conditions, and employment data beginning to weaken, a flight to safety into TVC:DXY over the coming months wouldn’t be surprising.
Moreover, the rate spread between the U.S. and Europe remains wide: the TVC:US10Y 10-year Treasury hovers around 4.3%, while the TVC:DE10Y German Bund stays near 2.3%.
This gap continues to attract capital flows toward dollar-denominated assets, reinforcing the greenback’s appeal even amid expectations of moderate rate cuts in 2025.
In our view, it’s worth holding liquidity and/or equivalents over the next few years to seize potential opportunities from a market crash or sell-off should the FED be forced to cut rates in the current environment of economic slowdown.
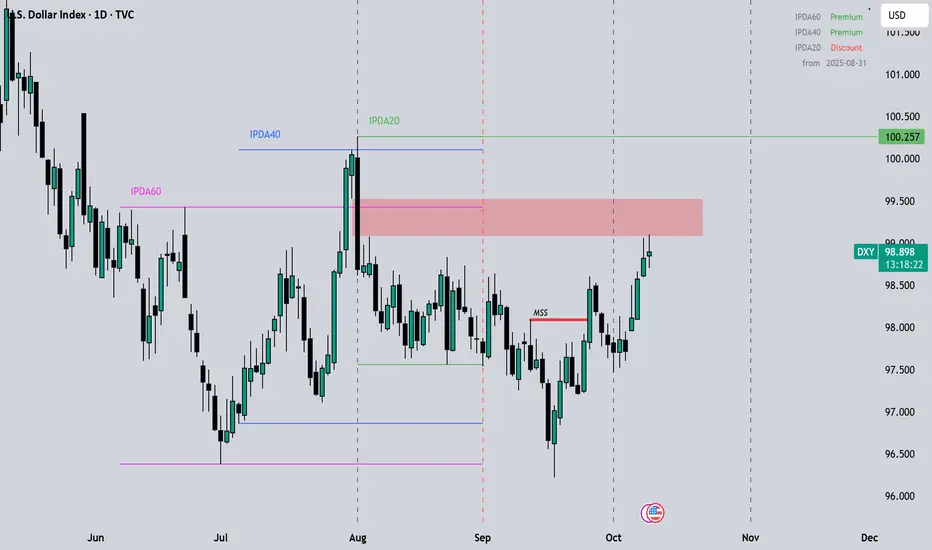
Dollar Index HTF BiasBased on the most recent Market Structure Shift, Quarterly Shift, using ICTs' IPDA 20-40-60 Lookback and Cast Forward.
I am expecting a DXY reaching 100.257 within this month, with a Daily SIBI getting ran through quite easily.
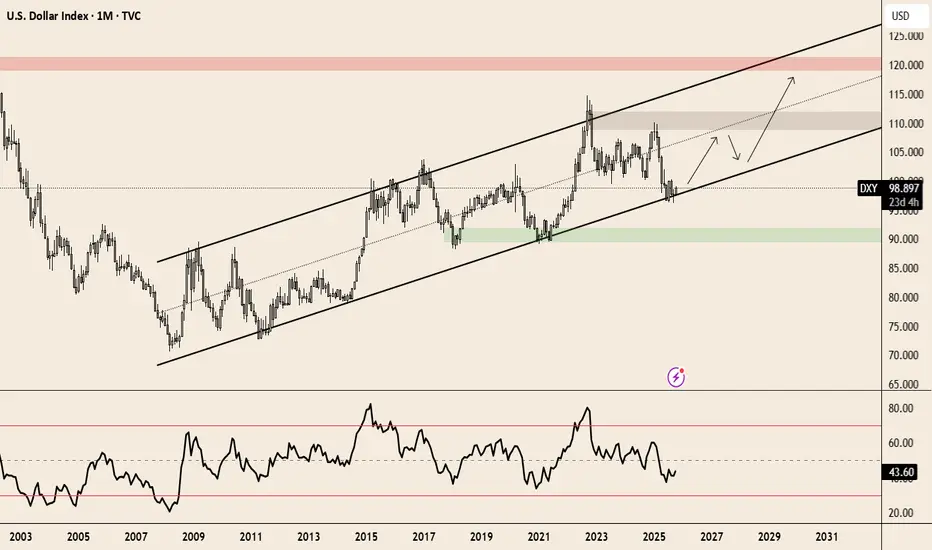
DXY Implusive Bullish Trend - Longter OutlookThe U.S. Dollar Index (DXY) appears to have completed a major A–B–C corrective supercycle that started in the mid-1980s, with wave C bottoming around 2008. Since then, the index has been forming a new impulsive structure (1–5) within a long-term ascending channel.
Currently, DXY seems to be developing wave (E) of sub-wave iii, which could mark a short-term top before entering a corrective wave iv phase near the 103–108 region. Once that correction completes, the next bullish leg — wave v — is projected to extend toward the 130–165 zone, signaling the potential start of a new bullish supercycle for the USD.
The parallel channel structure and long-term EMA support reinforce this view that recent weakness is corrective rather than a trend reversal, keeping the long-term outlook firmly impulsively bullish for the dollar.

Dxy Clear Trade - Patience is a keyEverything is on the chart
Head and shoulder when we flip the chart
Goodluck

DXY 4H – Possible Head & Shoulders Breakdown (My Bias)I’m watching DXY form a clean Head & Shoulders on the 4H chart. The neckline sits around 99.0 — if price breaks and retests, I expect a move toward 97.5 and possibly 96.0. My invalidation is above 100.2, near the right shoulder. Momentum seems to be fading, hinting at short-term weakness. I’ll wait for confirmation before acting.
⚠️ This isn’t a signal — just my personal bias and thought process on DXY.

BULLISH RUNwe are looking at a bullish run in the market, this run will be fueling up the drop in price of Gold as the DXY GAINS strength on Daily TF, this will allow us to go to LTF's and look for entry opportunities.

DXY BULLSDXY is currently sitting on a third touch of the trendline and we have a possible Fibonacci, consolidation,200 sma indicating bullish a breakout would take us to 104

U.S. Dollar Index: Wave C Downtrend Targeting New LowsTVC:DXY CAPITALCOM:DXY
📉 U.S. Dollar Index (DXY) – Wave C in Progress
The DXY remains in a corrective phase after completing Wave B₂.
A clear A–B–C structure is unfolding, with the current move forming the final Wave C.
The recent flag pattern (A–B–C–D–E) suggests a potential continuation to the downside.
A break below 98.86 would confirm the start of Wave 5 of C, targeting the 95.4 → 94.3 support zone.
Elliott Wave Overview:
Wave A: completed
Wave B₂: expanded flat
Wave C: unfolding with 1–4 structure complete
Key Levels:
🔹 Resistance: 99.75
🔹 Confirmation Sell: 98.86
🔹 Targets: 96-95-94-93
Bias remains bearish while price trades below 99.75.
