Trade ideas

Dxy HTF Patient is a keyEverything is on the chart
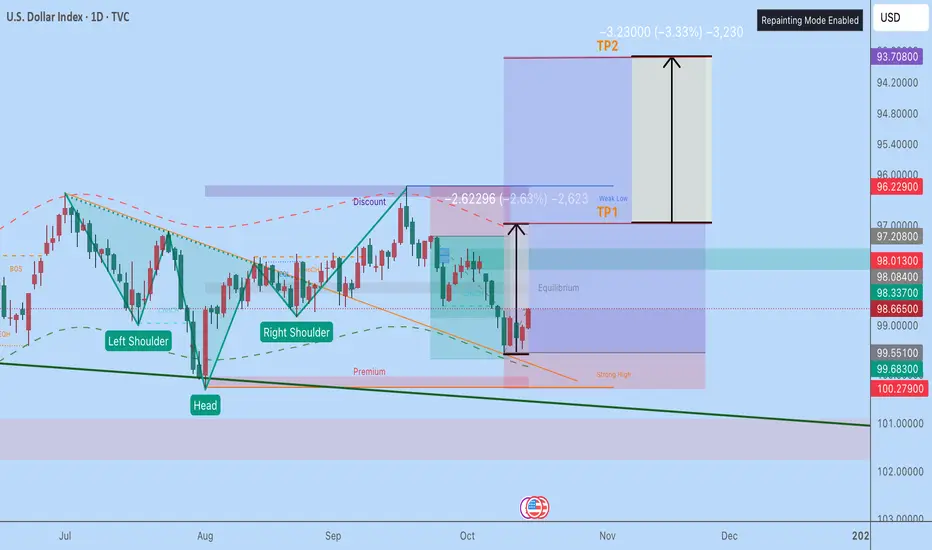
Retest the neckline, forming right shoulder
Time is a key to success
Goodluck
DXY - BearishIt looks bearish, but is just waiting for the right news to break that bottom rail
Not financial advice

DXYDXY is very bullish and we just hit our first tp of the week anticipating for a second take profit as Cot report indicated that we still bullish for the week.

US DOLLAR IS FILLING IN DISCOUNT
Traders are pricing in a possible Fed rate cut, while fresh U.S.–China trade tension adds uncertainty to global flows.
Technically, the dollar sits in its weekly mid-range, printing a 5th inside bar behind last Thursday’s move — the classic order-loading phase.
Price is rotating between a key bullish low weakness zone at 98.30 and a bearish order block near 99.00 — a compression range where liquidity builds before expansion.
Structure remains bearish-biased but currently in bull-back mode.
Buyers are pressing into bearish volume nodes, leaving no clean swing setups — just a 50/50 zone where patience pays.
Expect one side of this range to be cleared before the next directional leg.
Until then, we stay tactical — cross-market focused, scalping for bread and butter while the market sets up its next move.


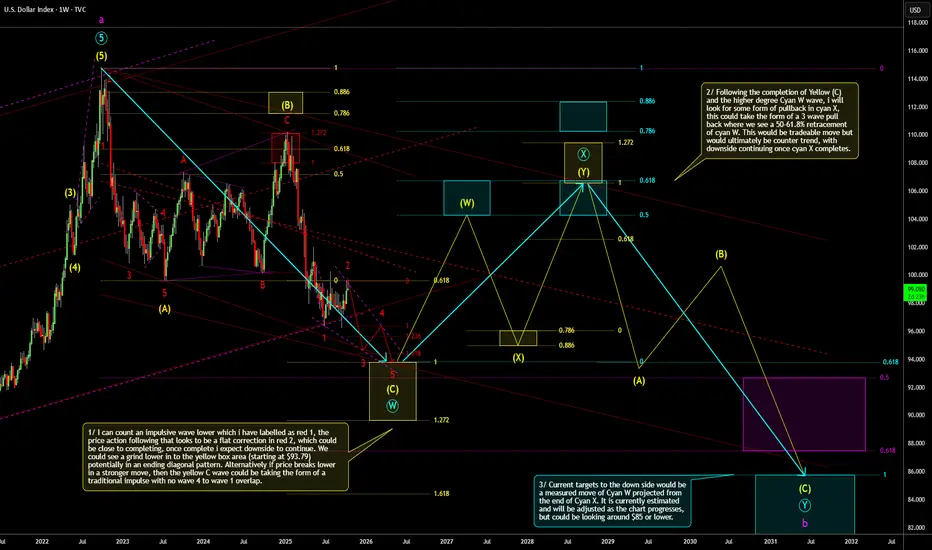
DXY Weekly Outlook (Count 3)This is a weekly timeframe outlook of the TVC:DXY . This is in alignment with my previously posted outlook which so far is playing out close to how I expected. This shows the wider view of what I think could be playing out. Still targeting the same yellow zone for a potential termination of the yellow (C) wave, after which we could see a counter trend consolidation. Current price action on the lower timeframe looks like it is forming a bearish flat correction which could be wave 2 in red. I'll look get a lower time frame update together, when time allows. More comments on the chart.
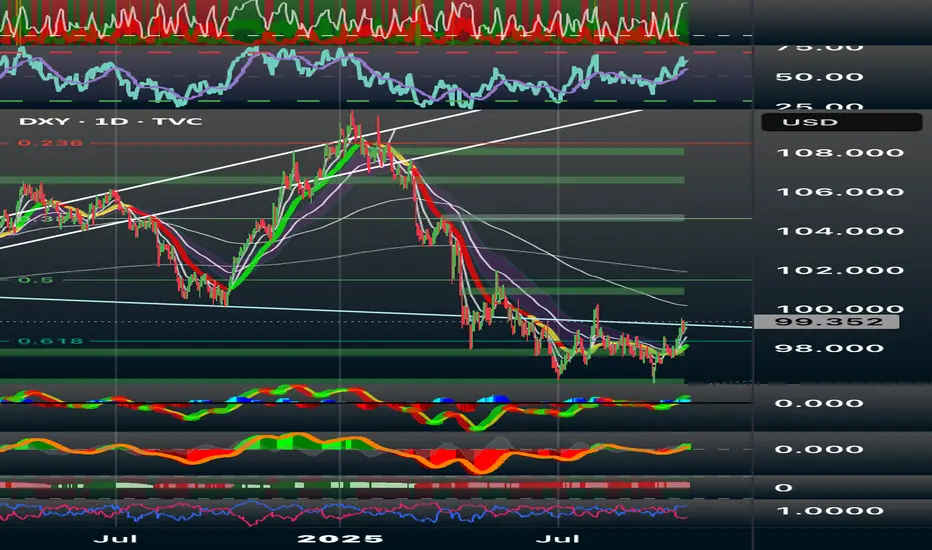
DXY: Key Reversal or Dead Cat Bounce?The U.S. Dollar Index has found footing around the 0.618 Fibonacci retracement near 97.8, breaking a long downtrend. Its push toward the 99.35–100 range suggests a possible retest of a broken structure and alignment with the 50-day EMA. I noticed this move also aligns with short-term recovery signals.
Technical View (1D)
RSI climbing above 50 hints at renewed momentum.
MACD turning green shows early signs of follow-through.
Price is testing 100–101, a former support turned resistance.
If momentum holds, 102, 104, and 106 are the next resistance zones.
Support remains steady at 98, 97, and 95.8, which are shown as strong confluence points with Fibonacci structure.
Scenarios:
If DXY closes above 100.3, I’d expect continuation toward 102.4 or 104.2.
Failure to clear 100 followed by a drop under 98.5 could send it back toward 97.2 or even 95.8.
For now, my bias stays neutral to slightly bullish in the short term. A clean breakout above 100 would confirm a structural shift upward. None the less, I’m watching U.S. yields and upcoming CPI data closely and considering the factor that stronger inflation or a hawkish Fed tone could fuel the next DXY leg higher.
Thank you for your time and support, and as always please remember that this is always NFA and DYOFR, respectfully.
DXYU.S Dollar Index
- Bullish Channel as an corrective pattern in Short Time Frame
- Break of Structure
- Completed " 12345 " Impulsive Waves and " A " Corrective Waves
- RSI - Divergence
- Order Block

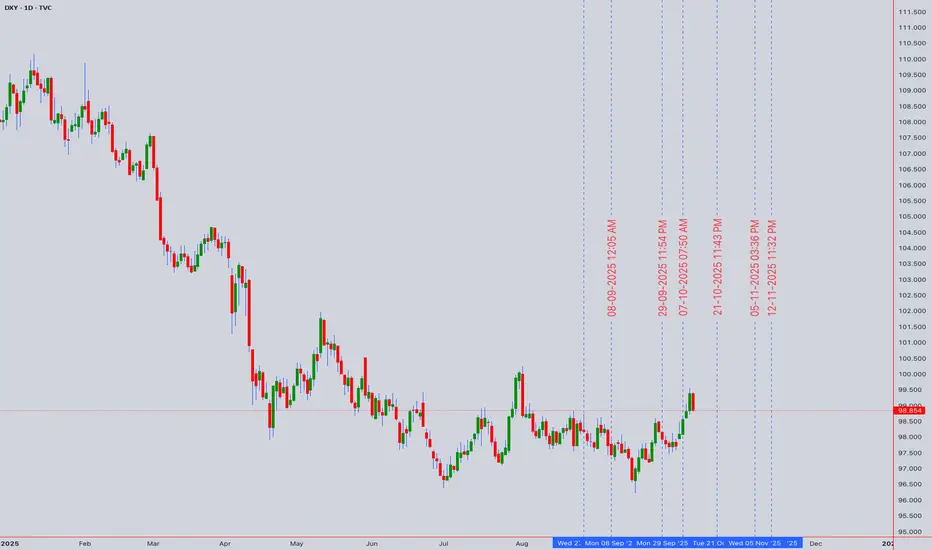
DXY key levels to look out for this week (WC 13/10)DXY key levels for the following week ahead. With Thursday heavy on USD news releases.

Like I said, DXY is now bearish. Buy Eurusd et alI published a trade idea before the big move down - It still stands, dxy is bearish. So just look for counter buy on EURUSD, GBPUSD et others.
Go through my page and see for yourself, if it comes to dxy and EUR, I'm hardly wrong. Don't miss this trade, trade accordingly
I think fundamental always wait for price to reach a specific level (technical) before news comes. How the hell did Trump start tariffing China once we entered that weekly FVG. It really amazes me.
All things been equal, liquidity is now remaining on the sell side and we will start looking for buy, if and only if those liquidity are taken.
These are levels we should keep eyes on as potential TP
TP 1 @ 97.96
TP 2 @ 97.46
TP 3 @ 96.215
DXY is still bearish, dont miss this trade. It may probably be the last ride down before we see higher dxy, I will update you guys then
Enjoy

Pair: DXY Date: 12 October 2025Market Context:
Price showed a rejection from the daily trend area around 98.997 – 99.193, creating a new downward movement.
Possible Scenarios:
1. Bearish continuation:
Price may continue toward the next support area at 98.300.
2. Short-term pullback:
Price could retrace to fill the previous IMB (Imbalance) and form a consolidation zone before continuing its move

Dollar at Max Deviation — Watching 99.197 CloselyThe dollar had another wild week, closing around 99.197 — right on the edge of major structure.
Most traders see strength, but when you zoom out, this move looks stretched.
Yields have started to cool off, which takes pressure off the dollar’s safe-haven run.
We still got smaller data releases like PMIs and Fed talks, but the big stuff like CPI is on hold until the U.S. shutdown clears.
Even the IMF warned about growing liquidity risks in global FX — meaning sudden spikes or fake outs can happen fast when markets get thin.
Technically, we’re in a bearish zone on the higher timeframe.
The last three months of liquidity targets are already taken, and the market’s now trading inside maximum deviation — a point where algorithms usually reset before any new trend forms.
That’s why 99.197 matters: it’s the last shelf before structure confirms the drop.
If price breaks and holds below that level early next week, momentum likely shifts bearish.
If it holds above, expect more sideways chop before a correction.
For now, it’s all about patience and tracking structure — not emotions.

DXY - 3 SCENARIOS - TRADING WEEK 13 - 17 OCTOBER 2025NEXT WEEK I FORESEE THREE DIFFERENT SCENARIO FOR THE DXY AS FOLLOW:
- THE DXY COULD POTENTIALLY USE 98.600 AS A SUPPORT ON THE WAY UP TO 99.600, 100.200 AND POSSIBLY 101.395
- (MY FAVOURITE) THE INDEX COULD BREAK 98.600 AND LOWER TO 97.800/97.700 COVERING LAST WEEk GAP AND RALLY-UP TROUGH THE WEEK
- IF THE INDEX BREAKS 97.700 WITH MOMENTUM WE COULD SEE A RE-TEST AND THE INDEX RALLYING DOWN FROM THERE CHALLENGING THE PREVIOUS LOW 96.260 (17 SEPTEMBER 2025) AND SEEK NEW LOWS.
Always be reactive rather than predictive, these 3 scenarios are well valid and i don't think we will see a fourth scenario ...
Please like, comment and share this idea if you liked it, I will keep updating it as the market starts

DXYDXY has given us push up last week, now it needs correction or impulse down.
Disclosure: We are part of Trade Nation's Influencer program and receive a monthly fee for using their TradingView charts in our analysis.

mrmoney limited DXY position/swing trading ideaprice has reacted from our monthly support level giving us pin bar which created a double bottom on the weekly time frame looking for mor bullish move for the time being except price reacts on our resistance level

Th Dollar rallies ⚠️ What Traders Must Know for Next Week
The US government shutdown fundamentally changes the trading environment for the week ahead by creating a severe "information vacuum."
A. The Data Blackout is the Biggest Risk
Delayed Critical Data: Key federal economic reports—such as the Consumer Price Index (CPI) and Non-Farm Payrolls (NFP)—are suspended until funding resumes. These are the reports the Federal Reserve uses to make policy decisions.
The "Flying Blind" Problem: Without objective, reliable inflation and employment data, the Federal Reserve and investors are "flying blind." This uncertainty forces traders to rely on technical analysis, geopolitical headlines, and potentially less reliable private-sector indicators (like ADP or private sentiment surveys).
Volatile Swings: The lack of scheduled market-moving news means any single, unconfirmed headline (e.g., a "leak" on a negotiation, a new tariff threat, or a surprise private data release) could trigger vicious, whipsaw price corrections due to thin liquidity and high uncertainty.
B. Trading Strategy Adjustments
Reduce Exposure: Consider decreasing your overall position sizes to manage the heightened, unpredictable volatility created by the data vacuum.
Focus on Cross-Pairs: Shift focus to non-USD pairs (e.g., EUR/JPY, AUD/NZD) where the primary fundamental drivers are clearer and not distorted by the US shutdown.
Monitor Geopolitics: The Dollar's strength is brittle. Any resolution on the trade war or signs of stability in Europe or Japan could quickly reverse the USD rally.
Look for Clues Outside the US: Pay extra attention to foreign economic calendars (like Chinese trade and inflation figures, or Australian employment data) to gauge global risk sentiment in the absence of US information.
The US Dollar enters the new week strong, but this strength is built on shaky foundations. Prudent traders must prioritize risk management over aggressive trend-following until the data flows from Washington are restored.

Weekend breakdown 11.10.2025Diversified watchlist for upcoming week.
Seems like the Q4 momentum is on its way
TVC:DXY
FX:GBPUSD
FX:USDJPY
FX:EURAUD
FX:AUDJPY

DXY Technical Analysis: Navigating Key Juncturre1. Big Picture & Market Context
The DXY is consolidating near a critical technical juncture. Geopolitical tensions and shifting rate expectations continue to be the primary drivers, creating volatility perfect for both intraday scalps and strategic swing positions.
2. Multi-Timeframe Technical Snapshot
Monthly/Weekly (Swing): Price is squeezed between the 50-week EMA (support ~98.20) and the 200-day SMA (resistance ~99.50). A decisive break either way will set the medium-term trend.
Daily (Swing & Intraday Bias): The chart shows a potential bearish flag formation following the recent decline. RSI (14) is neutral at 48, offering no extreme bias. The Ichimoku Cloud is thick above price, representing a significant resistance zone.
3. Elliott Wave & Harmonic Perspective
The pullback from the 100.50 high is being analyzed as either a Wave 4 (corrective) or the start of a larger bearish impulse. The key Harmonic zone for a potential bullish reversal (Bat pattern) lies between 98.30 - 98.50.
4. Key Support & Resistance Levels
Strong Resistance: 99.50 (200-day SMA & prior swing high)
Minor Resistance: 99.10 (Intraday)
Immediate Pivot: 98.85 (Current Price)
Strong Support: 98.50 (50-week EMA & 50% Fibonacci)
Critical Support: 98.20 (Breakdown Level)
5. Gann & Wyckoff Analysis
Gann Square of 9: Key levels align with 98.50 (support) and 99.20 (resistance). A close above 99.20 could trigger a run towards 99.80.
Wyckoff Cycle: Price action suggests we are in a possible Re-Distribution phase. A failure to hold 98.50 would signal a new Markdown phase, targeting 97.80.
6. Intraday Trading Strategy (5M-1H Charts)
Bullish Scenario (Long):
Entry: 98.55 - 98.65 (with bullish reversal candlestick confirmation)
Stop Loss: 98.35
Take Profit 1: 98.95
Take Profit 2: 99.15
Bearish Scenario (Short):
Entry: 99.05 - 99.10 (with bearish rejection confirmation)
Stop Loss: 99.30
Take Profit 1: 98.70
Take Profit 2: 98.50
7. Swing Trading Strategy (4H-Daily Charts)
Swing Long:
Entry Zone: 98.30 - 98.45 (Accumulation Zone)
Stop Loss: 97.90 (Daily Close)
Target 1: 99.20
Target 2: 99.80
Swing Short:
Entry Trigger: Daily close below 98.20
Stop Loss: 98.60
Target 1: 97.80
Target 2: 97.20
8. Indicator Cluster Consensus
Bollinger Bands: Price is trading in the upper band, indicating neutral momentum. A squeeze is forming, signaling a volatility expansion is due.
Anchored VWAP: (Anchored at last swing high) Price is below VWAP, indicating a Weak Bearish medium-term trend.
Moving Averages: The 50 EMA is about to cross below the 200 SMA on the 4H chart—a potential "Death Cross" warning for the week ahead.
Final Verdict: The DXY is at a make-or-break level. The bias is cautiously bearish below 99.10. The 98.50-98.20 zone is critical; a hold there could spark a relief rally, while a break opens the door for a significant swing down.
Disclaimer: This is technical analysis, not financial advice. Always manage your risk and use stop-loss orders.
NEW WORLD ORDER BLUEPRINT : THE GRAND DESIGN I have said everything in prior posts
but this analysis dates to ray dalios hegemony video
looks like this is the time
so dxy will rebound in value good news will spur the economic tank willthen crash trump vs powell you cant rig the economy couple this with the bad after taste of tariffs negative sentiment from the world no one coming to sretch their hand out then boom
ni hao wo jiao Lao Ban Muji, wo ai bin qili
ai, shuo, follow
zaijian

Bitcoin & DXY $ PA since 2008 shows BTC PA in ATH Zone - Why ?
Really easy one this.
There is only ONE Bitcoin ATH that happened when DXY PA was NOT on or below the Lower trend line that DXY PA has been in since 2008
And that was on the way lower but turned higher after the BTC ATH.
When I begain with Bitcoin in 2013, I was told, There is a correlation between DXY and BTC...."They go in opposite directions"
On smaller, this can appear to be False but looking at this Monthly chart, it Very clearly shows it is true.
The Day counts above are the days from when DXY first touches the upper trend line to the last week that PA touches the Lower trend line before rising higher again.
You can see that, apart from the 2nd ATH in 2021, there are 2 ATH for Bitcoin in the 2nd half of this day count.
The Green Box shows us the potential Zone for the next 2 BTC ATH. We have already reached a New ATH this "Cycle" but we have NO idea if a Higher ATH is Due or not.....We have to wait and see but the expectation is currently that we will.
The Vertical orange Dotted lines are previous USA election dates and I can see no real connection to these and DXY PA. Some are high, others are Low....However, the Next election is just after t his Bitcoin ATH Zone and so we may see some influences.
Something I also find interesting is how Bitcoin PA is rising in a similar way to how the DXY $ has since its Drash in 2008
The Monthly BTC chart
DXY since 2008 Monthly
You can clearly see the controlled rise and fall of PA within a channel,
This cycles Weekly Bitcoin chart is the first time we have seen that type of PA in a weekly cycle.
This is Bitcoin since Jan 2023 Weekly
So, we may have opposing PA action but we also have a similar style within a channel
Things to take note of.
We may have reached the BTC ATH zone already and we may not go higher, though the potential does exist to move further and, my opinion, is we will.
But it would be incredibly Nieve to assume it will go higher with out having some precautions in place.
Everyone talks about UPtober.
We have had RED Octobers - October 2012 was red and in the Middle f a Bull run
So Caution while we surf the crest of this Wave...
Just something I thought I would share.

US Dollar RECAPDollar Index (DXY) — Range Heat Building
You’ve got a weekly bearish range, with a key high at 99.8 and price now trading into bearish distribution around 99.0.
The dollar’s been front and center this week — while Washington argues over funding, it’s been doing real damage across cross-asset charts.
Price has been printing higher lows all week, grinding inside this bearish range.
That’s your profit-taking zone, not an add-on zone.
Stay patient. Let the range speak.

DXY- 4 HOUR TIMEFRAME ANALYSIS This is a clean and valid bullish channel on the U.S. Dollar Index (DXY), 4-hour timeframe. Let’s break it down technically and structurally 👇
---
🔹 Overall Trend: Strong Bullish Structure
The DXY is trending inside a well-defined ascending channel, showing higher highs and higher lows — the classic hallmark of a bullish trend.
Each time price touches the lower boundary (support trendline), buyers step in strongly, creating fresh impulsive waves upward.
The slope of the channel is consistent, confirming that bullish momentum is steady, not parabolic.
---
📊 Key Technical Levels
Current Price: 99.45 – 99.50
Upper Channel Resistance: Around 99.90–100.10 zone
Midline Area: Approximately 98.90–99.00 (often acts as short-term support/resistance)
Lower Channel Support: Around 97.50–98.00
---
🧭 Market Behavior
1. Momentum:
Price has recently broken above the last minor consolidation range and is now heading toward the upper boundary of the channel. This confirms a fresh bullish impulse leg.
2. Buyer Control:
The last few candles show strong bullish bodies with minimal wicks — indicating that buyers are dominating with little resistance so far.
3. Trend Continuation Bias:
The structure suggests continuation toward the upper trendline before any major correction occurs.
---
⚠️ What to Watch Next
Scenario 1 – Continuation:
If price maintains above 99.30–99.40, it could continue climbing toward the upper channel around 99.90–100.00.
→ That’s your short-term bullish target.
Scenario 2 – Pullback:
If there’s a rejection near the upper boundary (especially with long upper wicks or bearish engulfing), expect a retracement toward the midline (≈99.00) or even lower channel (≈98.00) for the next accumulation phase.
---
📈 Trading Insights
Buyers’ Edge: Buy retracements near the lower or midline of the channel as long as structure holds.
Profit Zones: Scale out or take profit near upper channel touches (~99.90–100).
Invalidation: A decisive break below 97.50 would invalidate the bullish channel and suggest a structural shift.
---
🔍 Institutional Context
Given DXY’s rise, this movement typically implies:
EURUSD and GBPUSD may face downward pressure.
Gold (XAU/USD) and Silver (XAG/USD) may pull back due to inverse correlation.
