AMP Futures | Introducing Table ViewIn this idea we will demonstrate how to access the new Table view feature using TradingView.
Related futures

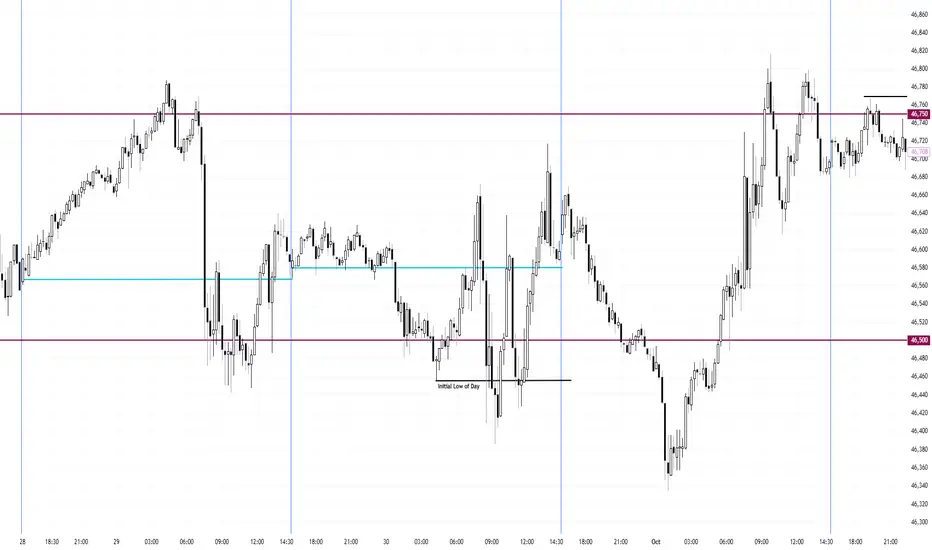
Daytrading Setup NY High of Day Dump Buy Low of Day TutorialOne of my favorite setups that I love to trade is the range day's New York High of Day dump buying Low of Day. This setup does not require ANY "top down" analysis and only requires the 15-minute chart. All you need is to wait a couple hours after NY opened and run its course.
By waiting, you accomp
YM - 10/112 lines color coded to the timeframe they were found on which shows the strength of the level. Higher timeframes stronger than lower ones
Month - pink
week - grey
day - red
4hr - orange
1hr - yellow
15min - blue
YM week 39Monthly Timeframe levels are in pink
Weekly = grey
Daily = red
4hr = orange
1hr = yellow
15min = blue
The Grey box is last weeks candle so its showing High, Low, and Median range of last week.
I went overboard with 20 levels marked on the chart.

YM 9/30Levels are marked on the screen and color coded to the timeframe they were created on.
Weekly box is grey and shows the high, low and median range.
The red box is a daily high, low and median from yesterday.
Orange levels are 4hr timeframe
yellow is the hourly timeframe and blue is the 15min tim
Dow Jones Futures October Rangebound GameplanGoing into October, Dow Jones is in a clear 1000 tick range from 46,000 to 47,000. Because of this, I will be setting my trend following strategy aside and pulling out my range bound toolbox.
Step one when in a range, stay away from the middle. Look for swing points in the middle to be swept.

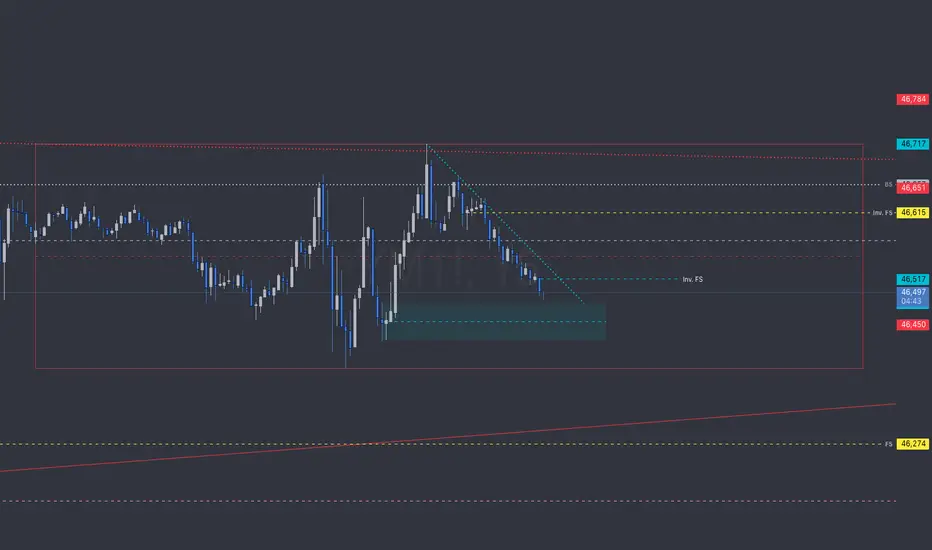
Bears Trapped at Key Support - Bulls Load for Reversal💡 To see my confluences and/or linework, Step 1: Grab chart, Step 2: Unhide Group 1 in object tree, Step 3: Hide and unhide specific confluences 📊
The Market Participant Battle:
Bears have exhausted themselves at a critical support zone (point 2 on the chart), where a set of proven market partic

YM 9/26I boxed last week in grey so we can see last weeks high, low and median range. then I skipped to the 4hr timeframe and marked out the levels and jumped to the 15min timeframe to plot the lower timeframe levels that stood out.
4 candles create 6 levels. I don't always mark all 6 levels. I like to f

YM 9/25boxes are daily candles in red and weekly in grey
orange are 4hr levels and yellow are 1hour levels

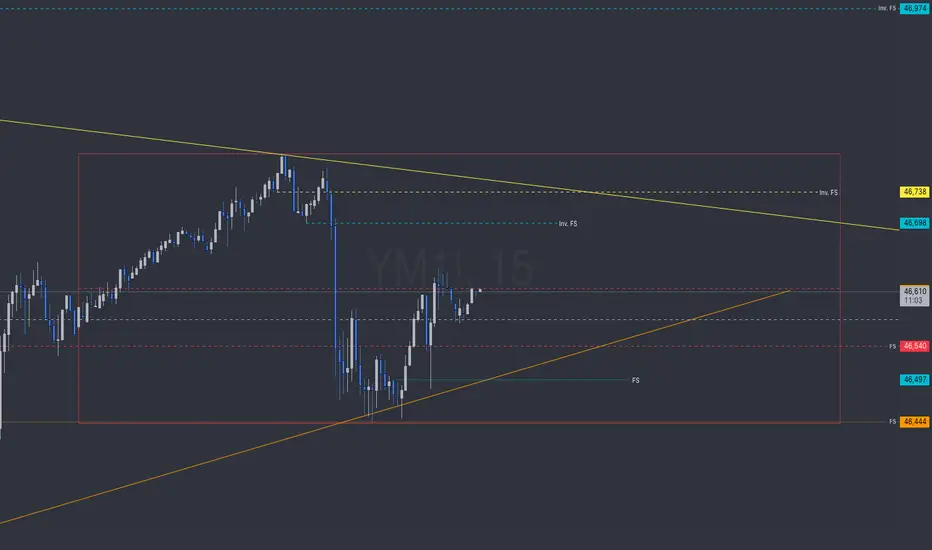
YM 10/7Highest timeframes are strongest
Weekly = grey
4hr = orange
1hr = yellow
15min = blue
5min = green
Inverse levels marked INV. FS or INV.BS are resistance levels unless solid lines
FS or BS levels are support unless solid lines
BS levels have an expectation to have a strong reaction to price whil

See all ideas
Summarizing what the indicators are suggesting.
Neutral
SellBuy
Strong sellStrong buy
Strong sellSellNeutralBuyStrong buy
Neutral
SellBuy
Strong sellStrong buy
Strong sellSellNeutralBuyStrong buy
Neutral
SellBuy
Strong sellStrong buy
Strong sellSellNeutralBuyStrong buy
A representation of what an asset is worth today and what the market thinks it will be worth in the future.
Frequently Asked Questions
The current price of DJIA Futures is 46,905 JPY — it has risen 0.19% in the past 24 hours. Watch DJIA Futures price in more detail on the chart.
The volume of DJIA Futures is 94.00. Track more important stats on the DJIA Futures chart.
The nearest expiration date for DJIA Futures is Dec 19, 2025.
Traders prefer to sell futures contracts when they've already made money on the investment, but still have plenty of time left before the expiration date. Thus, many consider it a good option to sell DJIA Futures before Dec 19, 2025.
Open interest is the number of contracts held by traders in active positions — they're not closed or expired. For DJIA Futures this number is 797.00. You can use it to track a prevailing market trend and adjust your own strategy: declining open interest for DJIA Futures shows that traders are closing their positions, which means a weakening trend.
Buying or selling futures contracts depends on many factors: season, underlying commodity, your own trading strategy. So mostly it's up to you, but if you look for some certain calculations to take into account, you can study technical analysis for DJIA Futures. Today its technical rating is buy, but remember that market conditions change all the time, so it's always crucial to do your own research. See more of DJIA Futures technicals for a more comprehensive analysis.