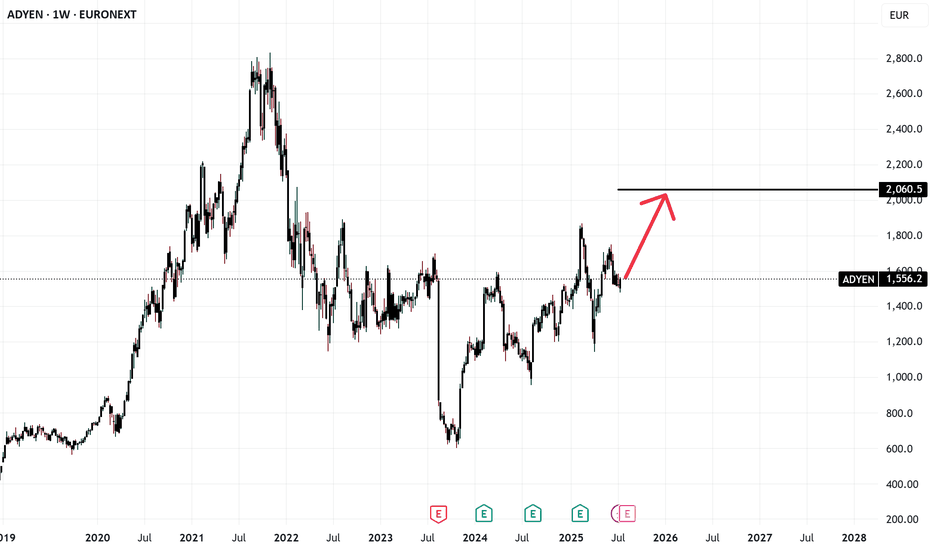
Adyen's stock price experienced a significant dropAdyen's stock price experienced a significant drop.
ADYEN plunged about 18% the past 24 hours. This decline followed the release of the company's half-year results, which revealed slower revenue growth and a lowered full-year outlook
Looking at the stock technically, I see that it is trading in an
Next report date
—
Report period
—
EPS estimate
—
Revenue estimate
—
0.35 USD
1.00 B USD
2.36 B USD
3.15 B
About Adyen NV
Sector
Website
Headquarters
Amsterdam
Founded
2006
ISIN
US00783V1044
FIGI
BBG00QB3LQX6
Adyen NV engages in the provision of payments platform business. Its products include online payments, point of sale, marketplaces, and unified commerce. The firm operates through the following geographical segments: Europe, the Middle East, and Africa (EMEA); North America, Asia-Pacific, and Latin America. The company was founded by Pieter van der Does and Arnout Diederik Schuijff in 2006 and is headquartered in Amsterdam, the Netherlands.
Related stocks
Adyen (ADYEN) – Technical Analysis and 1W OutlookTechnical Analysis
Adyen's stock is forming a symmetrical triangle, indicating a potential breakout. The recent price surge confirmed the pattern's breakout, but a correction toward the 0.618 Fibonacci level (1457.2 EUR) is possible, acting as a key buying zone.
Key Levels:
Resistance: 1720.8 E
$Adyen Triangle target reachedFrom false moves come fast moves. Symmetrical triangle had everyone fooled when it broke out and up only to reverse and break down with target of 610 reached. Could see an automatic rally B C move next to attempt to close upper gap. Any movement into the lower demand band below usually triggers ral
See all ideas
Summarizing what the indicators are suggesting.
Neutral
SellBuy
Strong sellStrong buy
Strong sellSellNeutralBuyStrong buy
Neutral
SellBuy
Strong sellStrong buy
Strong sellSellNeutralBuyStrong buy
Neutral
SellBuy
Strong sellStrong buy
Strong sellSellNeutralBuyStrong buy
An aggregate view of professional's ratings.
Neutral
SellBuy
Strong sellStrong buy
Strong sellSellNeutralBuyStrong buy
Neutral
SellBuy
Strong sellStrong buy
Strong sellSellNeutralBuyStrong buy
Neutral
SellBuy
Strong sellStrong buy
Strong sellSellNeutralBuyStrong buy
Displays a symbol's price movements over previous years to identify recurring trends.
Curated watchlists where ADYEY is featured.


